Barriers to Financial Inclusion
Dr. Sanjeev Bansal
Ms.Alka Ranga
Abstract
Financial Inclusion is an important step towards inclusive growth. It helps in the overall economic development of the disadvantage population. Literacy, health, and communication are some of the essential ingredients needed for inclusive growth .The main four pillars of inclusive growth are productivity, employment, financial inclusion and infrastructural development. Financial Inclusion is important because it is considered as an important condition for sustaining growth. The core of financial inclusion is financial freedom that is sense of financial security equipped with a set of skills and knowledge. The objective of financial inclusion is to extend the scope of activities of the organized financial system to include with in its ambit people with low incomes. In India most of the population is related with poor strata .Financial Inclusion can only improve their well being .Financial Inclusion is only possible through Micro Finance Programmes. This paper examines the Barriers to financial Inclusion and also discusses how micro finance programmes/services promotes financial inclusion to overcome barriers to financial inclusion.
Key Words: financial Inclusion, Inclusive Growth, Micro Finance Progammes, Sustaining Growth.
Financial inclusion is delivery of banking services at an affordable cost to the vast sections of disadvantaged and low income groups. The main focus of financial inclusion in India is to promote sustainable development and generating employment in rural areas for the rural population. Financial inclusion is intented to connect people to banks with consequential benefits. Ensuring that the financial system plays its due role in promoting inclusive growth.
Objective of Financial Inclusion
Financial Inclusion is a very useful tool for financial growth of India. The objective of financial inclusion is to deliever banking services at an affordable cost to vast sections of the low income groups and also includes the objective of providing cheap loans to the most downtrodden people because their essential requirement from banking system is get access to funds to sustain their livelihood. The financial services include the entire gamut-savings, loans, insurance, credit, payments, etc. By providing these services,the objective is to help them come out of poverty.
Importance of Financial Inclusion
Importance of financial inclusion aries from the problem of financial services across the world. Financial inclusion is also to promote sustainable development and generating employment for a vast majority of the population especially in the rural areas. In the first ever index of financial inclusion to find out the extent of reach of banking services among 100 countries,India has been ranked 50. At present only 34 % of the India’s population has
access to the basic banking services. The latest National sample survey orginazation reports that there are over 80 million poor people living in the cities and towns of India and they lack access to the most banking services, such as service accounts, credit, remittances, and payment services, and financial advisory services. Low income group don’t have access to the formal banking systems, as they usually don’t have the documents needed to open a bank account .As a result, they depend on the informal sector for their savings and bank accounts. Recognising the importance of inclusive growth in India, efforts are being taken to make the financial system more inclusive. The initiatives towards financial inclusion started in India with nationalization of banks in the year 1969. Presently 2.5 billion working age adults globally have no access to the banking services delivered by regulated financial institutions.
The board strategy for financial inclusion in India in recent years comprises the following elements: 1.Encouring penetration into unbanked and backward areas and encouring agents and intermediaries such as NGO’s, MFI’s, CSO’s, and business correspondents(BC’s). 2. Focusing on a decentralised strategy by using existing arrangements such as State Level Bankers Committee (SLBC) and district consultative committee(DCC). 3.Emphasis on financial literacy and credit counseling.
Role of Micro Finance Programmes
In India, the focus of the financial inclusion at present is confined to ensuring a bare minimum access to a savings bank account without frills, to all. Internationally, the financial exclusion has been viewed in a much wider perspective. Micro Finance programmes have a potentially significant contribution to economic, social, political and psychological empowerment of the poor. All microfinance programmes interventions target one thing in commen human development that they cater for. A part from formal banking institutions, which should look at inclusion both as a bussiness opportunity and social responsibility, the role of self help group (SHG’s) movement and microfinance
institutions (MFI’s) is more important to improve financial inclusion.
Barriers to Financial Inclusion
In India, the financially excluded sections comprises largely rural masses comprising marginal farmers, landless labourers, oral lessees, self-employed and unorganized sector enterprises , urban slum dwellers ,migrants, ethnic minorities and socially excluded groups, senior citizens and women. Some of the important causes of relatively low extension of institutional credit in the rural areas are risk perception ,cost of its assessment and management ,lack of rural infrastructure, and vast geographical spread of the rural areas with more than half a million villages ,some sparsely populated (Mohna,2006). India currently faces several Barries in the area of financial inclusion for inclusive growth like lack of money resources, lack of information and awareness people from excluded section, expensive to use the services ,distance to the nearest financial service provider, insufficient documentation, inability to provide a legal identity. Here the main objective of this paper is to investigate physical barriers to financial inclusion and will give answers of two questions under barriers to financial inclusion across India.
Barriers to Financial Inclusion Under sector level
specific questions are sought to be answered through this enquiry and tables provides the Microfinance Penetration in India, Population per Bank Branch in Indian States, Matrix on Availability of Microfinance and banking services and perspectives on the polices of MFIs.
First; Are microfinance services uniformly available in all regions of India?
Second; Do microfinance programs focus on geographic areas that are not adequately served by the banking sector?
The first question is important because if the microfinance sector is to play a role in providing financial inclusion, it needs to be available in all regions and not only in specific areas. The answer to this question will enable us to understand if there are barriers to microfinance access (like there are barriers to financial inclusion). The second question enables an analysis of the spread of microfinance services vis-a-vis that of banking services. The relationship could help reveal the extent to which microfinance programs fill gaps in banking sector services.
To answer the first question, the Microfinance Penetration Index (MPI) and the Microfinance Poverty Penetration Index (MPPI) which have been reported in the Microfinance India state of the sector report (Srinivasan, 2009) are studied as they indicate the availability of microfinance in different states in the country. While the MPI compares a state’s share in the total number of microfinance borrowers in the country to its share of the country’s population, MPPI compares the state’s share in the total number of microfinance borrowers to its share of the population of poor in the country.
In order to estimate the indices, first the number of MFI borrowers and SHG members with outstanding loans from banks are computed. Then each state’s share of microfinance customers (including both models) in the country is estimated (MF share). The MPI is computed by dividing the MF share by the state’s share in the population of the country (population share).
MPI=MF Share / Population Share
The MPPI is derived by dividing the MF share by the state’s share in the population of poor in the country (Poverty share).
MPPI=MF Share/ Poverty Share
Since MF share is in the numerator in the case of both indices, an MPI value greater than 1 indicates that the state’s share of microfinance borrowers exceeded its share of the population while an MPPI value greater than 1 indicates that the state’s share of microfinance exceeded its share of the population of poor (Srinivasan, 2009).
Microfinance Penetration in India
STATE MPI (2014) MPPI (2014) MPI (2015) MPPI (2015)
NORTHERN REGION
HP 1.33 1.47 1.29 3.12
RAJASTHAN 0.75 0.95 0.39 0.50
HARYANA 0.14 0.28 0.16 0.31
PUNJAB 0.09 0.29 0.14 0.44
J&K 0.09 0.44 0.02 0.09
NEW DELHI 0.04 0.09 0.09 0.17
TOTAL(A) 0.43 0.76 0.28 0.48
EASTERN REGION
ASSAM 1.08 1.50 0.74 1.03
MEGHALYA 0.13 0.19 0.23 0.33
TRIPURA 0.55 0.82 0.99 1.46
SIKKIM 0.16 0.19 1.65 2.06
MANIPUR 0.31 0.50 0.32 0.53
AP 0.11 0.17 0.83 1.31
NAGALAND 0.15 0.22 0.06 0.10
MIZORAM 0.65 1.45 0.47 1.08
TOTAL(B) 0.84 1.21 0.68 0.98
EASTERN REGION
ORISSA 2.68 1.59 2.13 1.26
BIHAR 0.3 0.2 0.25 0.16
JHARKHAND 0.43 0.29 0.37 0.25
WB 0.99 1.1 1.45 1.61
TOTAL © 0.94 0.71 0.98 0.74
CENTRAL REGION
MP 0.37 0.27 0.37 0.26
CHATTISGARH 0.85 0.57 0.83 0.56
UP 0.37 0.31 0.18 0.15
UTTARAKHAND 0.69 0.48 2.46 1.71
TOTAL(D) 0.42 0.33 0.35 0.28
WESTERN REGION
GUJARAT 0.35 0.57 0.16 0.27
MAHARASHTRA 0.97 0.87 0.9 0.8
GOA 0.27 0.5 0.46 0.86
TOTAL(E) 0.75 0.8 0.64 0.69
SOUTHERN REGION ANDHRA
PRADESH 3.03 5.27 3.84 6.68
KARNATKA 2.15 2.37 1.94 2.14
KERALA 1.29 2.36 1.16 2.13
TAMIL NADU 2.18 2.66 2.24 2.73
percent and 58 percent respectively. in 2014.Even within the Southern region, it is found that that MPI and MPPI is unusually high for one particular state, Andhra Pradesh (AP). MPI for the two years ended 2014 and 2015 is 3.03 and 3.84 while MPPI is 5.27 and 6.68. In this state, there are 20 million microfinance accounts (both SBLP and MFI put together) but there are only 16 million households in the state..
The Southern states are followed by the Eastern, Western and North-Eastern regions in terms of microfinance penetration. In these areas, MPI was between 0.5 and 1. In the central and northern parts of the country however, MPI was less than 0.5. MPPI also follows broadly the same trend. The Northern and Central regions however have MPIs and MPPIs lower than 0.5 indicating that these regions are clearly lagging in microfinance penetration. Even within each region, some states are exceptions to their region in terms of microfinance penetration. For example, within the Northern and Central regions (which show low penetration) there are exceptions such as Himachal Pradesh (North) and Uttarakhand (Central region) with MPIs and MPPIs in excess of 1.0. Similarly, within the Eastern and North East regions (which show high penetration), Bihar in the East and Nagaland in the North East have MPIs equal to or less than 0.25.
It is clear that the conditions for microfinance activities are not perceived to be uniformly conducive in all parts of the country. While in some states, the penetration of microfinance is assuming exceedingly high levels leading to fears over multiple lending; in other states vast sections of the low income households are underserviced. The availability of better infrastructure and governance is likely to be one feature which differentiates states that have achieved considerable outreach and those that have not. There is a need to make underserved areas more attractive for microfinance providers
To answer the second question, it is proposed to examine if areas not adequately served by microfinance are adequately served by the mainstream financial sector. A study on similar lines by Kumar and Golait (2015) examined only one model of microfinance, the SBLP. The study found that the latter was prevalent in areas where the banking sector was also prevalent. This conclusion may have been expected as bank branches play an important role in the SBLP.
Using the MPIs which summarize availability of both predominant models of microfinance, it is attempted to identify if areas not adequately served by microfinance are served adequately by the mainstream banks. The reason for choosing MPI over MPPI, as the key measure of microfinance penetration is that MFIs in India doesnot use the “BPL” list to guide them in choosing theircustomers. Moreover, as pointed out by Robinson (2001), microfinance may be more useful for the better off among the poor who may in fact be slightly above the poverty line. As at present there is no measure available which measures the microfinance penetration as a proportion of this segment within each state, the MPI which measures microfinance penetration as a proportion of the population of the state seems to be the best available option.
its population, a ratio of 0.5 indicates that 50 percent progress has been made. In the case of average population per bank branch, as “15” is the national average, regions having higher than average figures can be considered as having “low banking coverage” while those having lower than average figures can be considered as having “high banking coverage”.
Population per Bank Branch in Indian States
NO. OF BRANCHES AV POP PER BRANCH
ALL INDIA 76,891 80,369 15 15
NORTHERN
REGION 13,175 13,800 12 11
NORTH-EASTERN
REGION 2,051 2,133 21 21
EASTERN REGION 13,017 13,406 19 19
CENTRAL REGION 15,328 16,027 19 19
WESTERN
REGION 11,839 12,440 14 14
SOUTHERN
REGION 21,481 22,563 11 11
Matrix on Availability of Microfinance and Banking Services
LOW AVAILABILITY OF MICROFINANCE
HIGH AVAILABILITY
OF MICROFINANCE LOW AVAILABILITY OF
BANKING SERVICES
CENTRAL REGION NORTH EASTERN
REGION
EASTERN REGION HIGH AVAILABILITY
OF BANKING SERVICES
NORTHERN REGION SOUTHERN REGION
WESTERN REGION The matrix leads to the following observations:
1. In the North Eastern and Eastern regions of the country where the number of bank branches relative to the population is low, microfinance has made considerable progress in increasing access to financial services.
2. In the Northern region, where bank branches relative to the population is high, microfinance access is low.
3. The Southern and Western regions of the country have higher than average number of bank branches to their population and have also seen high access to microfinance.
4. The Central region seems to have lower access to both bank branches and microfinance. An examination of the intra-regional figures however suggests that within the Central region, Uttarakhand is greatly favored by both the banking and microfinance sectors. Chhattisgrah also has substantial microfinance access as reflected by its MPI of 0.83 though its banking coverage is low at 20,000 persons per bank branch. Uttar Pradesh and Madhya Pradesh on the other hand have not exhibited adequate bank branch or microfinance coverage.
the country. There is an equally great need to monitor microfinance growth in areas where it has already reached near-saturation levels. While the later is likely to benefit from the ongoing initiative to set up a credit bureau in the country, the former needs intervention from policy makers. There is a need to make underserved areas more attractive for microfinance providers. There is a need for coordinated action between the banks,the government and others to facilitate access to bank accounts amongst the financially excluded. Financial inclusion as a co-operative social Responsibility of all the banks and financial institutions, and the role of self help groups (SHG’s) movement and micro finance institutions (MFI’s) is important to improve barriers under financial inclusion. With the help of MPI and MPPI we can measure the micro finance availability of regions in all over India. A fall in MPI over time implies that the growth in microfinance was lower than the national rate of growth. An increase in MPI implies that the regional growth was higher than the national rate.
Conclusion
It is essential for any economy to aim inclusive growth involving each and every citizen in the economic development progression; it is in this context that financial inclusion should be aimed at inclusive growth in the Indian context. Significant progress towards financial inclusion has been made through various initiatives taken by the Government, RBI, Banks NGO’s, ICT and various IMFs etc. This paper has also shown that there exist differences in financial inclusion across India under sector level enquiry to find physical barriers all over India. It is clear that the conditions for microfinance activities are not perceived to be uniformly conducive in all parts of the country. The results displayed in the form of a matrix which is obtained by cross-tabulating microfinance availability with banking access. To overcome these types of barriers various models have been tested for financial inclusion .It is important that State Governments should be asked by the Central Government to play a pro-active role in facilitating Financial Inclusion, banks should start addressing the issue of financial illiteracy by organzing campaigns, Issuing official identity documents for opening accounts, creating awareness and involving district and block level functionaries in the entire process, meeting cost of cards and other devices for pilots, undertaking financial literacy drives are some of the ways in which State and district administration have involved themselves .Hence these types of barriers should be overcome with the help of all programes taken by Govt. sector ,banks and various financial institutions through Micro finance Models like SBLP and IMF model etc.
References
1. Akerlof, G.,(1970). The market for lemons: quality uncertainty and the market mechanism. Quarterly Journal of Economics, 84 (August), pp. 488-500.
2. Akula, V.,(2004). Assessing Microfinance: An Investigation on whether Microfinance reaches the very poor. PhD Thesis, University of Chicago.
3. Arun,T;andKamath,R; (2015).Financial Inclusion:Policies and Practices.IIMB Management Review.
4. Beck,T., Demirguc-Kunt,A. and Martinez Peria,M;(2007). Banking Services for everyone? Barriers to bank access and use around the world Policy Research Working Paper 4079. Washington DC: World Bank.
5. Beck,T;and Hoseini,M;(2014).Informality and access to finance: Evidence from India.
7. Bose,S.,(2005). Regional rural banks: The past and the present debate. Available from
8. Collins, D., Morduch, J., Rutherford, S. And Ruthven, O., (2009). Portfolios of the Poor. New Jersey: Princeton University Press.
9. Cole,S. Gine,X., Tobacman,J., Topalova, P., Townsend. R. and Vickey, J., (2009). Barriers to household risk management: Evidence from India. Harvard Business School Working Paper 09-116.
10.Conroy,J.,(2006). Successful microfinance in the Pacific: Achieving Financial Inclusion. Pacific Islands Forum Secretariat.
11.Duflo,A., Jain, J.K. and Pasheva,V.,(2005). Expansion strategies for Microfinance institutions in India Centre for Microfinance, Chennai.
12.Economist, (2009). The power of mobile money Economist September 26th – October
2.
13.Goldberg,N. (2005). Measuring the impact of microfinance: Taking stock of what we know. Grameen Foundation USA Publication Series.
14.Helms, B. and Reille, X.,(2004). Interest Rate Ceilings and Microfinance the story so far. CGAP Paper.
15.Ledgerwood, J.,(1999). Microfinance Handbook. Washington: The World Bank.
16.Mahajan, V.,(2007). Charting the History of Microfinance in India. ISB Insight, March.
17.Panikkal,S., Venkata, N.A. and Ravi Kumar, T.V.S., (2010). Risks and challenges in individual lending. Microsave India Focus Note 34.
18.Santaigo,J; (2006). The relevance of involvement of self help groups and empowerment: Findings from a survey of rural women in Tamil Nadu Ph.D.Thesis, McGill University.
19.Sadoulet,L. And Carpenter, S; (2001). Endogenous matching and risk heterogeneity: evidence on microcredit group formation in Gautemala. Working paper, ECARES/ Free University of Brussels.
20.Sarma,M; (2008). Index of Financial inclusion. Working Paper 215 ICRIER.
Ms Rupal Thakkar
Dr Kalpana Kharade
Abstract
In this study, experiential learning approach was used for training pre-service teachers for teaching of Environmental Education. 30 pre-service teachers were engaged as participants in getting equipped in using experiential learning approach for teaching environmental education. I have adopted Case study method for this study. Data was collected from focus group interview of the 3 groups of pre-service teachers. Thematic analysis was used for analysis of the data. The responses of the pre-service teachers on focus group interview showed that the pre-service teachers found experiential learning as a foundational component of environmental education and the pre-service teachers realized that each of the experiential learning attributes is important to consider for planning for topics of environmental education.
Key words: Experiential Learning, Environmental Education and Pre-service teachers
Introduction
We are living in a rapidly expanding, changing society which is intruding technology and automation in our lives. Children have forgotten to appreciate the natural environment and subject like environmental education has been taught using conventional modes where focus was on memory where as John Dewey (1938) said that experience and education are two concepts which are strongly related to the learning process. Hence, experience is an important component of the learning process (Higgins & Nicol, 2002). The nature of environmental education course is interdisciplinary which demands focus on real life as well as practical exposure, group work but school curriculum emphasise more on knowledge , solve abstract problems and support individualism.So if want to change the attitude of people towards environments, educational experiences have to be more enriching and meaningful. Loughland, Reid and Petocz (2002) mentioned that environmental education is seen to be an important strategy in achieving environmental improvement. Firstly the teachers themselves should be trained with innovative approaches and unique experiences to transact environmental education related topics. Higher education institutions have crucial roles in updating teachers with knowledge about environmental education (Eroglu, 2009).Therefore, the need is that teacher education colleges should create platform for field-based opportunities which can enable pre-service teachers to connect educational philosophies with classroom practices. UNESCO UNEP, (1977) report stated “All these educational activities call for research on the use of methods of instruction that will facilitate the learning, teaching and assessment of environmental education.” So it is very vivid from this statement that there is need to explore effective methods for teaching environmental education and infusing guided experiential learning activities for students should be mandatory. Dewey (1939) pioneer of experiential learning also pointed out that it is the role of educators to arrange for practices
Assistant Professor, K J Somaiya College of Education, Training and Research
that promote more favourable experiences. Infusing environmental education in pre-service teacher education and university education is must for prospective teachers as they are going to teach future citizens(Manzanal et al., 2007; Salomon, & Perkins, 1989).Therefore, in the current study, the researcher designed an add on progarmme on experiential learning approach for teaching of environmental education and wanted to explore the perceptions of pre-service teachers about using experiential learning approach for teaching of environmental education.
Literature review
Robottom, I. (1987) promotes professional development to support teachers ’pedagogical approaches to EE, which differ from traditional teaching approaches.Uzun and Keles (2012) in their study used outdoor education model to train 25 teacher candidates and the results showed a significant improvement in the attitudes, awareness and behaviours of these teachers. Pace (2010) reported in his study that main factor that influenced the effects of pre-service teachers programmes on environmental education and education for sustainable development was its experiential methodology rather than its content.Palmberg,Kuru (2000) found that outdoor activities to be effective among pre-service teachers, found attitude, value, belief, and behaviour led to responsible environmental behavior.According to Tsaggaridou (2008) there is a necessity of examining teachers’ thoughts and actions, in order to investigate the factors that affect the quality of teaching contributes to the disentanglement of different ways teaching. Although many institutions in India as well as in abroad might be trying out experiential learning for the students but there is little in the literature about how it is perceived by students as well as by teachers and how such experiences are integrated into different disciplines but success of any programme depends upon how it is taken by the teachers as they are going to implement it only if they perceive it in a positive direction.Therefore the researcher had undertaken this study where the pre-service were oriented to the concept of experiential learning using 3 phase add on programme designed by the researcher and after that perceptions of pre-service teachers regarding use of experiential learning for teaching of environmental education was explored through focus group interviews.
Purpose of the study
The purpose of this study is to describe the pre-service teachers’ perceptions regarding use of experiential learning approach for teaching of environmental education. In this study, experiential learning was operationalised as add on program me which the pre-service teachers had undergone for getting trained in experiential learning. In order to achieve this purpose, the following research question was created:
What are the perceptions of pre-service teachers about experiential learning approach for teaching environmental education?
Method
In this research case study was undertaken to study the pre-service teachers’ reflective practices using experiential learning approach in environmental education.
Participants and context
The study involved 30 pre-service teachers, who had opted for environmental education as a special field in the year 2014-15 from one of college of education in Central Mumbai.
In this study, focus group interviews were used to gaze the perceptions of the pre-service teachers about use of experiential learning approach for teaching environmental education. Thus, focused group interviews using semi structured type were used with each of the three identified groups to provide open discussion based on specific questions. The questions of focus group interview were reviewed by experts for clarity and content purposes. Interviews helped to know about pre-service teachers’ perceptions about experiential education as an appropriate pedagogy for environmental education. The entire three semi structured group interviews were audio recorded by the researcher. In focus group interview following 7 questions were asked in three sub groups:
1. What are some of learning assumptions you would make about the experiential learning as an appropriate teaching and learning process for Environmental Education?
2. How has the experiential approach to learning impacted upon your professional development as a teacher of environmental education?
3. What kind of beliefs you had formed about experiential learning?
4. After this entire journey of this course, do you feel you see things in a different way, or do things in a different way?
5. To what extent does the experiential approach meet the aims and objectives of environmental education?
6. What are some of the factors that create obstacles for you using the Experiential learning approach in school?
7. What are some of the factors that facilitated using the Experiential learning approach?
Procedures
The researcher had developed an add on programme using ADDIE model on experiential learning by considering base of experiential learning cycle given by Pfeiffer and Jones (1985).
Following were the steps of experiential learning cycle
• Experiencing - In this first stage the pre-service teachers experienced the orientation and activities related to experiential learning where the participant experienced the learning on a first-hand basis. In each phase the participants experienced a sequentially progressing training module.
• Sharing – During this stage, the pre-service teachers shared what they observed and
how they felt during the different phases of add on programme.
• Processing - In this stage, the pre-service teachers systematically examined what they experienced and how they felt about it.
• Generalizing - In this stage the pre-service teachers made connections between the activity and everyday life. This step was to make experiential learning practical.
• Applying- At this stage, the pre-service teachers came out with future plans to organise experiential learning activities for infusing in various disciplines.
• Evaluation -The purpose of adding this stage to the experiential learning cycle was to enable pre-service teachers to evaluate the experiential learning approach for teaching of environmental education. This was done by exploring the perceptions of pre-service teachers about use of experiential learning approach for teaching of environmental education.
Focus group interview’s data was analyzed using thematic analysis. After the transcription of the oral data of focus group interview into written form, I started reading the interviews as many times by moving back and forward. While going through each interview, the researcher highlighted information for coding and summarized them into certain words, in order to use it for next phase. After that all the different codes were organized into themes and re looked into inter connections before finalizing the themes.
Results
Theme1: Assumptions about Experiential learning as pedagogy for Environmental Education
Sub Group1
Sub theme1: Promotes exploration of the environment
“As our environment is out of the classroom rather than inside the classroom, experiential learning makes a huge difference. When taught to the students, inside the classroom it becomes monotonous and the children fail to understand or their imagining doesn’t work. So yes, experiential learning is an appropriate teaching and learning process for EE.”
Sub theme2: Brings Conceptual Clarity of EE content
“Experiential learning is surely a best way to engage students by giving hands on experience, which is apt for understanding any concept in a much better way .We became more familiar with the concept of experiential learning while teaching E.V.S topics. All the bookish knowledge was explained with direct hands on experience.”
“I feel experiential learning is the best method to teach environmental education to students. In experiential learning students get hands-on experience on a particular topic so they understand the concepts in a much better way. Field visits are a part of experiential learning so we can take students on visits which will bring them closer to the environmental issues.”
Sub Group2
Sub theme1: Active Engagement of students in the subject
“Experiential learning is the best way to engage students and teach them a concept via it .I found it very interesting as there are many innovative techniques involved in it. The topics that are actually dry and boring become lively and interesting through this technique of teaching.”
“Through Experiential learning students are engaged in a constructive activity and thus they grasp the concept faster. Students get firsthand experience. It is one method where you can actually see the child take interest in what he is doing. I find it one of the best ways of teaching students EVS, as you don’t need to rote learn, you simply learn by doing.”
Sub Group3
Sub theme1: Promotes action with reflection
students come across creates an immense impact on their thinking and learning process. It not develops their thought process but also makes them aware about the problems that our mother earth is facing. Therefore in a way, experiential learning is very constructive and advantageous.”
Theme 2: Experiential learning approach and Professional Development Sub Group1
Sub theme1: Evolved as a better teacher
“The approach helped me think a little out of the box than the usual teaching and learning method. I could improve my lessons using this approach and make my lessons innovative and interesting. I also made me curious at each point of framing the lesson plan and think from students’ point of view.”
“Experiential approach has helped me to teach the students E. V.S topics in a more systematic manner by implementing the 5E’s step by step. This approach has made me more organized, manage time, think creatively so that I can engage the students and make them understand in an interesting way besides rote learning.”
Sub theme2: Instilled confidence
“I was able to make my lessons more confidently as I was prepared with each and every minute detail about the lesson.”
“Experiential learning has helped me to plan my lessons using the 5 E plan in which I plan out activities to engage my students and also try to come up with new and innovative ideas .this method of teaching gives me a feeling of satisfaction that yes I am doing something for my students i am using the right technique .it has helped me grow as I have not yet work anywhere in any institute so this method gives me confidence that yes I would be able to teach the students well as would make a difference in my students life.”
Sub theme3: Create engaging learning environments
“If in the schools teachers also introduce experiential learning before introducing may be environmental education then the active involvement, a variety of learning activities, and an element of choice tend to engender personal investment in learning among students.”
Sub Group2
Sub theme1: Ability of applying of experiential learning in other areas
“I have started using this experiential learning in all the subjects whom I am teaching: maths, science, physics, and chemistry. I have certainly developed this thing in my teaching style...I have inculcated this teaching.”
Sub theme2:Promote Ownership of the Learning Process
“During the visits we felt responsible to explore the various issues and concepts related to things around us.”
Sub Group3
Sub theme1: Developing Critical Thinking
“Through Experiential learning we got the opportunity to receive feedback on— analyzing and critically evaluating ideas, arguments, and points of view as well as and going to the depth of the content and arriving to certain conclusions.”
Sub theme2: Developed Information Processing Skills
“In order to make my lesson experiential I started doing research online as well as off line regarding the resources, activities so that I can make my teaching more joyful for students.”
“After site based learning of mangroves, we just needed to reflect on what we had observed there was no need of teaching as such.”
Theme3: Beliefs formed about experiential learning Sub Group1
Sub theme1: Experiential learning creates learning studio
“I will use the quote which says that "I read I forget, I discuss I remember, I do I inculcate" so experiential learning can be defined like. Lots of critical thinking and questioning make both the teachers and students independent learners. Their creativity is bloomed at an individual level as the work is distributed according to their interests.”
Sub theme2: Experiential learning is a philosophy of multidisciplinary learning
“Experiential learning is a philosophy which we have learnt it’s an idea which we can apply in other subjects also like: Sociology and many more.”
Sub Group2:
Sub theme1: Experiential learningpromotes inquisitiveness
“It has changed my belief that learning by doing is important and we actually got interested into it...we go and try to find out more about it. Created curiosity in us.”
Sub Group3
Sub theme1: Experiential learningpromotes Team work
“It is very informative method if applied in a right way. It brings in development of various skills in teacher as well as students. The children learn to work in teams hence team spirit and co-operation can be seen in them.”
Theme4: Changes after add on program Sub Group1
Sub theme1: Improved planning skill
“The approach helped me think a little out of the box than the usual teaching and learning method. I could improve my lessons using this approach and make my lessons innovative and interesting. I made me curious at each point of framing the lesson plan and think from students’ point of view. I could make my evs lessons more interactive and interesting.”
“My thinking of making my lesson plan has changed and now I am very excited to make my lesson plan more interesting and child enjoys it while learning.”
Sub Group 2
Sub theme1: Innovative ideas for students’ engagement
“Experiential approach has helped me to teach the students E. V.S topics in a more systematic manner by implementing the 5E’s step by step. This approach has made me more organised, manage time, think creatively so that I can engage the students and make them understand in an interesting way besides rote learning.”
“While preparing the lesson I have started concentrating more on activity and engaging part. I am making use of Audio-Visual aids and also including lots of games in my lessons. In future I will try to organise a field trip so that students get hands on experience about the nature and this will help them to understand the surrounding in a better manner.”
Sub Group3
Sub theme1: Active follower of environmental protection
Also at school level i would like students to indulge into gardening, cleaning the school surrounding and use eco-friendly products to ensure least wastage of paper or wood.”
Theme5: Experiential approach and aims and objectives of environmental education Sub Group1
Sub theme1: Awareness leading to skill development
“Experiential approach strives to increase awareness of environmental problems as well as to foster the skills and strategies for solving those problems.”
Sub Group2
Sub theme1: Application oriented
“Experiential approach is pillar of modern environmental education because environmental education subject which is not theoretical based it is an application based...subject.”
Sub Group3
Sub theme1: Complimentary to objectives of environmental education
“They are sync with each other...without experiencing the nature you cannot teach or learn about the environment so experiencing the nature. You are following the rules and regulations and the code of conduct of experiential learning...because if you are not in direct touch with nature you cannot understand the problems and all the existing things like bio diversity and like we learned about mangroves and unless we saw these mangroves we were not able to connect with it...so definitely experiential learning and EVS go hand in hand as far as aims and objectives are concerned.”
Theme6: Obstacles using the experiential learning approach Sub group: 1
Sub theme1:Time consuming nature of experiential learning
“The process is very lengthy hence time consuming. We cannot implement it in our every day teaching process.”
Sub theme2: Permission from authorities
“It also requires prior permission from various people if we have to plan a trip or an excursion, permission for playground for conducting EVS activities which sometimes might be difficult.”
Sub group: 2
Sub theme1: Difficulties in Classroom management
“The class sometimes goes out of control which delays a little bit of your planning.”
“I find it difficult to conduct experiential learning based activities in those classes where strength of students is high, it becomes unmanageable to handle class and conduct activity in smooth manner.”
Sub group: 3
Sub theme1: Cost constraints
“It cannot be practiced in day-to-day teaching process. It require special space or equipment requirements which maybe expensive.
Theme 7: Facilitation of Experiential learning
Sub theme1: Systematic planning
“It required too much of advance planning and lot of critical thinking from engaging the students to evaluating them at the end. Each stage was well planned so lesson could work in smooth manner.
Sub group: 3
Sub theme1: Use of technology
“As I have experienced that in experiential learning if I want to show videos the technology is required. With the help of technology I could engage students by showing interesting videos. So schools must have equipments installed in each class.”
Discussion
The responses of focus group interview highlighted an interesting trend that how pre-service teachers’ perceived the experiential learning as a pedagogy for teaching environmental education. It was very vivid that the pre-service teachers found experiential learning as a foundational component of environmental education and the pre-service teachers felt each of the experiential learning attributes are important to consider while planning for topics of environmental education. The Tbilisi Declaration endorses the following objectives:Awareness, KnowledgeAttitudes; Skills and Participation. The researcher was delighted to see that three objectives of environmental education happened to be aligned with objectives of experiential learning. The obstacles highlighted during focus group interview by the pre-service teachers were more on technical aspect of experiential learning. Experiential learning occurred when carefully chosen experiences were supported by technology, conducive, trustworthy environment where there was no power issue of teacher-student or researcher-participant was played.
Conclusion
Experiential learning based activities should focus upon empowering students both theoretically and practically to be successful in their teaching profession. In doing so, paradigm shift is required to pick up the pace of experiential learning and higher education institutes should be committed to high quality pedagogy with flexibility in timetables, curriculum and open spaces for learning to promote group work as well as interactive approaches.
References:
Cohen, L.,Manion, L., Morrison, K.(2007).Research methods in education (6thed.).London and New York: Routledge.
Dewey, J. (1938). Experience and Education. New York: Simon & Schuster.
Dewey, J. (1939). Experience and education. The Kappa Delta Pi Lecture Series. New York: ollier Books, A division of Macmillan Publishing Co.
Eroglu,B.(2009).Fen Bilgisi Öğretmen Adaylarının Küresel Isınma Hakkındaki Bilgi Düzeylerinin Belirlenmesi. Yüksek Lisans Tezi. Gazi Üniversitesi Eğitim Bilimleri Enstitüsü. Ankara.
Higgins, P., & Nicol, R., 2002. Outdoor education: Authentic learning in the context oflandscapes, Volume 2. Kisa: Kinda Education Center.
Manzanal,F., Rodrignez,R., Luis,B. ; Jose,C.(2007).Evaluation of environmental attitude: analysis and result of the scale applied to the university students. Journal of environmental education, Volume 91,pp. 288-1009.
Pace, P. (2010). Self-evaluation as a tool in developing environmental responsibility.Journal of Teacher Education for Sustainability, Volume 12(1), pp.5-26. Palmberg, I.E;Kuru, J. (2000).Outdoor activities as a basis for environmental responsibility. The Journal of Environmental Education, Volume 31(4), pp. 3-6.
Robottom, I. (1987). Towards enquiry-based professional development in environ-mentaleducation. In I. Robottom (Ed.), Environmental education: Practice and possibility (pp. 83-119). Victoria, Australia: Deakin University Press.
Tsaggaridou, N., 2008. Trainee primary teachers' beliefs and practices about physical educationduring student teaching. Physical Education and Sport Pedagogy, Volume 13(2), pp.131-152.
An Analysis of Variations in Manufacturing Sector of Jammu
and Kashmir: A Case Study of District Pulwama and Anantnag
Gulzar Ahmad Mir
Dr. Umesk K. Dubey
Abstract
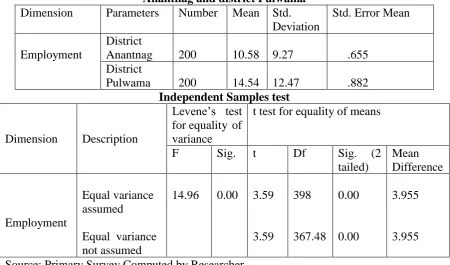
In Jammu and Kashmir heavy and large scale industries could not be tapped due to heavy financial involvement, political instability, geographical condition and day to day agitations in the J&K state especially in Kashmir valley.An attempt has been made to analyse the variations in manufacturing sector of Jammu and Kashmir interms of employment generation. It has been found from the study that the average employment in manufacturing sector in district Anantnag is 10.58 per unit and in district Pulwama the average employment in manufacturing sector is 14.54 per unit and the mean difference between the two districts is 3.95. The average employment generation by handicraft sector is significantly low (8.72 employees) where as it is significantly high (22.96 employees) in case of modern SSI units, There is no significant difference between handicraft and handloom sectors in terms of employment generation.
Key words: Handicraft, Handloom, Modern SSI, Manufacturing, Employment
Introduction
The manufacturing sector plays an important role in economic development and employmentgeneration in the country. The industrial sector is the major contributor to the Gross Net Product (GNP) after service sector. The industrial sector made a remarkable growth rate in couple of years in India due to the service and manufacturing sector.
In Jammu and Kashmir heavy and large scale industries could not be tapped due to heavy financial involvement, political instability, geographical condition and day to day agitations in the J&K state especially in Kashmir valley. That is why the state on the industrial front was lagging far behind than the other industrial developed states in India. The state is struggling hard to be on the path of industrialization. The industry sector has been declared as the main vehicle for accelerating economic activities providing employment to the educated unemployment youths. As per the census the total number of SSI units survived in J&K is 58596 out of the 44916 are working and 9557 are closed and 4123 are not traceable and the employment generation by these industries are 283105 during the year 2015-16.
The state has got the industrial potential in handloom and handicraft activities especially carpet, woolen shawls, paper machie, namda making, crewel, wood carving, pashmina, raffle, silk sareesand many other precious products.The handicraft activities carried out in Kashmir Valley are famous throughout the world because of their quality, art and design and the sector has great potential to earn foreign exchange earnings to generate gainful employment within and outside the state. It is a labourintensive sector, needs less capital
Research Scholar, Department of Post Graduate Studies and Research in Economics, Rani Durgavati Vishwavidylaya
Jabalpur (M.P.) - India
and is eco-friendly.The Handicraft sector in J&K occupies an important place with its traditional craftsman, employing 4-5 lakh artisans, 179 major craft clusters and generation revenue near about 1000 crore plus. The handloom industry is exceptional in terms of design, total cost and superiority of products and thus provides an economical advantage on the other national and international competitors in handicrafts market.
Objectives
➢ To study the variations in manufacturing sector between district pulwama and Anantnag.
➢ To study the variations in manufacturing sector between different activities
Hypothesis
❖ There is significant difference in manufacturing sector between sample districts in terms of employment generation.
❖ Employment generation in modern SSI units is significantly high as compared to handicraft and handloom.
Research Methodology
The present study is based on primary data, collected through interview schedule fromthe two districts of Kashmir which are dominated so for SSI units are concerned viz. Anantnag and Pulwama districts. Keeping in view the total no of small scale industries between the sub-sectors of manufacturing sector, a sample of 400 small scale manufacturing units in both districts which became 200 sample units from district anantnag and 200 sample units from district Pulwama were selected through simple random sampling technique.
Statistical Analysis
Collected information was analyzed with the help of SPSS programming and Excel. Statistical package for social science (SPSS) adaptation 23.0 for windows 8.1 was used for data examination and hypothesis testing. The statistical techniques used in this study are t-test and Analysis of variance (ANOVA).
t – Statistic
t- test is often called Student's T test in the name of its founder "Student". T test is used to compare two different set of values. It is generally performed on a small set of data. T test is generally applied to normal distribution which has a small set of values. This test compares the mean of two samples. T test uses means and standard deviations of two samples to make a comparison.
The formula for T test can be expressed as: 𝑥1 − 𝑥2
√𝑠12 + 𝑠 22 𝑛1 𝑛2
Where
𝒙𝟏=Mean of first set of values 𝒙𝟐= Mean of second set of values
𝒔𝟏= Standard deviation of first set of values 𝒔𝟐=Standard deviation of second set of values 𝒏𝟏 =Total number of values in first set
𝒏𝟐 = Total number of values in second set
Analysis of variance (ANOVA)
each dimension. It is expressed in the following form.
SSw = Σd21 + Σd22 + Σd23 + =Σd24 ………..=Σd2n
Where d = deviation of every raw score of a category from its sample mean
SSb= S[(X - Xt)2xn] Where,
X = any sample mean X t = total mean n = number of scores
SSb = sum of squares between groups SSt = total sum of square of variations. SSt = SSb+ SSw
Alternatively,
SSt = S (X – Xt)2
X = a raw score in any sample Xt = the total mean
SSt = the total sum of squares
Data Analysis
H1There is significant difference in manufacturing sector between sample districts in
terms of employment generation.
Table 1.1 Comparison of employment in manufacturing sector between District Anantnag and district Pulwama
Dimension Parameters Number Mean Std.
Deviation
Std. Error Mean
Employment
District
Anantnag 200 10.58 9.27 .655
District
Pulwama 200 14.54 12.47 .882
Independent Samples test
Dimension Description
Levene’s test for equality of variance
t test for equality of means
F Sig. t Df Sig. (2
tailed)
Mean Difference
Employment
Equal variance assumed
Equal variance not assumed
14.96 0.00 3.59
3.59
398
367.48 0.00
0.00
3.955
3.955
Source: Primary Survey,Computed by Researcher.
found from the t-test that the mean difference between the two groups is significant at 5 percent level. Thereby, accept our alternative hypothesis that there is significant difference in manufacturing sector between sample districts in terms of employment generation.
Table1.2 Comparison of employment between different activities of manufacturing sector
H2Employment generation in modern SSI units is significantly high as compared to
handicraft and handloom.
ANOVA
Activity Sum of
squares
Df Mean Square F p-value
Between Groups 2812.31 2 1406.16
11.92 .000
Within Groups 46822.12 397 117.94
total 49634.44 399
Duncan
Activity N
Subset for alpha = 0.05
1 2
Handicraft 134 9.63
Handloom 134
Modern SSI 132 16.04
Sig. .732 1.000
Source: Primary Survey, Computed by Researcher. Means for groups in homogenous subsets are displayed
Conclusion
In Jammu and Kashmir heavy and large scale industries could not be tapped due to heavy financial involvement, political instability, geographical condition and day to day agitations in the J&K state especially in Kashmir valley. The state has got the industrial potential in handloom and handicraft activities especially carpet, woolen shawls, paper machie, namda making, crewel, wood carving, pashmina, raffle, silk sarees and many other precious products. There are wide variations in employment generation in terms of employment generation between different districts as well as different activities of manufacturing sector. It has been found from the study that the average employment in manufacturing sector in district Anantnag is 10.58 per unit and in district Pulwama the average employment in manufacturing sector is 14.54 per unit and the mean difference between the two districts is 3.95. The average employment generation by handicraft sector is significantly low (8.72 employees) where as it is significantly high (22.96 employees) in case of modern SSI units, There is no significant difference between handicraft and handloom sectors in terms of employment generation.
References
1) Darakhshan. A. (2011). An Analysis of Khadi and Village Industry Sector in J&k, Zenith International Journal of Multidisciplinary Research,1(8), 213-220
2) Fiyaz.A., and yasmin. e. (2012).impact of turmoil on the handicraft sector of Jammu and Kashmir, An economic analysis. International NGO journal, 7,(5), 78-83.
3) EffatY.,andBhat F. A. (2012).An Evaluation of Handicraft Sector of J&K – A Case Study of District Budgam. European Academic Research Journal, I (4), 367-381.
4) Dar. M. A., and Parrey. A. H. (2013). Socio-Economic Potential of Handicraft Industry in Jammu and Kashmir: Opportunities and Challenges.Abhinav International Monthly Refereed Journal of Research in Management & Technology,(II), 20-28.
5) Fiyaz. A.,andNengroo. (2013). an analysis of handloom sector of Jammu and Kashmir: A case study of district Budgam. International national Journal of management and business studies, 3 (1), 1.
6) Jadhav.(2014). Indian Handicrafts: Growing or Depleting. IOSR Journal of Business and Management, 7-13
7) Sheikh. A. S. and Tiwari. S. (2014). Skill Development and Vocational Training in the Handicraft Sector in Jammu and Kashmir: Special Reference to District Anantanag. Annual Research Journal of Symbiosis Centre for Management Studies, Pune, 2 (1), pp. 138–155
8) Din. T. M. (2015). AN economic analysis of Jammu and Kashmir export and marketing. British Journal of Marketing Studies.3 (1), 53-57.
9) Shah.M. R. (2016). An Assessment of Handicraft Sector of J&K with Reference to Central Kashmir. Arabian Journal of Business and Management Review, 6, (5), 1,6
10)Mehendra et.al. (2008). Economics of handloom weaving: A case study of Andhra Pradesh. EPW. (21), 43-51.
11)Galab. s,andrevalthi.e. (2009). Understanding Powerloom Weavers’ Suicides in Sircilla. Economic & Political Weekly, xliv, ( 8), 12-15
Role and Importance of Agricultural Sub-Sectors for Primary
Sector of Jammu and Kashmir Economy: An Empirical
Evidence
Muddasir Ali Mir
Dr. Samta Jain
Abstract
The aim of the research paper is to analyze the changes in volume in terms of Average and Compound growth rates of output in the agriculture sector of the state economy. It is apparent from the results of this research paperthat growth rate of agriculture sector output is positively related to the growth rate of primary sector output and the explanatory variable is statistically highly significant. From the regression model analysis which we have employed in this research paper it becomes clear that in one percent growth rate of primary sector , agriculture sector output growth rate contributes on average 0.78 percent which in other words refers 2/3 rd growth rate in the primary sector output is due to agriculture sector growth rate of output . This shows the potency of agriculture sector with respect of output growth for primary sector in the basket of four sub-sectors of primary sector. In our model agriculture sector output growth rate is strongly positively correlated
with primary sector output as R2 = 76.7%.
Keywords: agriculture sector, primary sector, NSDP, growth rate output, annual and compound growth rates, regression model.
I.1: Introduction
The agriculture sector is an important sector of Jammu & Kashmir State’s economy. It plays an imperative role from various points of view like, share in GSDP, employment and foreign exchange earning etc. During the year 2015-16, the share of agriculture including forestry and fishing to GSDP at current prices was 19.52 %, out of which crops contributed 13.96 %, live stock contributed 3.74 %, forestry and logging 1.46 % and fishing and aquaculture was 0.38 %. During the year 2015-16, the share of agriculture including forestry and fishing to NSDP at current prices was 20.22 %, out of which crops contributed 13.87 %, live stock contributed 4.29 %, forestry and logging 1.69 % and fishing and aquaculture was 0.38 %. The development in agriculture sector is essential because it is an important sector of the economy, which provides the basic ingredients to its population. It is an experiential fact that increased agriculture output and productivity have a propensity to contribute significantly to an overall economic development of Jammu & Kashmir State. Therefore, development and sustainable development in agriculture sector is necessary because it is an important and larger sector of the economy.
In terms of significance agriculture has been the most significant sector for the economy of Jammu & Kashmir State since 1947. It is still the foundation of the economy as it provides directly employment to about 42% of the population and also provides inputs for agro-based industry. Agriculture income has also created demand for industrial goods. Not only
Ph.D Research scholar (Economics) RDVV Jabalpur, Madhya Pradesh, India
that it also contributes raw materials for manufacturing goods and provides market for manufactured products. Not only does the agriculture sector provide food to consumers and fibers to domestic industries, it also is a basis of meager foreign exchange earnings and offers a market for industrial goods.
Agricultural growth or productivity is one of the most important determinants of economic growth and poverty reduction. An increase in agricultural growth provides direct impact on rural incomes, raising rural incomes and welfare. This rise in rural income raises the overall demand for goods and services in the economy. Growth in crops also provides food security to the economy, allowing it to concentrate on the growth of other sectors. Not only that agricultural growth provides boost to exports which helps stabilize the Exchange rate of the country.
I.2: Objectives
❖ To analyze the changes in volume in terms of Average and Compound growth rates of output in the Agriculture sector of the state economy.
Hypothesis
❖ There is no satisfactorily growth rate in the agricultural sector output during the entire reference period of our study.
I.3: Data and Methodology
The study is primarily based on the secondary data that is obtained from the following sources: -
❖ Govt. of India, Economic census, various issues.
❖ Govt. of J&K, Digest of statistics; Directorate of Economics and Statistics; various issues.
❖ Govt. of J&K, Economic Survey (various issues), Directorate of Economics and Statistics.
❖ Govt. of J&K, Economic Review of J&K (2007-08), Directorate of Economics and Statistics.
❖ Reports, journals, magazines and news papers.
Statistical and Econometrical Tools
The following appropriate statistical and econometrical tools and formulas have been used to analyze the data:
Statistical dispersion
Dispersion refers to the idea that there is a second number which tells us how "spread out" all the measurements are from that central number.
a. The standard deviation. The standard deviation is the "average" degree to which scores deviate from the mean. More precisely, you measure how far all your measurements are from the mean, square each one, and add them all up. The result is called the variance. Take the square root of the variance, and you have the standard deviation. Like the mean, it is the "expected value" of how far the scores deviate from the mean. Here is what the formula looks like:
2) Linking Factor Method: It is a method through which base year is changed or rebase is formed .It is simply done by using the following two formulas:
Whereas; Factor = (Old Base) ÷ (New Base)
b) Inflator = (Factor) × (Out-put level of the corresponding year) Whereas; Factor = (New Base) ÷ (Old Base)
3) Annual Growth Rate or Simple Growth Rate: The annual growth rates for a series of T annual observations, say 𝑦1,𝑦2,𝑦3,… . 𝑦𝑡 is defined as:
𝒂𝒕 = 𝒚𝒕_ 𝒚𝒕−𝟏
𝒚𝒕−𝟏
Whereas; 𝑦𝑡refers current year out-put 𝑦𝑡−1 Refers previous year out-put
4)Compound Growth Rate: the compound growth rate (cgr) has been calculated with the help of exponential function which is as:
Exponential function y = abx
The compound growth rate = Antilog (b-1)* 100
5) The Regression Models for Agricultural Sector performance Y= a + b1X+u1
Where dependent variable Y= Primary Sector Output (in Rs. Crores at constant prices) and explanatory variable is X
X = Agricultural Sector Out-put (in Rs. Crores at constant prices)
u1 = error term assumed to follow normal distribution with zero mean and constant
variance.
6) The Regression Model for Agricultural Sector performance Y= a + b1X+u1
Where dependent variable Y= State Economy Output (in Rs. Crores at constant prices) and explanatory variable is X
X = Agricultural Sector Out-put (in Rs. Crores at constant prices)
u1 = error term assumed to follow normal distribution with zero mean and constant
variance.
II: VOLUME OF KEY SECTORS OF STATE ECONOMY OUTPUT
The agricultural sectoral growth of output is the most critical indicator to quantify the rate of performance of agricultural sector of the state economy. The Role and Importance of Agricultural Sub-Sector for Primary Sector of Jammu And Kashmir Economy: An Empirical Evidence is detailed explained given:
II.1: Average Growth Rate Performance of Key Sectors of the State Economy Output
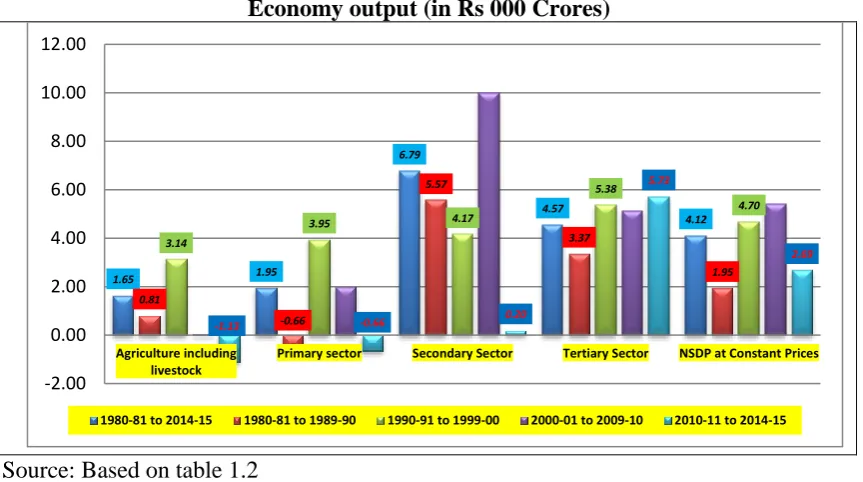
agriculture sector which increased the production level of the agriculture sector of the J&K state economy due to extra care towards agriculture sector. Similarly, the secondary sector also observed about 8 percent growth rate during the second and third decade due to the construction boom in the urban areas in particular and state economy in general. Although the growth rate in the tertiary sector was observed about 5 percent seems second largest after secondary sector, but in reality it is the construction sub-sector of secondary sector which is responsible for sustaining the about 4 percent growth rate of the state economy due to its largest size in terms of composition about 45 percent. Therefore, its one percent growth rate is more than 2 times increase in absolute output of secondary sector. The following schedule and diagram makes it clear:
Table 1.1: Decadal Average Growth Rate Performance of Macro Sectors of the State Economy output (in Rs 000 Crores)
Time period Agriculture including livestock Primar y sector Seconda ry sector Tertiar y sector
NSDP at
Constant Prices 1980-81 to
2014-15 1.54 1.61 6.50 4.71 3.82
1980-81 to
1989-90 1.81 0.57 5.48 3.90 2.44
1989-90 to
1999-2000 3.56 3.50 7.60 4.89 4.64
2000-01 to
2009-10 0.39 1.65 8.85 5.71 5.12
2010-11 to
2014-15 -0.97 -0.565 0.91 3.77 1.93
SOURCES: A) Compiled from Digest of Statistics, Directorate of Economics and Statistics, J&K Government, various issues.
B) Compiled from State Domestic Product, Directorate of Economics and Statistics, J&K Government, (1980-81 to 2010-11to2014-2015).
Figure 1.1:Decadal Average Growth Rate Performance of Macro Sectors of the State Economy output (in Rs 000 Crores)
Source: Based on table 1.1
1.54 1.61 6.50 4.71 3.82 1.81 0.57 5.48 3.90 2.44 3.56 3.50 7.60 4.89 4.64 0.39 1.65 8.85 5.71 5.12 -0.97 -0.56 0.91 3.77 1.93 -2.00 0.00 2.00 4.00 6.00 8.00 10.00 Agriculture including livestock
Primary sector Secondary Sector Tertiary Sector NSDP at Constant Prices