I J E N S 2018 IJENS June IJENS © -IJMME -7272 -3 0 1804
Numerical Investigation of New Cooling Method for
Clinker Flow in Parallel with Air flow at
Different Height Ratios
Nasr A. Jabbar
1, M.J. ALshukri
1, Wakkas Ali Rasheed
1, Ihsan Y. Hussain
21Department of Mechanical Engineering, Faculty of Engineering, University of Kufa, Najaf, Iraq 2Department of Mechanical Engineering, College of Engineering, University of Baghdad, Baghdad, Iraq
Abstract--
The properties of Portland cement depend on several parameters, and the cooling method is one of these parameters. When the effectiveness of cooling method increases, the properties of Portland cement are enhanced. In the present work, a new cooling method is suggested and numerical analysis is made by CFD modeling using (FLUENT 6.3.26). Using the same dimensions of cooling room in grate cooler, constant mass flow rate of air and clinker, different porosity of clinker, and different height ratios ( height of air / height of clinker), the numerical results were calculated. The results show that the height ratio is an important factor affecting the new cooling method and can be used in order to decrease the length of cooling room or the time of cooling process according to the porosity of clinker. The maximum temperature of clinker with the lowest possible porosity is much lower than the maximum temperature of clinker with maximum porosity at a constant height ratio (H.R.). Also, when the height ratio (H.R.) increases, the temperature of clinker decreases at any point, also the rate of change between clinker and air temperature decreases with increasing the height ratio (H.R.).
Index Term--
Clinker; Cooling Process; Forced Convection; Porosity; CFD.
1. INTRODUCTION
The production of Portland cement consists of three fundamental stages [1,2]: (a) Preparation of the raw mixture, (b) Production of the clinker, (c) Preparation of the cement. The requirements of each stage are generally constant in spite of the changes in properties of raw materials and operation conditions. The production of the clinker is the most important stage because there are several variables affecting on it. Portland cement clinker is a hydraulic material composed primary of calcium silicates, aluminates, and ferrites and it remains the essential component of all standardized cements. A clinker or clinker nodules are homogeneous material produced from a finely ground, homogenized blend of limestone, shale and iron ore. The properties of clinker nodules (the phase composition of the clinker and the morphology of the individual clinker phases) have a decisive influence on the cement quality. These parameters are controlled by the composition of the raw material (first stage), and also by the combustion and cooling conditions during the clinker burning process (second stage) [1,3]. One of the most important parameters affecting in clinker production is the rate of cooling [4]. Several studies were made to investigate the effect of cooling rate on the composition and crystal structures (crystallization of alite and belite) of clinker [5-9].
Generally, there are four types of clinker cooler (Rotary cooler, satellite cooler, shaft cooler and grate cooler). The grate cooler is the most important type because of its thermal efficiency compares with other types of coolers [10]. Several
researchers studied the heat and mass transfer in the grate cooler in order to control on clinker cooling process.
Touil [11] used finite element to simulate clinker cooling process in grate cooler. Mujumdar [12] carried on overall heat balance calculation of double-input and multiple-output to analyze heat transfer in the grate cooler. Locher [13] conducted a control model using the heat transfer analysis of gas through the particle bed. He investigated the influence of grate speed and particle size distribution on clinker cooling process. Li [14] studied a chemical reaction of calcining process of limestone and modeled the heat-mass transfer coupling in this process. He found that solid particle size, inlet flow velocity, and inlet gas temperature were important parameters to the system characteristics. Zhang [15] simulated using Fluent software and he found the optimal gas flow and heat transfer in sinter circular cooler. In recent years, the seepage heat transfer theory used in order to study and control the clinker cooling as porous media at high temperature [16,17].
1.1. NEW SUGGESTED COOLING METHOD
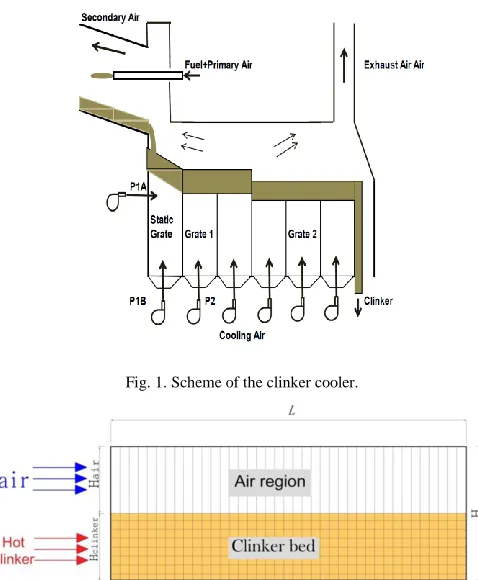
The grate cooler consists of number of cooling rooms depending on the size of grate cooler. These rooms arrange as series and clinker enters each room (see Fig.(1)). The fresh air (or cold air) generally enters from the bottom of the room and the hot air sometimes flow parallel to the clinker (cold zone) and another flow counter to the clinker (warm zone). These cooling conditions produce sometimes warm clinker due to change in mass flow rate of clinker and air, properties of raw materials and working conditions, therefore; the clinker properties will be bad relatively. In present work, the new method suggests using the same rooms separately and controlling on the mass flow rate of air of each room depending on mass flow rate of clinker, input and output temperature of clinker and the porosity of clinker.
The new suggested cooling method, used in present work, assumed that:
1. The dimensions of the clinker cooling room are equal to the dimensions of one stage in grate cooler (i.e. height of room is 0.6 m and width of room is 1.8 m). 2. The mass flow rate of air and clinker is constant and
equal to 30 kg/sec [10].
3. The flow of air and clinker are parallel (see Fig.(1)). 4. The clinker is assumed as a porous media with
I J E N S 2018 IJENS June IJENS © -IJMME -7272 -3 0 1804
Fig. 1. Scheme of the clinker cooler.
Fig. 2. The Geometry and Conditions of the Cooling Room
In this method, the height ratio (H.R.), which defined as the ratio between the height of air to the height of clinker (Hair/Hclinker), is changed as (1, 1.5, 2, 2.5 and 3) in order to
study the effect of air height on the required length of cooler when the clinker height decreases.
2. MATHEMATICAL METHODOLOGY
“A mathematical model is identified which is appropriate for the description of steady, two-dimensional, convection in a fluid-saturated porous medium. For theoretical studies of convective heat transfer in fluid-saturated porous material, the following assumptions are often made and used:
The natural convection and the radiation heat transfer are neglected.
The medium is assumed to have constant, isotropic, and homogenous characteristics and properties (permeability, porosity).
It is allowed that the temperature of solid and fluid phases be different.[18]
The steady-state fully developed forced convection is desired.
The porosity of the medium is considered to be uniform and constant.
Local thermal equilibrium (LTE) is valid. Viscous dissipation are negligible [19].”
2.1. GOVERNING EQUATIONS
In convection heat transfer, the convection process is governed by the basic conservation principles of mass, momentum and energy; therefore to determine the flow and
temperature fields, they are in vector form [20]; a schematic of the physical model and coordinate system is shown in Fig.(3).
Continuity Equation;
Momentum equations;
Energy Equation;
The energy equation describing temperature distribution of the flow inside the gate is given by
For the solid and air temperature inside the porous medium two energy equations;
𝑘 − ϵ Equation [21];
The 𝑘 − 𝜖 turbulence model equation is written as:
In these equations, (k) is the turbulent kinetic energy (μt) is the turbulent viscosity (S) is the modulus of the mean rate-of-strain tensor (𝑝𝑘) represents the generation of turbulence
kinetic energy due to the mean velocity gradients. (𝑝𝑏) is the
generation of turbulence kinetic energy due to buoyancy.
Fig. 3. Schematic of The Physical Model and Coordinate System
3. NUMERICAL MODEL
I J E N S 2018 IJENS June IJENS © -IJMME -7272 -3 0 1804
The mean cell count deviation (skewnees) for the current model was 0%. Quadrilateral cells = 10800, and Face count= 21840, The user defined function was used to specify properties of fluid and porous media ( clinker) (See Table(1)).
Table I
The Properties of Air and Clinker Used in This Work [10]
Property Clinker Air
Density(kg/m3) 1350 342.1*t-1.0002
Viscosity(kg/m.sec) --- 342.1t0.6769 *109 Heat Capacity
(J/kg.K)
0.632+4.62*10-4 t-0.37*10-7 t2
0.97+1.37*t*10-4-4t2
Thermal Conductivity (W/m.K)
0.2 1*t1.6771*10-9
4. VALIDATION OF NUMERICAL MODEL
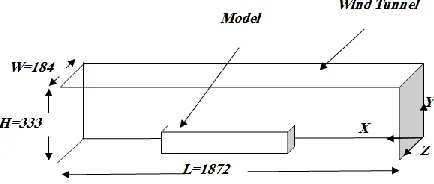
To belay of the results acquired from the present study, a comparison was made with the results checked by prior studies, which insure validity the program, the practical part of the research [21] was simulated, The experimental investigation of this research covered a set of experiments executed to study the forced convection heat transfer from a heated flat plate embedded in porous media with a constant heat flux. The inquiry covered values of heat flux of (1000, 2000, 3000, 4000 and 5000 W/m²) and different velocities values of (V=1.868, 3.451, 5.73 and 6.367 m/s).
The geometry of the design model consists of two regions of interest. These are: the flow duct with dimensions (L=1872 mm x W=184 mm x H=333 mm). The smaller box with dimensions (L=270mm x W=130mm x H=70mm), this box: on base consist of heated Aluminum plate with dimensions L=250mm x W=90mm and filled with porous media (glass beads with diameter 12mm), as shown in figure (4). A comparison between the experimental and theoretical results has been made for one case, so figures (5a,b,c and d) show the numerical and experimental results for temperature profile that compared with each other. This figure is plotted for temperatures with q"=5000W/m2 and all velocities above for
x-direction in the box. Figures present that the numerical simulation follows the same trend as the results of experimental work, with 5.6% variation.
Fig. 4. Model Geometry (all Dimensions in mm)
(a) V= (20%, 2.15 m/s)
(b) V=(40%, 3.451m/s)
(c) V= (70%, 5.73 m/s)
(d) V= (100%, 6.367 m/s)
I J E N S
2018 IJENS June
IJENS © -IJMME -7272 -3 0 1804
5. RESULTS AND DISCUSSIONS
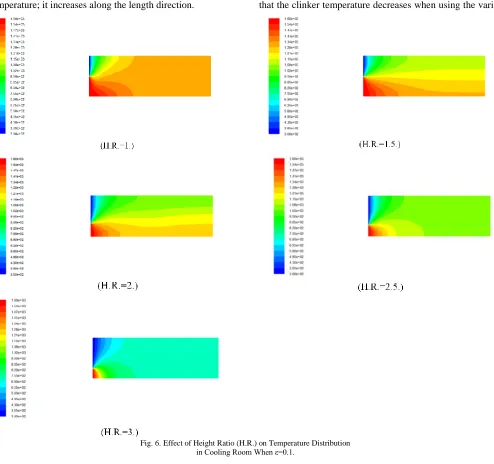
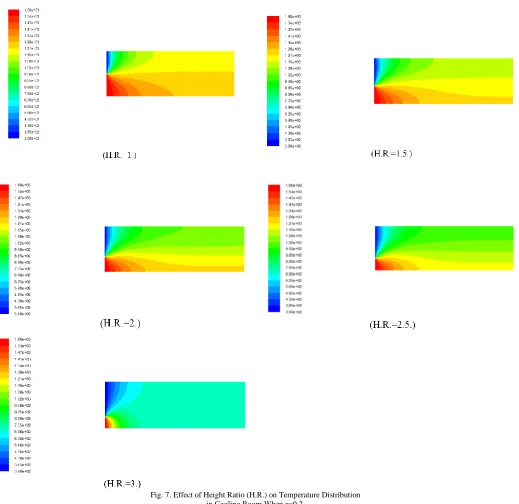
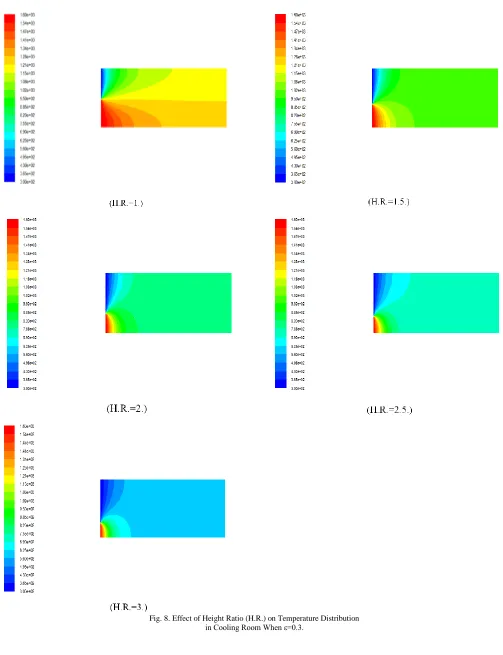
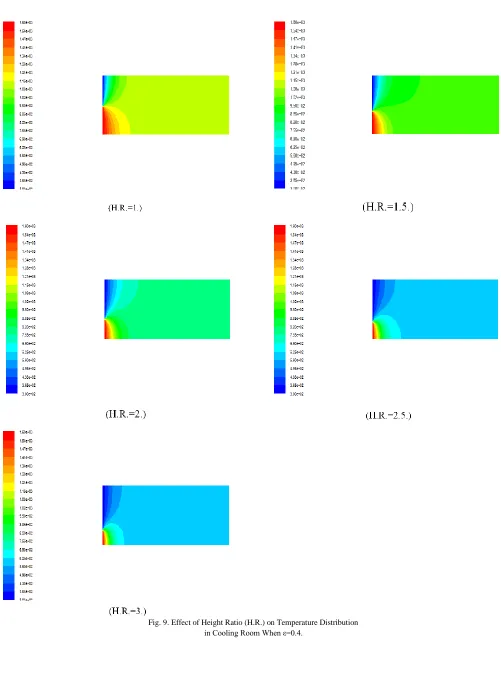
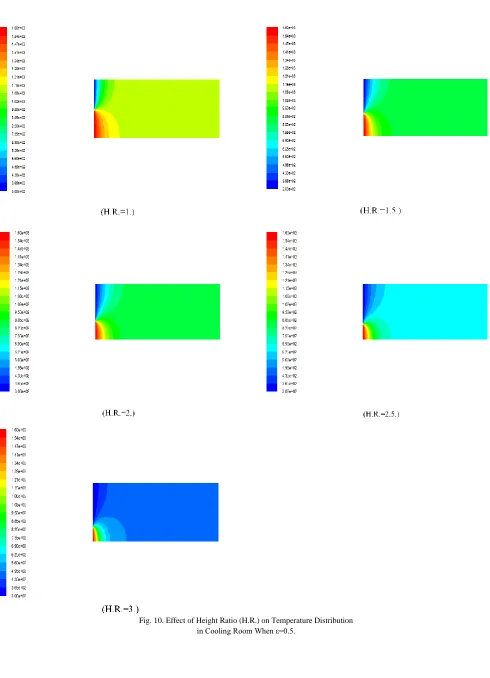
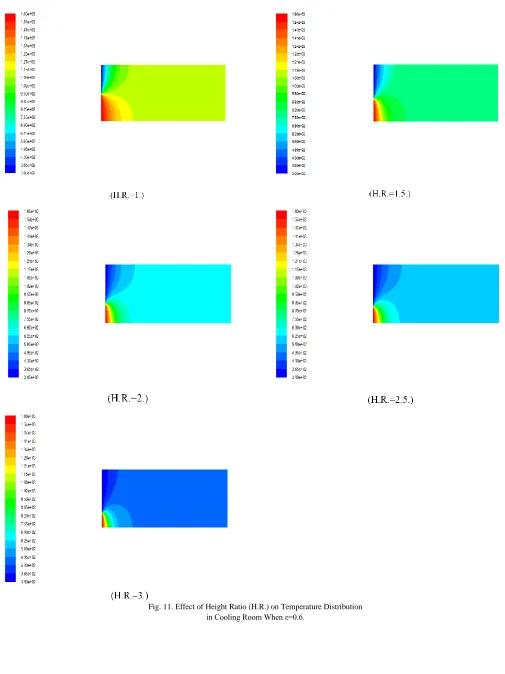
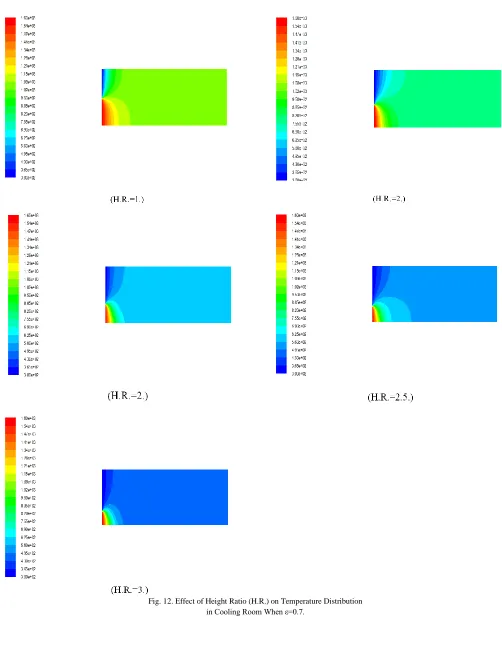
Figure (6) shows temperature distribution in cooling room (air and clinker) at different height ratios (H.R.) when the porosity of the clinker is (0.1). The temperature along the length of cooling room for the solid phase (clinker) decreases in the incident direction, however, for the fluid phase (air) temperature; it increases along the length direction.
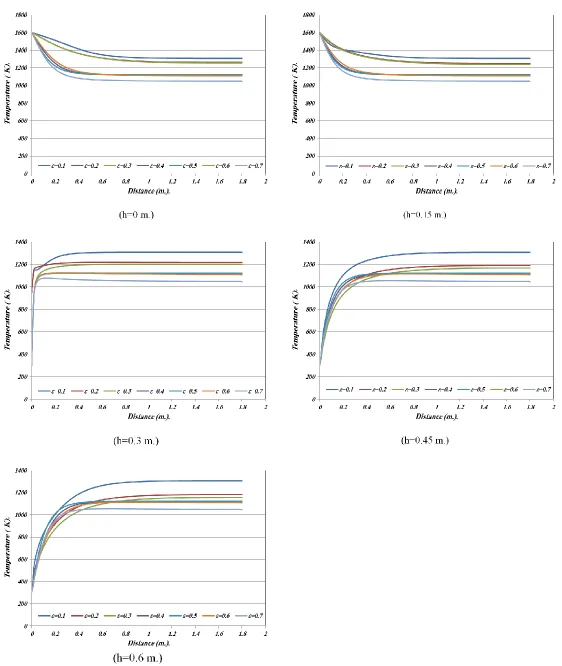
The response of the temperature to varying values of the clinker porosity from 0.1 to 0.7 is illustrated in Figures (6) to (12), and to represent the situation clearly, the temperature lines for temperature at limited heights and at length of gate is taken in figures (13) to (17), where the increasing porosity leads to corresponding decrease in damping properties (the rate of damping for fluid comes by three components which are viscous, orifice and friction components) in the flow and leads to decrease in resistance flow, and on the other side the
temperature of air decreases with an increase in porosity. It is clear that when the average temperature decreases, it means that the heat transfer rate increases. Because at low porosities one observes that the resistance of the convective flow becomes weaker because of an increase in the flow resistance from the less permeable outer sub-layers. Also It can be seen that the clinker temperature decreases when using the variable
porosity material along the length direction.
Also, when the height ratio (H.R.) increases, the temperature of clinker decreases at any point, because more heat is removed from the clinker. In the other hand, the rate of change between clinker and air temperature decreases with increasing the height ratio (H.R.). Consequently, the maximum temperature inside the clinker region decreases. Same behavior is also seen in Figures (7) to (12). This fact can be
I J E N S
2018 IJENS June
IJENS © -IJMME -7272 -3 0 1804
seen in Figures (13) to (17) when the height ratio (H.R.) changes from 1 to 3.
The results also show that at a constant height ratio (H.R.), the maximum temperature of clinker with the lowest possible porosity is much lower than the maximum temperature of clinker with maximum porosity. It is the main reason for
prevention of air flow through the void space of porous media. In Fig (18), the comparison among temperatures variation at the end of cooling room due to change in height Ratio (H.R.) at different height (h) and different porosity (ε) is shown. It is found that the convection heat transfer increases more slightly
at different height due to change in clinker porosity, which is due to the high temperature gradient of the solid phase with changing porosity effect.
This can be attributed to permeability of the porous region that acts quite similar to a solid obstacle in low permeability vice versa. The curves in figure (18) show that the maximum
temperature of clinker is inversely proportional with the height Ratio (H.R), however a higher height Ratio (H.R) is the best solution due to cooling rate enhancement which are required as well as that the speed of cooling Clinker is an important advantage [3, 23] .
I J E N S
2018 IJENS June
IJENS © -IJMME -7272 -3 0 1804
I J E N S
2018 IJENS June
IJENS © -IJMME -7272 -3 0 1804
I J E N S
2018 IJENS June
IJENS © -IJMME -7272 -3 0 1804
I J E N S
2018 IJENS June
IJENS © -IJMME -7272 -3 0 1804
I J E N S
2018 IJENS June
IJENS © -IJMME -7272 -3 0 1804
I J E N S
2018 IJENS June
IJENS © -IJMME -7272 -3 0 1804
I J E N S
2018 IJENS June
IJENS © -IJMME -7272 -3 0 1804
I J E N S
2018 IJENS June
IJENS © -IJMME -7272 -3 0 1804
I J E N S
2018 IJENS June
IJENS © -IJMME -7272 -3 0 1804
I J E N S
2018 IJENS June
IJENS © -IJMME -7272 -3 0 1804
I J E N S
2018 IJENS June
IJENS © -IJMME -7272 -3 0 1804
I J E N S 2018 IJENS June IJENS © -IJMME -7272 -3 0 1804
6. CONCLUSIONS
The following conclusions may be drawn from this study: 1. The temperature along the lengthof cooling room for
the clinker is decrease in the incident direction, while for the air temperature; it increases along the length direction.
2. When the height ratio (H.R.) increases, the temperature of clinker decreases at any point, also the rate of change between clinker and air temperature decreases with increasing the height ratio (H.R.). 3. With an increase in porosity, the temperature of air
decreases and the clinker temperature decreases when using the variable porosity material along the length direction.
4. At a constant height ratio (H.R.), the maximum temperature of clinker with the lowest possible 5. porosity is much lower than the maximum
temperature of clinker with maximum porosity. 6. The convection heat transfer increases more slightly
at different height due to change in clinker porosity, which is due to the high temperature gradient of the solid phase with changing porosity effect.
The maximum temperature of clinker is inversely proportional with the height Ratio (H.R), however a higher height Ratio (H.R) is the best solution due to cooling rate enhancement.
7. REFERENCES
[1] Mohamed, A. A., Hesham, G. and Ibrahim (2010) 'Variation of feed chemical Composition and Its Effect on Clinker Formation– Simulation Process', proceedings of the world Congress on Engineering and Computer Science, vol. II, October, pp. 20-22. [2] Johansen, V.C., Hills, L.M., Miller, F.M. and Stevenson, R.W.
(2002) 'The importance of cement raw mix homogeneity' International Cement, Chicago, USA, online on America's Cement, Available:
http://cementamericas.com/mag/cement_importance_cement_raw/
[3] ROBERT, A. B. ( 2015) 'Effect of cooling rates on mineralization in portland cement clinker', University of Missouri-Kansas, Kansas City, Missouri.
[4] Ono, Y. (1981) 'Microscopical Observations of Clinker for the Estimation of Burning Condition, Grindability, and Hydraulic Activity', Proceedings of the Third International Conference on
Cement Microscopy, International Cement Microscopy
Association, Houston, Texas, pp. 198-210.
[5] Ward, G.W. (1941) 'Effect of heat treatment and cooling rate on the microscopic structure of portland cement clinker', Journal of Research of the National Bureau of Standards, vol. 26, pp. 49-64. [6] Maki, I. & Goto, K. (1982) 'Factors influencing the phase
constitution of alite in portland cement clinker', Cement and Concrete Research, vol. 12, pp. 301- 308.
[7] Lea, F.M. (1972) The chemistry of cement and concrete, Chemical Publishing Inc., New York, 1092 p.
[8] Maki, I. (1994) 'Processing conditions of portland cement clinker as viewed from the fine textures of the constituent minerals', Ceramic Transactions, vol. 40, pp. 3-17.
[9] Campbell, D. H. (1999) Microscopical examination and interpretation of portland cement and clinker, Portland Cement Association, Skokie, IL, 201 p.
[10] Zaid, M. H. (2002) 'Thermal Analysis of the Grate Clinker Cooler' ,M.Sc. Thesis, University of Kufa,.
[11] Touil, D. H., Belabed, F. C., and Frances, S.B. (2005) 'Heat exchange modeling of a grate clinker cooler and entropy production analysis', Heat and Technology Journal , vol. 23, p.p 61-68.
[12] Mujumdar, K. S., Ganesh, K. V., Kulkarni, S. B., Ranade, V. V., (2007) 'Rotary cement kiln simulator (RoCKS): Integrated modeling of pre-heater, calciner, kiln and clinker cooler', Chemical Engineering Science Journal, vol. 62 (9), pp. 2590-2607. [13] Locher, G. (2002) 'Mathematical models for the cement clinker
burning process, Part 4. Grate cooler', ZKG-international Journal , vol. 22 (6), p.p 46-57.
[14] Li, M. C., Tian, Y. W. and Di, Y. C. (2006) 'Coupled processes of chemical reaction, heat and mass transfer in non-thermal equilibrium porous medium', CIESC Journal, vol. 57, p.p 1080-1083.
[15] Zhang, X. H., Zhang, J. Y., Dai C. D and Xie, D. J.( 2011) 'Optimization and simulation of sinter cooling process', CIESC Journal, vol. 62 (11),p.p 3081-3087.
[16] Zheng, K. C., Wen, Z., Liu, X. L., Lou, G. F., Zhang, X., Zhang, Y. G. and Wu, W. F. (2010) 'Investigating the general mathematics model of gas-solid heat transfer in the cooling process of high temperature clinker and sintered material', Energy for Metallurgical Industry Journal , vol. 29, p.p 27-30.
[17] Wen, Y. N. & Liu, Li, B. (2011) 'Investigation on the heat transfer model of the cement clinker', Bulletin of the Chinese Ceramic Society, vol. 30, p.p 1381-1385.
[18] Maziar D., Mohammad S. V., and Seyfolah S. (2014) 'Perturbation analysis of the local thermal non-equilibrium condition in a fluid-saturated porous medium bounded by an iso-thermal channel', Transport in Porous Media, vol. 102, p.p 139–152.
[19] Maziar D., Mohammad S. V., and Seyfolah S. (2015), 'Temperature-dependent conductivity in forced convection of heat exchangers filled with porous media', A perturbation solution, Energy Conversion and Management, vol. 91, p.p 259–266. [20] Ljung, A-L., Lundström, T.S., and Tano, K. (2008) 'Fluid flow and
heat transfer within and around a porous iron ore pellet placed in infinite space', the 19th International Symposium on Transport Phenomena, Reykjavik, iceland.
[21] Aya, A. Y. & Ihsan, Y. h. (2013) 'Experimental and numerical investigation of forced convection in a porous medium subjected to constant heat flux', MSc, University of Baghdad, College of Engr.Mech.Engr.Dept.
[22] SITI, R. B. A. (2015) '3 dimensional simulation on drying of clay and alumina layers using computational fluid dynamics (cfd)', MSc, Faculty of Mechanical and Manufacturing Engineering, Universiti Tun Hussein Onn Malaysia.