PERFORMANCE ANALYSIS ON AOMDV,
OLSR &DSR
Amrita Chauhan1 and Surender Punia2
I. INTRODUCTION
AOMDV is stand for ad hoc on demand distance vector [1, 2] is a distance vector routing protocols that operates reactively to reduce overhead finding routes only on demand. when a route does not exist to a given destination, a route request (RREQ)message is flooded by the source and by the intermediate nodes if they have no previous routes in their tables .upon receiving a a RREQ message ,the receiving node will record the route information in its own routing table . once the RREQ message reaches the destination or an intermediate node , the node responds by a route reply (RREP)message . back to neighbor from which it first received the RREQ message . As the RREP message is for warded back along the reverse path, nodes along this path set up forwarding entries in their routing tables, pointing to the node from which they received RREP message .AOMDV uses sequence numbers created by the destination for every route entry to avoid routing loops. Routes with the greatest sequence number are preferred in selecting routes from the source to the destination.It is a reactive routing protocol, meaning that it establishes a route to a destination only on demand. In contrast, the most common routing protocols of the Internet are proactive, meaning they find routing paths independently of the usage of the paths. AOMDV is, as the name indicates, a distance-vector routing protocol. AOMDV avoids the counting-to-infinity problem of other distance-vector protocols by using sequence numbers on route updates, a technique pioneered by OLSR. AOMDV is capable of both unicast and multicast routing. Advantage of AOMDV is that it establish on demand. Destination sequences are used to find the latest path to destination. The connection setup delay
1Department Of Computer Science and Engineering, Om Institute of technology and management, Chandigarh road, Hisar, Haryana, India 2Department Of Computer Science and Engineering, Om Institute of technology and management, Chandigarh road, Hisar, Haryana, India
DOI: http://dx.doi.org/10.21172/1.74.012 e-ISSN:2278-621X
Abstract - Aims of these technologies to provide high data rates, quality of services, long range and low deployment costs to a wireless access technology on a metropolitan scale. It is tremendous to these days, there are several ways by which a Wireless Internet Service Provider can deliver broadband service. This is as an analytical comparison on wireless technology and architecture of AOMDV, OLSR&DSR. This paper explores standards and technology of AOMDV, OLSR and DSR network protocols. With the help of Simulation experiments the performance of the AOMDV, OLSR and DSR networks are analyzed. The experiments are performed using simulator NS2. With the Simulation of various network setups as per requirement and performance of the both networks by selecting parameters such as throughput, collisions, end to end delay and packet delivery ratio are analyzed.
is less and Disadvantage of this protocol is that the intermediate node can lead to inconsistent route, Beacon-base, Heavy control overhead.
Ad hoc On Multipath Demand Distance Vector Routing (AOMDV) AOMDV [11] is a variation of Destination-Sequenced Distance-Vector (OLSR) routing protocol which is collectively based on OLSR and DSR. It aims to minimize the requirement of system-wide broadcasts to its extreme. It does not maintain routes from every node to every other node in the network rather they are discovered as and when needed & are maintained only as long as they are required. The key steps of algorithm used by AOMDV for establishment of uncast routes are explained below.
OLSR:-
The OLSR (destination –sequenced distance vector) protocol[13] uses the bellman-ford algorithm to calculate paths. the cost metric used is the hop count ,which is the number of hops it takes for packet to reach its destination. OLSR is a table driven proactive protocol, thus it maintains a routing table with entries for all the nodes in the network and not just the neighbors of a node.The OLSR [8] is proactive table driven routing protocol is based on Bellman- Ford routing algorithm. Each node in the network maintains routing table which contains all available destinations with associated next hop towards destination, metric and destination sequence number. Sequence number presents improvement of OLSR routing protocol compared to distance vector routing, and it is used to distinguish stale routes from fresh ones and avoid formation of route loops. [10]The first is known as a “full dump.” This type of message carries all available routing information and can require multiple Network Protocol Data Units (NPDUs). During periods of occasional movement, these messages are transmitted infrequently. Smaller “incremental” messages are broadcast to provide only that information which has changed since the last full dump. Each of these messages should fit into a standard size NPDU, thereby decreasing the amount of traffic generated. The mobile nodes maintain an additional table where they store the data sent in the incremental routing information messages .
Dynamic Source Routing:-
The DSR[9] is a simple and efficient protocol for routing in mobile ad hoc and wireless networks. DSR is suitable for routing in multi-hop networks. A mobile ad hoc network is completely self-organizing by using the DSR protocol. All nodes cooperate to forward packets of its neighbors which are not in direct communication range of the destination node(s). DSR is an on-demand or reactive protocol. For example, when any node wants a route, DSR initiates a route discovery process. In other words, due to the reactive nature of the protocol, when there is a need for a route, it starts discovering them.
II. RESULT ANALYSIS
In this chapter we will describe about the design and evaluation simulation experiments. The whole presented designs are developed by the help of NS2 network simulator. The evaluation was carried out by developing several experiments that illustrate the performance of the both technologies. The simulation parameters like number of nodes, terrain range, mobility etc. are use in NS2 for development and evaluation. Various parameters are analyzed for the evaluation of the network.In this section we also analyze the performance of these technologies DSR, OLSR and AOMDV network by changing the input parameter node mobility. Then we will analyze the effect of changing mobility on the performance of both these technologies.
The three metrics that are used in the evaluation of this are the packet delivery ratio number of collisions in a network and average end-to-end delay.
Experimental Parameters
Setup:-Below the table present all the network parameter which is used for simulation experiments.
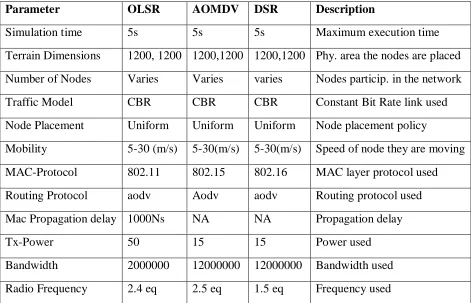
Table 1 Simulation Parameters
Parameter OLSR AOMDV DSR Description
Simulation time 5s 5s 5s Maximum execution time
Terrain Dimensions 1200, 1200 1200,1200 1200,1200 Phy. area the nodes are placed
Number of Nodes Varies Varies varies Nodes particip. in the network
Traffic Model CBR CBR CBR Constant Bit Rate link used
Node Placement Uniform Uniform Uniform Node placement policy
Mobility 5-30 (m/s) 5-30(m/s) 5-30(m/s) Speed of node they are moving
MAC-Protocol 802.11 802.15 802.16 MAC layer protocol used
Routing Protocol aodv Aodv aodv Routing protocol used
Mac Propagation delay 1000Ns NA NA Propagation delay
Tx-Power 50 15 15 Power used
Bandwidth 2000000 12000000 12000000 Bandwidth used
Radio Frequency 2.4 eq 2.5 eq 1.5 eq Frequency used
“.nam” is used to check the various parameters to analyze the performance of network. In NS2 the three types of file are created by default. These are “.nam”,“.trace” and “.tcl”
Simulation:-
We have collected the latest study material from the various sources for the comparison of the DSR, OLSR and the AOMDV technologies .As there is no protocol model for any version of 802.16 for NS2, the simulation configuration uses the PHY-layer of 802.11. The 802.16 features implemented for this was inserted at the MAC-layer of the NS2 simulator. At the top layer there is a constant bit generator which can send packets addressed to application layers of other nodes. These packets are sent with a known size, interval and duration through the protocol stacks. On the basis of this study and the experimentation of various parameters of the technologies on the NS2 simulator we differentiate between these two technologies.
Performance Analysis Metrics:-The following performance metrics are chosen to evaluate the performance of these technologies DSR, OLSR and the AOMDV.
Packet Delivery Ratio (PDR):-This is the ratio between the number of packets that are received and the number of packets sent. This metric only considers backward path traffic, i.e., the data packets from the gateways to the mesh nodes. PDR is most important metric that we should consider in packet forwarding. We can say this is the best parameter to evaluate the performance of a network. It may affects by different criteria such as packet size, group size, action range and mobility of nodes. PDR performance with respect to mobility is plotted in figure below. From the results, it is clear that as mobility increases the packet delivery ratio decreases in case of DSR, OLSR and also less packets are delivered than the AOMDV .
Table: Packet Delivery Ratio
P D R Total Packet sent Received by AOMDV Received by OLSR
Received by
DSR
0-5 1000 3962 3198 3016
5-10 1000 3962 1958 1803
10-15 1000 3962 1770 1601
15-20 3963 3962 1429 1117
20-25 3963 3962 1356 906
Figure: Packet Delivery Ratio
Analysis the Results of
PDR:-In this section we will analyze the performance of both the Technologies OLSR and AOMDV network by changing the parameter node mobility. Then we will analyze the effect of Changing Mobility on the performance of both these technologies.The three metrics that are used in the evaluation of this are the packet delivery ratio, number of collisions in a network and average end-to-end delay.
Average End to End Delay:-
The delay is the total latency experienced by a packet to traverse the network from the source to the destination. At the network layer the end-to-end packet latency is the sum of processing delay, packetization, transmission delay, queuing delay, and propagation delay. The end-to-end delay of a path is the summation of the node delay at each node plus the link delay at each link on the path. . In wireless link, the propagation delays are very small and almost equal for each hop on the path. The queuing delay and MAC delay are considered as two main factors that accumulated the node’s delay. The Fig. below shows measure of end-to-end delay for the OLSR and the AOMDV technology at different node mobility. The end-to-end delay increases as the node speed increases. Higher mobility causes more links broken and frequent re-routing and thus causes larger end-to-end delay. The end-to-end delay in OLSR is more the end-to-end delay in AOMDV.
Table: Average End to End delay
Mobility AOMDV OLSR
DSR
10-15 0.005326 0.019536 0.020013
15-20 0.005326 0.018203 0.019771
20-25 0.005328 0.018149 0.018001
25-30 0.005329 0.017933 0.170121
Figure: Average End o End Delay
Figure: Average End o End Delay
Analysis the Results of Average End to End
Delay:-In this section we will analyze the performance of both the Technologies OLSR and AOMDV network by changing the parameter node mobility. Then we will analyze the effect of Changing Mobility on the performance of both these technologies.
Collisions:-When two or more nodes want to transmit data packets without sensing or listening the transmission channel and if there is already congestion on the channel then a collision state occurs. In collision either the contents of the data packets are modified or the contents are completely lost and the data packet is of no use for the destination. So the source has to transmit those data packets again to the destination. So this metric is used to measure that how many collisions occurs during the transmission. This metric is available in the “.trace” file of NS2.
Collision Ratio:-
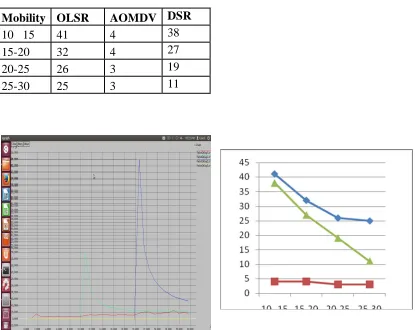
In networks, packet collision occurs when two or more packets from different source nodes arrive at the same destination node simultaneously. The simulation measures the number of total packets (total_pkt) arriving at a specific node and calculates how many packets encounter collision (collided_pkt); the packet collision ratio is the ratio of collided_pkt to total_pkt. The metric packet loss rate measures the percentage of packets discarded at an end-node, due to either collision or corruption. It is defined as the ratio of (collided_pkt +corrupted_pkt) to total_pkt. Fig. Shows the packet loss rates under various Mobility schemes. It is clear from the graph that the more collisions occur in case of DSR, OLSR as compare to the AOMDV. The table shows both side collision ratio sender and receiver.
Table: Collision ratio
Mobility OLSR AOMDV DSR
10 15 41 4 38
15-20 32 4 27
20-25 26 3 19
25-30 25 3 11
Analysis the Results of
Collision:-In this section we will analyze the performance of both the Technologies DSR, OLSR and AOMDV network by changing the parameter node mobility. Then we will analyze the effect of Changing Mobility on the performance of both these technologies.
The three metrics that are used in the evaluation of this are the packet delivery ratio, number of collisions in a network and average end-to-end delay
.
III. CONCLUSIONS
The performances of among the services have analyzed on their standards AOMDV, DSR and OLSR are provides better services performance are optimal in case of high mobility. It can also transfer data at a very high speed without end to end delay and collisions compare to AOMDV, OLSR and DSR services. The AOMDV protocol will perform better in the networks with static traffic with the number of source and destination pairs is relatively small for each host. It uses fewer resources than OLSR, because the control messages size is kept small requiring less bandwidth for maintaining the routes and the route table is kept small reducing the computational power. The AOMDV protocol can be used in resource critical environments. The OLSR protocol is more efficient in networks with high density and highly sporadic traffic. But the best situation is when the between a large number of hosts.
REFERENCES
[1] Singh, K.; Verma, A.K. “Experimental analysis of AODV, DSDV and OLSR routing protocol for flying adhoc networks (FANETs)”Proc. in IEEE International Conference on Electrical, Computer and Communication Technologies (ICECCT), PP. 1-4, ISBN: 978-1-4799-6084-2 DOI: 10.1109/ICECCT.2015.7226085.
[2] Gupta, M.; Kumar, S. “Performance Evaluation of DSR, AODV and DSDV Routing Protocol for Wireless Adhoc Network” Proc. in IEEE InternationalConference on Computational Intelligence & Communication Technology (CICT), ISBN: 978-1-4799-6022-4 PP 416-421, DOI: 10.1109/CICT.2015.95.
[3] Chandrakar, R ; Kushwaha, A.; Choubey, N. “Evaluation of routing protocols AODV, DSR and DSDV to enhance video transmission over Mobile Ad hoc Networks” Proc in International Conference on Signal Processing And Communication Engineering Systems (SPACES), PP 67-71, DOI: 10.1109/SPACES.2015. 7058217.
[4] Pandey, K.; Raina, S.K.; Rao, R.S. “Performance analysis of routing protocols for vehicular adhoc networks using NS2/SUMO” Proc in IEEE International Conference onAdvance Computing(IACC), ISBN: 978-1-4799-8046-8 PP 844-848, DOI: 10.1109/IADCC. 2015. 7154825.
[5] Kaul, V.; Bharadi, V.A.; Choudhari, P.; Shah, D.; Narayankhedkar, S.K.. “Security Enhancement for Data Transmission in 3G/4G Networks”. Proc. in International Conference on Computing Communication Control and Automation (ICCUBEA), PP 95-102, DOI: 10.1109/ICCUBEA. (2015)
[6] Mehta, M.; Akhtar, N.; Karandikar, A.“Impact of HandOver parameters on mobility performance in LTE HetNets”. Twenty First National Conference on Communications (NCC),PP 1-6, DOI: 10.1109/NCC.2015.7084910(2015)
[7] Soni, H.; Khunteta, A. “Performance analysis of routing protocols in Bluetooth networks”, Proc in IEEE Conference on Recent Advances and Innovations in Engineering (ICRAIE), ISBN: 978-4799-4047 PP 1-9, DOI: 10.1109/ICRAIE.2014.6909231
[8] Arathy, O.; Mathew, B. “Mobility based comparison of routing protocols in Mobile Ad-hoc Networks”, Proc in Annual International Conference on Emerging Research Areas: Magnetics, Machines and Drives (AICERA/iCMMD), ISBN: 978-1-4799-5201-4 PP 1-5, DOI: 10.1109/AICERA.2014.6908197
[10] El Khediri, S.; Nasri, N.; Benfradj, A.; Kachouri, A.; Wei, A. “Routing protocols in MANET: Performance comparison of AODV, DSR and DSDV protocols using NS2” Proc in International Symposium on Networks, Computers and Communications,PP 1-4, DOI: 10.1109/SNCC.2014. 6866519
[11] Panda, B.K.; Swain, J.; Mishra, D.P.; Sahu, B. “Analysis of effect of mobility and transmission power on AODV and DSR in mobile Adhoc network” Proc in Eleventh International Conference on Wireless and Optical Communications Networks (WOCN), ISBN: 978-1-4799-3155-2 PP 1-7, DOI: 10.1109/WOCN.2014.6923073
[12] Khanam, F.; Mitra, S.R.; Rahman, M.A.; Hossain, M.S. “Design and performance analysis of ultra wideband Double Inverted-FL micro strip antenna for Wi-Fi, WLAN, WiMAX and UMTS applications”Proc. in International Conference on Electrical Information and Communication Technology (EICT), PP 1-6,
DOI:10.1109/EICT. 6777838 (2014).