Abstract—An accurate estimation of sediment discharge in rivers and streams should be solved for the appropriate river management and monitoring. In this study, a new formula which has minimum parameters considering existing ones with a concept of entropy by a probabilistic approach, was developed and mean suspended sediment concentration were estimated. Results of this new formula were verified with the experimental results which were conducted with a steady state and gradually injecting sediment (D= 105 ㎛) in a rectangular cross-sectional flume previously. The relationship between the measured sediment distribution and the estimated sediment distribution has a good agreement.
Index Terms—Entropy, entropy suspended sediment parameter, mean suspended sediment concentration, Probabilistic approach.
I. INTRODUCTION
The accurate estimation of sediment discharge is important for not only traditional river design and maintenance but also water environment and ecosystem management in rivers such as tracking a pollution source and conservation of organism habitats. Therefore, it is important to calculate a river bed change such as scour, deposition according to sediment transport in the river bed. Accordingly, it is necessary to calculate an exact mean sediment concentration and distribution. The measurement of suspended sediment concentration used for the estimation of total load is conducted through mean measurement in the water depth direction at an arbitrary cross-section in a river. A concentration measurement on suspended sediment generally used in the estimation of total load is conducted through mean measurement in the water depth direction at an arbitrary cross-section in a river. This method is a generally used method to calculate a suspended sediment concentration directly. However, when flood or unsteady flow occurs, irregular flow can be formed. Thus, the reliability of suspended sediment data calculated using the above method is not that high. Researchers in the past have proposed a mathematical model based on probability to calculate a mean sediment concentration according to theoretical or empirical
Manuscript received March 13, 2017; revised May 25, 2017.
Hyeon Cheol Yoon is with the National Disaster Management Research Institute, Jongga-ro, Jung-gu, Ulsan, 44538, South Korea.
Sam Hee Lee is with the Hydro Science and Engineering Research Institute, Korea Institute of Civil Engineering and Building Technology, Goyang-si, 411-712, South Korea.
Sung Won Park is with Seoul National University, Korea (e-mail: [email protected]).
formulas. In Korea, previously developed formulas have been utilized rather than developing new formula of sediment calculation [1]. In other nations, [2] developed a formula of distribution of suspended sediments concentration and [3] proposed the effect of sediments on velocity distribution. Furthermore, [4] proposed a distribution formula of suspended sediments concentration by modifying the Rouse formula utilizing the entropy concept. Reference [5] proposed a distribution formula of suspended sediments concentration utilizing the Tsallis entropy concept but no significant error was found at a relatively low concentration distribution but a large range of error was found at high concentration distribution.
In the present study, a distribution formula of sediment concentration that overcame the limitations of existing formulas has been proposed. The proposed formula can be universally applicable using simple parameters by means of the fully developed entropy maximization concept. Thus, the calculation method of a mean velocity or mean sediment concentration proposed in this study is advantageous in terms of time and cost in the stream and water resource fields compared to existing methods.
II. THEORETICAL BACKGROUND
One of the widely known distribution formulas of suspended sediments concentration is Rouse concentration distribution formula [6] as below:
(1) where
c
refers to a concentration,c
a refers to a distance,a
y
refers to a sediment concentration,
Z
refers to* s
/
u
ω
,
s refers to a particle sedimentation velocity,
refers to a coefficient,
refers to von Karman constant,*
u
refers to shear velocity, and
D
refers to a water depth. However, the above equation employs a logarithmic distribution formula as a velocity distribution formula and it has a limitation that it is divergent at the bottom surface [7], [8]. Although it cannot produce a significant error since a velocity is close to 0 at the bottom in the velocity distribution calculation, a velocity for sediment concentration is the largest at the bottom, which can cause a large amount of error. This has been known to affect the calculation of a mean sediment concentration [9], [10]. Therefore, [9] proposed the following (2) by taking entropy 2-D velocity distribution formula into consideration.Derivation of Equation for Mean Suspended Sediment
Based on Probabilistic Concept
(2)
where
C
0 refers to a sediment concentration at the bottom,M
refers to a dimensionless parameter, andy
refers to a height whereC
can occur. Thus,
' can be defined into (3). (3)In order to calculate shear stress easier, (4) is proposed as below: (4)
Chiu proposed a sediment concentration distribution formula using the above (4). The formula can be good at specific cross-sections but it is limited in terms of general purpose use as well as too many parameters are needed. Therefore, the present study proposed a formula that can calculate a mean sediment concentration by simplifying parameters as much as possible. The detailed elicitation process in the calculation formula of velocity distribution and mean velocity, which are required to understand the calculation formula of mean sediment concentration using the probabilistic entropy concept, are found in the previous studies done by Chiu and Choo so they were omitted in this paper [4], [6], [11]-[14]. The basic concept of the formula calculated in the present study started from the calculation method of velocity distribution formula using existing entropy maximization concept. The constraints for the formula are as follows [15]. (5)
(6)
(7)
(8)
where
C
w refers to a sediment concentration at the water surface,C
refers to a mean sediment concentration,)
ξ
/ξ
ξ
(ξ
0 max
0 refers to a cumulative probabilistic coordinate of cross section, andb
1
b
2C
refers to a Lagrange function. In order to calculate a mean sediment concentration formula, (8) is plugged into (5), (6), and (7) and arranged to produce (9) and (10). (9)(10)
where
k
C
0/
C
w andU
refer to a mean velocity,(N)
refers to a coefficient representing a sediment equilibrium state,N
C
0b
2 refers to a sediment entropy parameter,M
refers to a velocity entropy parameter,(M)
refers to a coefficient representing velocity equilibrium state,A
refers to a cross-section, andQ
s refers to a sediment. Reference [15] attempted to estimate a parameter in (9) through the method of least squares. However, since three cases of parameter can occur, its accuracy is low and sediment diameter cannot be taken into consideration, which is a limitation. In order to calculate the sediment equilibrium state, it is necessary to calculate ak
value that represents a ratio of sediment concentration between bottom and water surface. To achieve this, the following (11) about the approach to the water surface was proposed to calculate a sediment equilibrium parameter
(N)
. (11)(12)
(13)
(14) Here, when
ξ
is approached to the water surface, a limiting value of function(ξ
ξ
0/ξ
max
ξ
0)
shall satisfyws
ξ
as physical meaning of approaching to the water surface. In the present study, the calculation of
s used aformula proposed by [16] which had a diameter range of 100 ㎛ to 1,000 ㎛. The advantage of the proposed formula needs only one parameter
N
to establish the formula, which is different from existing formulas that needed two to three or more parameters. Thus, the proposed formula is simpler and more accurate to derive the processing value. In particular, the formula proposed by Chiu calculates a value of parameter'
by utilizing a regression equation but there was a(N)
of cross-section is calculated thereby obtaining the maximum sediment concentration
C
0 and mean sedimentconcentration
C
. A calculation method of discharge entropy parameter M was proposed by [6]. Finally, sediment distribution can be estimated by using (14).III. MEASURED DATA
The measurement data of suspended sediments performed by [3] were used to verify the formula proposed in this study. The experiment channel was a rectangular shape whose width was 356 mm and length was 15 m. A slope of the channel can be adjusted and the measurement data were measured by maintaining a uniform flow. To measure a velocity, a 10 mm-diameter pitot tube was used and a 3.2 mm diameter pitot tube was used to measure a pressure. At the same time, a pressure measured via a pitot tube was verified utilizing a manometer. For sediments, sands were used and sediment concentration data utilized in this study were measured by increasing supply 105 ㎛ diameter sand from 0 up to 0.91 kg according to the experiment condition. A flow rate was constant at 0.064 ㎥/s and a water depth was 160 mm, and a standard deviation was maintained at 1.69 mm. The energy gradient was 0.0022 and more details are shown in [3]. Run 1 was excluded because it did not include sediment.
IV. RESULT ANALYSIS AND DISCUSSION
Using (11) proposed in Chapter 2,
C
w was eliminatedand
k
was calculated to obtain entropy parameterN
. Based on them,
(N)
that represents a sediment equilibrium state was calculated.The above approach is a method that was utilized in velocity calculation through the velocity entropy maximization concept by [6], which was also applied to the sediment concentration equivalently.
The velocity entropy parameters and equilibrium state
(M)
were calculated as shown in Fig. 1.Fig. 1. Relationship between the measured mean velocity and the estimated maximum velocity.
result was applied to any case, which was verified in a number of previous study results [17]. The reason for some values that were present horizontally was due to experiment performing with the same cross-sections maintaining the same flow rate as mentioned in the experimental data.
The relationship between maximum and mean sediment concentrations is shown in Fig. 2 using (11) in the same method.
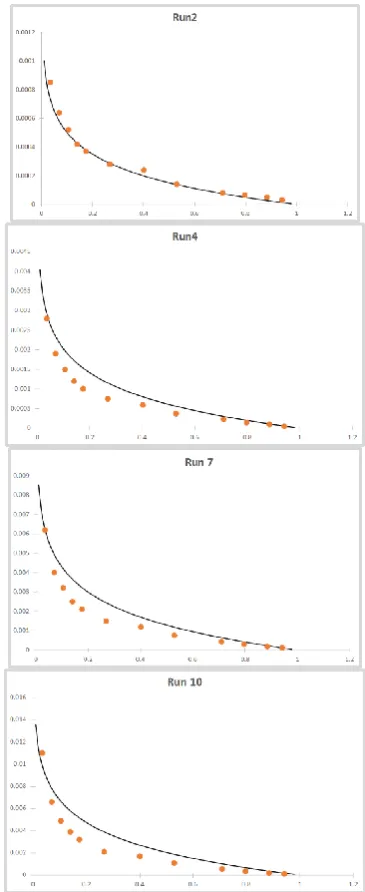
Fig. 3. suspended sediment concentration profile for each cases using the proposed method.
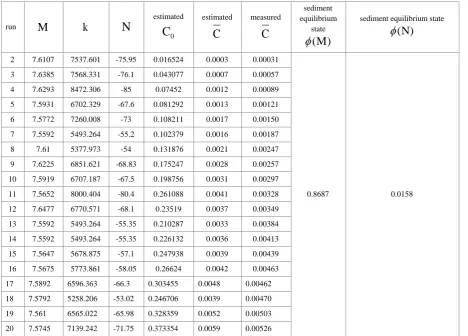
TABLEI:PARAMETER ESTIMATION USING THE PROPOSED METHOD
run
M
k
N
estimated
0
C
estimated
C
measured
C
sediment equilibrium
state
(M)
sediment equilibrium state
(N)
2 7.6107 7537.601 -75.95 0.016524 0.0003 0.00031
0.8687 0.0158 3 7.6385 7568.331 -76.1 0.043077 0.0007 0.00057
4 7.6293 8472.306 -85 0.07452 0.0012 0.00089
5 7.5931 6702.329 -67.6 0.081292 0.0013 0.00121
6 7.5772 7260.008 -73 0.108211 0.0017 0.00150
7 7.5592 5493.264 -55.2 0.102379 0.0016 0.00187
8 7.61 5377.973 -54 0.131876 0.0021 0.00247
9 7.6225 6851.621 -68.83 0.175247 0.0028 0.00257
10 7.5919 6707.187 -67.5 0.198756 0.0031 0.00297
11 7.5652 8000.404 -80.4 0.261088 0.0041 0.00328
12 7.6477 6770.571 -68.1 0.23519 0.0037 0.00349
13 7.5592 5493.264 -55.35 0.210287 0.0033 0.00384
14 7.5592 5493.264 -55.35 0.226132 0.0036 0.00413
15 7.5647 5678.875 -57.1 0.247938 0.0039 0.00439
16 7.5675 5773.861 -58.05 0.26624 0.0042 0.00463
17 7.5892 6596.363 -66.3 0.303455 0.0048 0.00462
18 7.5792 5258.206 -53.02 0.246706 0.0039 0.00470
19 7.561 6565.022 -65.98 0.328359 0.0052 0.00503
20 7.5745 7139.242 -71.75 0.373354 0.0059 0.00526
As shown in Fig. 2, a lower linearity of sediment concentration than that of velocity was revealed through the comparison of sediment concentrations but the coefficient of determination revealed a high correlation above 0.94, which indicated an appropriate calculation result.
M
andN
in the equilibrium state can be obtained using the graphs in Fig. 1 and 2. A sediment concentration distribution was calculated using the calculated equilibrium stateN
by (14). The accuracy of the measured sediment concentration distribution and calculated sediment distribution is shown in Fig. 3.Fig. 3 shows 1:1 comparison graphs between the measured sediment concentration distribution in the laboratory and the calculated sediment concentration distribution through the proposed method in this study.
The parameters calculated in this study are summarized in Table I. The outcome of negative calculation results of sediment parameter value among the parameters was reasonable according to the reverse distribution type of
velocity and sediment as shown in Fig. 4 because the same probability density function about distribution of velocity and sediment was used while the sediment concentration value was calculated as a positive value.
Fig. 4. Vertical distributions of stream-wise flow velocity and sediment concentration.
concentration, red-color point refers to a measured value, and the black-colored solid line refers to results calculated using the formula.
V. CONCLUSION
In this study, a calculation equation of suspended sediments developed based on the entropy concept according to probabilistic method was derived, which was summarized as follows:
1) A mean suspended sediment calculation formula and sediment distribution equation were proposed as a probabilistic approach using the entropy concept. 2) During the velocity calculation utilizing the entropy
concept, the linearity between the maximum and mean velocities was verified in previous papers. In addition, it was also verified that a mean sediment concentration
C
and maximum sediment concentrationC
0 had also thesimilar linearity. This information can show the applicability to real time concentration calculation in the future.
3)
(N)
that represents a sediment equilibrium state was verified as a dominant parameter in calculation of mean sediment concentration and the maximum sediment concentrationC
0 can be calculated. Thus, the proposedformula can be applicable to the development of formulas to calculate abed load in the future. It is also found that it is necessary to develop a formula that calculates a sediment concentration distribution from the sediment equilibrium state.
4) Suspended sediment distribution was estimated and it shows a good agreement compared with measured suspended sediment distribution data.
5) However, a sand diameter used to verify the parameter calculation formula of sediment entropy was 105 ㎛, which indicated that more various sediment diameters shall be verified in the future study. Furthermore, it is also necessary to verify various types of cross-sections in addition to a rectangular cross-sectional channel.
ACKNOWLEDGMENT
“This research was supported by Basic Science Research Program through the National Research Foundation of Korea(NRF) funded by the Ministry of Science, ICT & Future Planning (NRF-2015R1C1A1A02037026)”
REFERENCES
[1] J. M. Ahn et al., “A study on the optimal sediment discharge formula for Hyeongsan river,” Journal of Korea Water Resources Association, vol. 43, no. 11, pp. 977-984, 2010.
velocity distribution,” Water Resources Research, vol. 22, no. 10, pp. 1377-1384, 1986.
[4] C. L. Chiu “Entropy and 2-D velocity distribution in open channels,”
Journal of Hydraulic Engineering, ASCE, vol. 114, no. 7, pp. 738-756,
1988.
[5] C. Huijuan and V. P. Singh, “Suspended sediment concentration in open channels using Tsallis entropy,” Journal of Hydrologic
Engineering, vol. 19, no. 5, pp. 966-977, 2014.
[6] T. H. Choo et al., “An estimation of discharge using mean velocity derived through Chiu's velocity equation,” Environmental Earth Science, vol. 69, pp. 247-256, 2013.
[7] T. Kármán, “Mechanische ӓhnlichkeit und turbulenz (mechanical similitude and turbulence),” in Proc. the 3rd International Congress
for Applied Mechanics, Stockholm, vol. 1, pp. 85-93, 1930.
[8] L. Prandtl, “The mechanics of viscous fluids,” Aerodynamic Theory, Springer-Verlag, Berlin, p. 142, 1935.
[9] C. L. Chiu et al., “Mathematical models of distribution of sediment concentration,” Journal of Hydraulic Engineering, vol. 126, no. 1, pp. 16-23, 2000.
[10] D. B. Simons and F. Senturk, “Sediment transport technology,” Water Resources, Littleton, 1992.
[11] C. L. Chiu, “Three-dimensional open channel flow,” Journal of
Hydraulics Division, ASCE, vol. 104, no. 8, pp. 1119-1136, 1978.
[12] C. L. Chiu, “Entropy and probability concepts in Hydraulics,” Journal
of Hydraulic Engineering, ASCE, vol. 113, no. 5, pp. 583-599, 1987.
[13] C. L. Chiu and Y. C. Chen, “An efficient method of discharge measurement in tidal streams,” Journal of Hydrology, vol. 265, pp. 212-224, 2002.
[14] C. L. Chiu and N. C. Tung, “Maximum velocity and regularities in open-channel flow,” Journal of Hydraulic Engineering, ASCE, vol. 128, no. 4, pp. 390-398, 2002.
[15] T. H. Choo, “An efficient method of the suspended sediment-discharge measurement using entropy concept,” Water Engineering Research, vol. 1, no. 2, pp. 95-105, 2000.
[16] U. Zanke, “Berechnung der sinkgeschwindigkeiten von sedimenten,”
Mitteilungen des Franzius-Instituts, vol. 46, pp. 231-245, 1978.
[17] R. Xia, “Relation between Mean and Maximum Velocities in a Natural River,” Journal of Hydraulic Engineering, vol. 123, no. 8, pp. 720-723, 1997.
Hyeon Cheol Yoon was born on April 15, 2982. He got the Ph.D. from Pusan National University in Korea. His major is hydraulics and hydrology. He is researcher in Disaster Prevention Research Division, National Disaster Management Research Institute, Goyangdae-Ro, Ilsanseo-Gu, Goyang-Si, Gyeonggi-Do, 10223, Korea.
Sam Hee Lee was born on November 2, 1960. He got the Ph. D. from University of Tsukuba in Korea. His major is eco hydraulics and sedimentation. He is senior research fellow, Hydro Science and Engineering Research Institute, Korea Institute of Civil Engineering and Building Technology (KICT), Korea.