1925091 IJCEE-IJENS @ International Journals of Engineering and Sciences IJENS
Application of Taguchi’s approach in the optimization of
mix proportion for Microwave Incinerated Rice Husk Ash
Foamed Concrete
MF Nuruddina, R Bayuajia,b, a
Universiti Teknologi PETRONAS, Civil Engineering Department, Tronoh, 31750 Perak, Malaysia
b
Institut Teknologi Sepuluh Nopember, Civil Engineering Department, Sukolilo Surabaya, Indonesia Email:[email protected], b [email protected]
Abstract-In this study mix proportion parameters of lightweight foamed concrete (LWFC) are analyzed by using the Taguchi’s experiment design methodology for optimal design. For that purpose, mixtures are designed in L16 orthogonal array with five factors, namely, Microwave
Incinerated Rice Husk Ash (MIRHA) contents, water cementitious ratio (w/c), sand cement ratio (s/c), superplasticizier (SP) content, foam content. The mixtures are tested, both in fresh and hardened states and to meet the entire practical and technical requirement of LWFC. The results are analyzed using the Taguchi experimental design methodology. The best possible levels of mix proportions are determined for maximization through compressive strength, splitting tensile strength, UPV. Dry density, porosity, and water absorption can be really minimized by the proposed optimum mixture proportions.
Keywords: Lightweight Foamed Concrete (LWFC), Microwave Incinerated Rice Husk Ash (MIRHA), Taguchi Method
1. INTRODUCTION
Foamed concrete is an up and coming material in construction application. From the current estimate UK Market [1], the utilization of foamed concrete has in the past 13 years grown more rapidly than any other “special” concrete product (close to 1 million m3 annually). In Malaysia, the first major application of foamed concrete is at the SMART tunnel in Kuala Lumpur [2].
The fundamental difference of foamed concrete with normal concrete is that it can be designed to the required light density by arranging air foam as an “aggregate” in concrete[3, 4]. Foamed concrete possesses many advantages such as lightweight, thermal and sound insulation, void filling, good shock absorption and high impact resistance [5]. Nevertheless the criteria for structural lightweight concrete are minimum 28 day cylinder compressive strength of 17.5 N/mm2 and maximum dry density of 1850 kg/m3 [6].
In Europe, LWFC is considered load bearing if it fulfils the requirement strength as structural application at 28 day (typically greater than 20 N/mm2 compressive strength with actual plastic density of 1405 kg/m3) [7]. In South Africa,
LWFC of density 1500 kg/m3 is considered to be a load bearing concrete if a minimum compressive strength of 17.5 N/mm2 at 28 day [8] is met. The low thermal conductivity, high compressive strength and high performance [9] of foamed concrete can be achieved by incorporating with high fly ash [7, 8], or silica fume and ultra-fine silica powder, fly ash without using sand, and other measures.
Hamidah et al’s [10] research showed that the lower sand-cement ratio results in foamed concrete of higher compressive strength and the mix proportion needed huge amount of cement. It showed that cementitious material is an interesting factor to explore in more detail.
The use of replacement materials in Portland cement has been gaining much attention in recent years. Given the world situation with respect to cement demand and the cost of energy, binders such as ground granulated blast-furnace slag (GGBS) and pulverized fuel ash (PFA), rice husk ash (RHA) can be used. In blended cements, the replacement material may take part in the hydration reactions and contribute to the hydration products.
In Malaysia, large amount of rice husks are being produced annually almost reaching 2.2 million tons and the total annual world production is about 600 million tons [11]. The utilization of rice husk ash as a pozzolanic material in cement and concrete provides several advantages such as improved strength and durability, reduced materials cost due to cement savings and environmental benefits related to the disposal of waste materials and reduction of carbon dioxide emissions.
1925091 IJCEE-IJENS @ International Journals of Engineering and Sciences IJENS 2. RESEARCH SIGNIFICANCE
Introduction of superplasticizers into a LWFC mix can offset the negative effect of RHA on workability. The combination of RHA and superplasticizers may reduce the water/binder ratio of the foamed concrete mix, while still retaining acceptable workability. However, the compatibility of these two admixtures as well as the effectiveness of their combination is still not investigated in detail.
3. TAGUCHI METHODS AND RESEARCH MODEL Taguchi method is a statistical method developed by Genichi Taguchi during the 1950s [14] as an optimization process technique. Taguchi’s approach to parameter design provides the design engineer with a systematic and efficient method for determining near optimum design parameters for performance and cost. The first concept of Taguchi that must be discussed is the ‘‘noise factors”. Noise factors are viewed as the cause of variability in performance, including why products fail. The signal–to-noise ratio (S/N) is used in evaluating the quality of the product [15]. The S/N measures the level of performance and the effect of noise factors on performance and is an evaluation of the stability of performance of an output characteristic. Target values may be: 1. Smaller is better, choose when goal is to minimize the
response. The S/N can be calculated as given in Equation
(1) for smaller the better
S/N = ⎟
⎠ ⎞ ⎜ ⎝ ⎛ −
∑
= n i i Y n 1 2 10 1 log *10 (1)
2. Larger is better: choose when goal is to maximize the response. The S/N is calculated as given in Equation (2)
for larger the better
S/N = ⎟⎟
⎠ ⎞ ⎜⎜ ⎝ ⎛ −
∑
= ni Yi n 1 2 10 1 1 log *
10 (2)
3. Nominal is better: choose when goal is to target the response and it is required to base the S/N on standard deviations only. The S/N is calculated as given in Equation (3).
S/N =
(
)
⎟⎠ ⎞ ⎜ ⎝ ⎛ − −
∑
= n i i Y Y n 1 2 0 10 1 log *10 (3)
In Eqs. (1) – (3), Y shows the measured value of each response. When variability occurs, it is because the physics active in the design and environment that promotes change [15]. Noise factors can be classified into three groups: - External noise factors: sources of variability that come
from outside the product,
- Unit-to-unit noise: due to the fact that no two manufactured components or products are ever exactly alike,
- Internal noise: due to deterioration, aging, and wear incurred in storage and use.
The objective is to select the best combination of the control parameters so that the product or process is most robust with respect to noise factors. The Taguchi method
utilizes orthogonal arrays from design of experiments theory to study a large number of variables with a small number of experiments. An orthogonal array significantly reduces the number of experimental configurations to be studied. Furthermore, the conclusions drawn from small-scale experiments are valid over the entire experimental region spanned by the control factors and their settings.
In this study, the following parameters are considered in the mix proportions: MIRHA contents; s/c; w/c; SP;Foam.
There are ten steps in a systematic approach to the use of Taguchi's parameter design methodology [16]. Figure 1 shows the detail procedure of Taguchi design methodology.
.
1. Problem recognition and formulation
3. Select design or process parameters 2. Select quality characteristic
4. Classify design parameters
5. Determine levels
7. Choose appropriate orthogonal array
8. Conduct experiments
9. Perform statistical analysis
10 Perform a confirmatory experiment and implement results
6. Identify interactions
Fig.1 Taguchi method algorithm
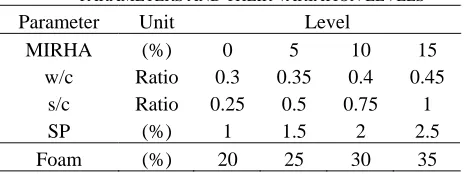
The significant difference between the Taguchi’s approaches with classical methodology is in step 7 of Fig.1 where the orthogonal matrix is employed parameters and levels. The variation levels for the considered parameters are shown in Table 1.
TABLE 1
PARAMETERS AND THEIR VARIATION LEVELS
Parameter Unit Level
MIRHA (%) 0 5 10 15
w/c Ratio 0.3 0.35 0.4 0.45
s/c Ratio 0.25 0.5 0.75 1
SP (%) 1 1.5 2 2.5
Foam (%) 20 25 30 35
The Orthogonal array (OA) experimental design method was chosen to determine the experimental plan, L16(45) is one of
1925091 IJCEE-IJENS @ International Journals of Engineering and Sciences IJENS being investigated, i.e. five parameters with four levels
(values). In Table 2, it should be noted that the parameter variable 1, 2, 3, 4 and 5 are MIRHA, w/c, s/c, SP and Foam respectively all have four levels.
TABLE 2
STANDARD L16 ORTHOGONAL ARRAY
Independent variables Exp. no Var
.1 Var .2 Var .3 Var .4 Var 5 Perform. parameter value
1 1 1 1 1 1 LWFC-1
2 1 2 2 2 2 LWFC-2
3 1 3 3 3 3 LWFC-3
4 1 4 4 4 4 LWFC-4
5 2 1 2 3 4 LWFC-5
6 2 2 1 4 3 LWFC-6
7 2 3 4 1 2 LWFC-7
8 2 4 3 2 1 LWFC-8
9 3 1 3 4 2 LWFC-9
10 3 2 4 3 1 LWFC-10
11 3 3 1 2 4 LWFC-11
12 3 4 2 1 3 LWFC-12
13 4 1 4 2 3 LWFC-13
14 4 2 3 1 4 LWFC-14
15 4 3 2 4 1 LWFC-15
16 4 4 1 3 2 LWFC-16
4. EXPERIMENTAL INVESTIGATION 4.1. Material
The constituent materials used in the laboratory to produce foamed concrete comprised (i) Portland cement (Ordinary Portland Cement BSEN 197-1-2000) (ii) natural sand, with 100 % passing 425 mm sieved (BS EN 12620:2002), (iii) MIRHA, with high reactive silica content, controlled combustion of ash (BS EN 450:2000) and (iv) free water (BS 3148:1980) (v) superplasticizer (BS EN 934-2:2001). The surfactant used for the production of the preformed foam by aerating palm oil based (typical of industry practice) a ratio of 1:30 (by volume), aerated to a density of 110 kg/m3 (ASTM C 869-91 (reapproved 1999), ASTM C 796-97). The chemical properties of MIRHA and OPC used are shown in Table 3.
TABLE 3 BINDER PROPERTIES
Weight % Oxide composition MIRHA OPC
Na2O 0.02 0.02
MgO 0.63 1.43
Al2O3 0.75 2.84
SiO2 90.75 20.44
P2O5 2.5 0.1
K2O 3.77 0.26
CaO 0.87 67.73
TiO2 0.02 0.17
Fe2O3 0.28 4.64
SO3 0.33 2.2
MnO 0.08 0.16
4.2. Test Specimens
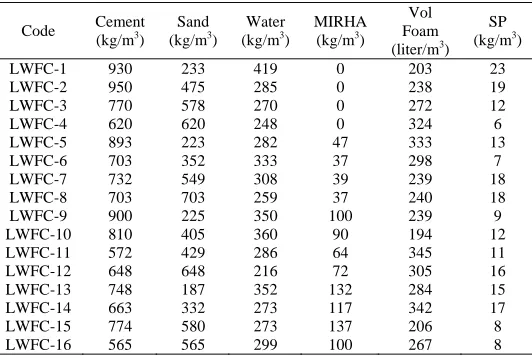
The mix proportions of foamed concrete are presented in TABLE 4. The mixes were prepared using a rotating planetary mixer and in accordance with BS 1305:1974. The viscosity of the concrete is evaluated through spread measurement. From each concrete mix, six 50 mm cube samples for 28 days compressive strength and three cylinders of 100 mm in diameter and 200 mm in height for 28 days splitting tensile strength are collected. Water absorption and porosity tests were conducted on three cylinders of 25.4 mm in diameter and 25.4 mm in height. Ultrasonic pulse velocity (UPV) test are performed on all taken specimens according to ASTM C597 and ASTM C 805, respectively. The specimens are demolded 24 hour after casting and placed in water tank at 23
±
2oC. The curing is done in accordance with BS EN 12390-2:2000TABLE 4
MIXTURE PROPORTION OF CONCRETE
Code Cement
(kg/m3)
Sand (kg/m3)
Water (kg/m3)
MIRHA (kg/m3)
Vol Foam (liter/m3)
SP (kg/m3)
LWFC-1 930 233 419 0 203 23
LWFC-2 950 475 285 0 238 19
LWFC-3 770 578 270 0 272 12
LWFC-4 620 620 248 0 324 6
LWFC-5 893 223 282 47 333 13
LWFC-6 703 352 333 37 298 7
LWFC-7 732 549 308 39 239 18
LWFC-8 703 703 259 37 240 18
LWFC-9 900 225 350 100 239 9
LWFC-10 810 405 360 90 194 12
LWFC-11 572 429 286 64 345 11
LWFC-12 648 648 216 72 305 16
LWFC-13 748 187 352 132 284 15
LWFC-14 663 332 273 117 342 17
LWFC-15 774 580 273 137 206 8
LWFC-16 565 565 299 100 267 8
4.3. Properties of Fresh and Hardened Foamed Concrete The spread test is carried out by using a mini cone (diameters: 10 and 7 cm, height: 5cm). The truncated cone mould is placed on a glass plate, filled with paste and lifted
[16]. As can be seen from Table 5, the spread measurement diameters of all mixtures are in the range of 10–36 cm.
For each concrete mixes, the compressive strength and splitting tensile strength are specified in the standard BS EN 12390-3 and BS EN 12390-6 respectively. UPV test is using Portable Ultrasonic Non Destructive Digital Indicative Tester (PUNDIT) according to British Standard 1881 and measurement is taken for three concrete cubes per mix. The saturated water absorption/permeable porosity were determined using vacuum saturation method as per ASTM C 1202-1997. All samples were conducted on curing 28 days.
1925091 IJCEE-IJENS @ International Journals of Engineering and Sciences IJENS tensile strength, porosity, water absorption, and UPV of
lightweight-foamed concrete are in the range of 1208 to 1918 kg/m3, 10.19 to 68.89 N/mm2, 0.92 to 5.03 N/mm2, 22.13 to 43.40 %, 9.87 to 20.00 %, and 2183 to 4743 m/s respectively.
The highest compressive, split tensile strength, UPV and the lowest dry density, porosity and water absorption captured are obtained from LWFC-2, LWFC-1, LWFC-8, LWFC-11, LWFC-8 and LWFC-7 mixes, respectively.
TABLE 5
TEST RESULT OF PROPERTIES OF FRESH AND HARDENED CONCRETE
Code Dry Density (kg/m3)
Compr. strength (N/mm2)
Splitting tensile strength (N/mm2)
Porosity (%)
Water absorption
(%)
UPV (m/s) Spread test (cm)
LWFC-1 1856 55.14 5.03 29.61 13.66 2633 36.0
LWFC-2 1899 68.89 4.94 22.42 10.55 2183 24.5
LWFC-3 1541 25.19 2.93 31.10 10.53 2644 27.8
LWFC-4 1340 13.76 1.91 40.25 12.78 2821 19.0
LWFC-5 1400 29.68 1.38 37.61 10.51 2764 20.5
LWFC-6 1504 26.57 3.02 33.68 20.26 2368 23.8
LWFC-7 1918 54.81 3.07 23.93 9.87 4471 30.3
LWFC-8 1886 63.87 3.40 22.13 10.60 4743 18.5
LWFC-9 1409 29.99 1.38 37.19 15.17 2588 12.2
LWFC-10 1517 37.46 1.63 28.82 15.80 2776 19.8
LWFC-11 1208 18.18 0.92 43.40 17.29 2643 27.0
LWFC-12 1668 40.14 2.05 25.51 10.52 3123 10.0
LWFC-13 1249 27.84 1.86 36.34 20.00 2713 23.7
LWFC-14 1412 30.77 2.40 30.33 14.16 2940 15.7
LWFC-15 1703 10.19 1.27 26.42 12.99 2742 10.0
LWFC-16 1374 22.93 1.65 30.18 16.17 3002 13.8
5. RESULT AND ANALYSIS
The best possible levels of mix proportions were investigated for the maximization of compressive strength, splitting tensile strength, UPV and for the minimization of dry density, water absorption and porosity values using the Taguchi technique.
The performance statistics for ‘‘the larger the better” situations are evaluated for maximization properties of LWFC
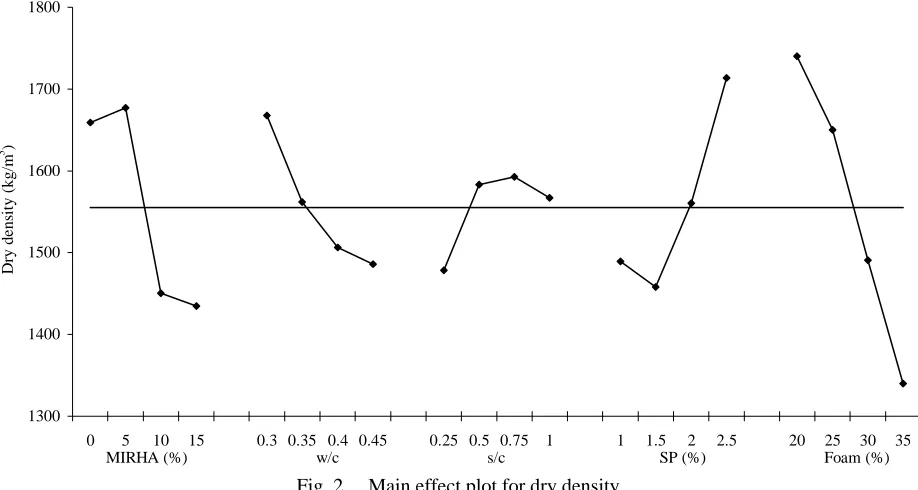
and ‘‘the smaller the better” situations are evaluated for minimization properties of LWFC. Since all parameters had interaction between them in LWFC mix, the best possible testing conditions of the LWFC properties can be determined from the main effect plot graphs from Figure 2 to Figure 4 for dry density, 28-day compressive strength, and 28-day splitting tensile strength, respectively
1300 1400 1500 1600 1700 1800
0 5 10 15 0.3 0.35 0.4 0.45 0.25 0.5 0.75 1 1 1.5 2 2.5 20 25 30 35
D
ry d
e
ns
it
y
(kg/m
3 )
MIRHA (%) w/c s/c SP (%) Foam (%)
1925091 IJCEE-IJENS @ International Journals of Engineering and Sciences IJENS
17 22 27 32 37 42 47
0 5 10 15 0.3 0.35 0.4 0.45 0.25 0.5 0.75 1 1 1.5 2 2.5 20 25 30 35
Co
m
pre
ss
iv
e S
tren
gth
(N
/m
m
2 )
MIRHA (%) w/c s/c SP (%) Foam (%)
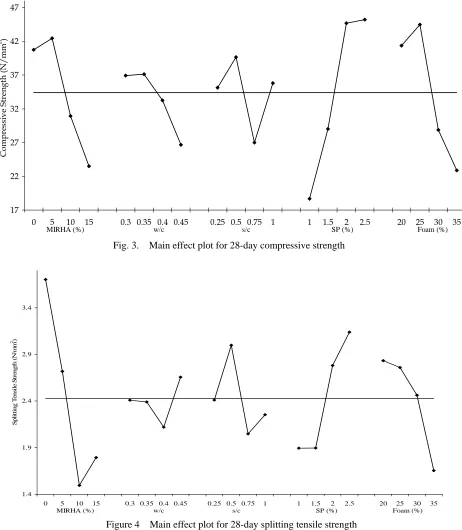
Fig. 3. Main effect plot for 28-day compressive strength
1.4 1.9 2.4 2.9 3.4
0 5 10 15 0.3 0.35 0.4 0.45 0.25 0.5 0.75 1 1 1.5 2 2.5 20 25 30 35
S
p
li
tt
in
g
T
en
si
le
S
tr
en
g
th
(
N
/m
m
2)
MIRHA (%) w/c s/c SP (%) Foam (%)
1925091 IJCEE-IJENS @ International Journals of Engineering and Sciences IJENS TABLE 6
ANALYSIS OF VARIANCE OF LWFC
Parameter statistical parameters Dry Density compressive
strength
Splitting tensile strength
Porosity Water
Absoprtion UPV
MIRHA DF 3 3 3 3 3 3
SSS 204558 1069 12 41 50 2348883
ASS 204558 1069 12 41 50 2348883
MS 68186 356 4 14 17 782961
Contribution (%) 24.12% 23.25% 52.20% 6.56% 31.70% 33.14%
s/c DF 3 3 3 3 3 3
SSS 32773 391 2 98 53 1905597
ASS 32773 391 2 98 53 1905597
MS 10924 130 1 33 18 635199
Contribution (%) 3.87% 8.51% 8.77% 15.82% 33.48% 26.89%
w/c DF 3 3 3 3 3 3
SSS 79573 126 1 87 41 1128635
ASS 79573 126 1 87 41 1128635
MS 26524 42 0.2 29 14 376212
Contribution (%) 9.38% 2.73% 2.74% 14.07% 25.56% 15.92%
SP DF 3 3 3 3 3 3
SSS 156036 1830 5 102 2 1029303
ASS 156036 1830 5 102 2 1029303
MS 52012 610 2 34 1 343101
Contribution (%) 18.40% 39.81% 20.97% 16.55% 1.43% 14.52%
Foam DF 3 3 3 3 3 3
SSS 374985 1181 3 290 12 675254
ASS 374985 1181 3 290 12 675254
MS 124995 394 1 97 4 225085
Contribution (%) 44.22% 25.69% 15.32% 47.00% 7.83% 9.53%
Note: DF = Degree of freedom; SSS = Sequential sum of square; ASS = Adjusted sum of square; MS = Mean square (variance)
A statistical analysis is performed to determine the statistically significant factors and the data analysis is presented in Table 6. Finally, degree of contribution of each significant factor is obtained so as to determine the level of its statistical importance in the model. The contribution percentage gives an idea about the degree of contribution of the factors to the measured response. If the contribution percentage is high, the contribution of the factors to that particular response is more. Likewise, lower contribution percentage will lower the contribution factors on the measured response.
Dry density of concretes must be minimized for reducing the self-weight of foamed concrete. The decreasing density is affected by the increasing of MIRHA content, w/c and FC values (see Figure 2). Foam is the most influential factor on the dry density of the LWFC with 44.2% contribution. The second most influential factor is MIRHA with 24.1% contribution. The optimum mix proportions for minimization of dry density is 15% MIRHA, 0.45 w/c, 0.25 s/c, 1.5% SP, and 35% Foam.
In Fig. 3, SP is the most influencing factor on the compressive strength of the LWFC with 39.8% contribution. The second most influencing factor is FC content with 23.25% contribution. An optimal condition for maximum 28-day compressive strength is obtained at 5% MIRHA, 0.35 w/c, 0.5 s/c, 2 % SP, and 25% foam.
As it can be seen from Figure 4, decreasing SP parameters decreases the splitting tensile strength but decreasing the content of foam parameter value increases the splitting tensile
strength. MIRHA content is the most influencing factor on the splitting tensile of the LWFC with 52.20% contribution. The second most influential factor is SP with 20.97 % contribution.
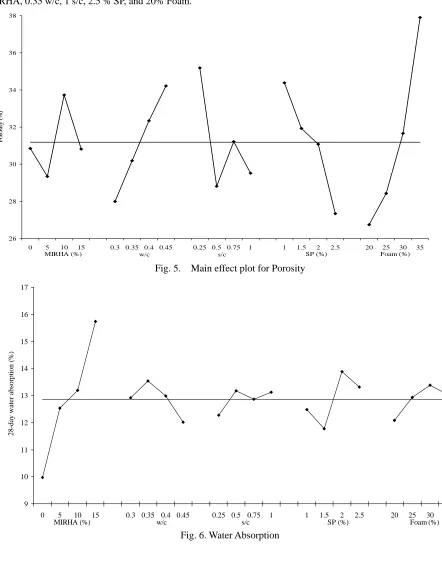
The porosity of foamed concrete must be minimized for durability purpose. In this research, the porosity is a measure of the portion of the total volume of concrete occupied by pores. Figure 5 shows that increase in w/c and FC increases the porosity but increasing the content of SP decreases the porosity. FC is the most influencing factor on the porosity of the LWFC with 47.0% contribution. The second most influential factor is SP with 16.6 % contribution. An optimal condition for minimum porosity is obtained at 5% MIRHA, 0.3 w/c, 0.5 s/c, 2.5% SP, and 20% Foam.
Water absorption of concrete is related to its porosity, which is a measure of the portion of the total volume of concrete occupied by pores. Water absorption of concretes must be minimized for durability purpose. According to the Figure 6, when MIRHA value is increased, the water absorption is increased. The optimum mix proportions for minimization of water absorption of concretes is 5% MIRHA, 0.3 w/c, 1 s/c, 1.5% SP, and 25% Foam. Analysis of variance results proposes that s/c, MIRHA and w/c are the most effective parameter on the water absorption of LWFC with 33.48%, 31.70% and 25.56% respectively contribution.
1925091 IJCEE-IJENS @ International Journals of Engineering and Sciences IJENS 5% MIRHA, 0.35 w/c, 1 s/c, 2.5 % SP, and 20% Foam.
26 28 30 32 34 36 38
0 5 10 15 0.3 0.35 0.4 0.45 0.25 0.5 0.75 1 1 1.5 2 2.5 20 25 30 35
P
o
ro
si
ty
(%
)
MIRHA (%) w/c s/c SP (%) Foam (%)
Fig. 5. Main effect plot for Porosity
9 10 11 12 13 14 15 16 17
0 5 10 15 0.3 0.35 0.4 0.45 0.25 0.5 0.75 1 1 1.5 2 2.5 20 25 30 35
2
8
-d
ay
w
at
er a
b
so
rp
ti
o
n
(%
)
MIRHA (%) w/c s/c SP (%) Foam (%)
1925091 IJCEE-IJENS @ International Journals of Engineering and Sciences IJENS
2250 2450 2650 2850 3050 3250 3450 3650 3850
0 5 10 15 0.3 0.35 0.4 0.45 0.25 0.5 0.75 1 1 1.5 2 2.5 20 25 30 35
UP
V
(
m
/s
)
MIRHA (%) w/c s/c SP (%) Foam (%)
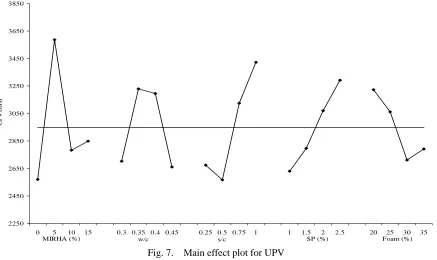
Fig. 7. Main effect plot for UPV
According to Figure 2 to 7, the best mix proportions of the target properties are tabulated in Table 7.
TABLE 7
OPTIMAL MIX-DESIGN PROPORTIONS FOR PROPERTIES OF FOAMED CONCRETE
Optimal mix Proportional MIRHA (%)
w/c s/c SP (%)
Foam (%) Dry Density 15 0.45 0.25 1.5 35 compressive strength 5 0.35 0.5 2 25 Splitting Tensile Strength 5 0.45 0.5 2.5 20
Porosity 5 0.3 0.5 2.5 20
Water absorption 5 0.3 1 1.5 25
UPV 5 0.35 1 2.5 20
6. EXPERIMENTAL WORK ON THE OPTIMUM MIX-DESIGN
PROPORTIONS
In order to verify the optimum mix-design proportion obtained using the Taguchi method, laboratory experiments were performed to check whether the compressive strength, splitting tensile strength and ultrasonic pulse velocity can be really maximized and dry density, porosity, and water absorption can be really minimized by the proposed optimum mixture proportions. In order to obtain the meaningful results same materials and same conditions were used with the Taguchi analyses. The results can be seen from Table 8. The verification study results showed that the proposed optimum mix proportions concurred well with result obtained by Taguchi’s approach.
.
TABLE 8
THE OPTIMUM MIX-DESIGN VERIFICATION ON CURING 28 DAYS.
Concrete Property Test Result
Dry Density (kg/m3) 1563
Compressive strength (N/mm2) 82.56 Splitting tensile strength (N/mm2) 4.2
Porosity (%) 18.461
Water absorption (%) 1.6
UPV (m/s) 3875
7. CONCLUSION
A new approach is established using Taguchi method for determination of the optimum compositions of materials proportions and the effect of MIRHA properties to the properties of foamed concrete. LWFC consists of many components therefore Taguchi method with L16 (45)
orthogonal array is adopted to investigate the ranking of the effective parameters and best possible mix proportions of LWFC. At the end of this research, it is evident that Taguchi method can simplify the test protocol required to optimize mix proportion of LWFC by reducing the number of trial batches. This study has shown that it possible to design foamed concrete that satisfies the criteria of high strength lightweight concrete.
REFERENCES
1925091 IJCEE-IJENS @ International Journals of Engineering and Sciences IJENS
What, Why, How? in Use of Foamed Concrete in Construction. 2005. University of Dundee: Thomas Telford.
2. Y L Lee, Y.T.H. Exploitation of Solid Wastes with Foamed Concrete - Challenges Ahead. in Use of Foamed Concrete in Construction. 2005. University of Dundee: Thomas Telford.
3. Nuruddin, M.F., Bayuaji R, Artificial Neural Network Prediction For Foamed Concrete Compressive Strength. Journal of International Association for Concrete Technology, 2007. Vol. 5 No.2 p. pp 11-23. 4. Valore, Cellular Concrete. Journal of The American
Concrete Institute, 1954.
5. Zaidi, A.M.A., Rahman, IA, Investigation On Foamed Concrete As A Novel Protective Structure.
ICCE'08, 2008.
6. ASTM-C330-69, Specification for lightweight aggregates for structural concrete 2001.
7. McCarthy, M.R.J.a., Preliminary views on the potential of foamed concrete as a structural material.
Magazines of Concrete Research, 2005. 57, No1, February: p. 21-31.
8. Kearsley EP, P.W., The Effect of high fly ash content on the compressive strength of foamed concrete. Cem. and Concr. Res, 2001. 31: p. 105-112.
9. PAN Zhihua1, F.H., Wee Tionghuan, Preparation of High Performance Foamed Concrete from Cement, Sand and Mineral Admixtures. 2006. DOI
10.1007/s11595-005-2295-4.
10. MS Hamidah, I.A., MR A Ruslan, K Kartini, NM Fadhil, Optimisatiom of Foamed Concrete Mix of Different Sand-Cement ratio and Curing Conditions.
Global Construction: Ultimate concrete opportunities, 2005.
11. Institute, I.R.R., Rough Rice Production by Country and Geographical Region 1961-2004. 2005.
12. Nuruddin, M.F., Bayuaji R., Mirha Foamed Concrete For Load Bearing Structures, in International Engineering Convention 2009 (Intec2009). 2009: Damascus Syria.
13. Nuruddin, M.F., Bayuaji, R. , Optimum mix proportioning of mirha foamed concrete using taguchi's approach, in APSEC-EACEF U.T.M. UTM-Skudai, Editor. 2009: Langkawi.
14. Jiju Antony, D.P., Chengbo Wang, Maneesh Kumar,
An application of Taguchi method of experimental design for new product design and development process. Assembly Automation, 2006: p. 18-24. 15. Genichi Taguchi, S.C., Shin Taguchi, Robust
Engineering. 2000.
16. L. D’Aloia Schwartzentruber, R.L.R., J. Cordin
Rheological behaviour of fresh cement pastes formulated from a Self Compacting Concrete (SCC). .