AN EXPERIMENTAL INVESTIGATION TO STUDY
THE PARAMETRIC EFFECT OF ULTRASONIC
WELDING
1Vipin Kumar,2Sandeep Kumar,3Rakesh
M.Tech Scholar, Asst. Professor, Asst. Professor MECHANICAL ENGINEERING DEPT.
UIET, MDU, ROHTAK
Abstract: - in modern era, because of magnificent characteristics such as low density, high corrosion resistance and high strength, copper and its alloy are replacing other materials and metals. Welding of copper and its alloys by traditional methods is difficult as they causes defects such as porosity and hot cracks. But with help of Ultrasonic welding these defetcs can be avoided as the temperature produced during this process is one third of the melting temperature of the alloy. It is a new and quick method to join different metals like copper and its alloy and composites.
Keywords: Welding, Tensile strength
1. Introduction
It is a modern system where high frequency vibration is given at work-piece such that both piece connected to each other at high pressure to make a solid weld. We use this technique for dissimilar material and plastic. In this technique , there is no requirement of soldering materials, nail or bolts to join the material together. Both parts are placed between anvil and sonotrode and this is attached to transducer, transducer is used to emit low-amplitude vibrations.Elangovan et al.[1] developed a model which is used to predict temp.and stress distribution during welding and its influence at the workpiece, anvil and sonotrode. The effects of material thickness, clamping force and friction coefficient at the time of heat generation. Siddiq and Ghassemieh[2] used thermal and acoustic softening effects for thermomechanical analysis of ultrasonic welding. Konchakova et al. [3] worked to join CFRP composite with aluminium alloy. De vries[5] discussed the mechanism and mechanics of ultrasonic welding . Here a mechanics based model is developed to measure the tangential force at the time of welding , this force acts at the weld surface and correlate it to weld quality. Fuat kara et al.[6] used artificial neural network , to predict cutting temp. in orthogonal machining. This experiment is based on 60 numerical data computed through FEA are prepared for training and testing data of the artificial neural network Girish et al.[7] have modeled ANN to predict roughness at surface . Genetic algorithm is coupled with this model to optimize parameters of machining. Girish et al.[8] developed a model, artificial neural network is used to predict energy consumption in machining . To test the neural network, 27 experimental data are used. Sebahattin et al.[9] designed an ANN model , to measure compression strength in heat treated woods. It compares with multi linear regression model. The author conclude that this technique used to predict values in short time and low error than regression model. Dessinger and suich[10] introduced simultaneous optimization of several variable. They described desirability function in this we find value of desirability. On the basis of desirability value we can find best parameter.YosukeTamada [11] worked on welding welding parameters of Al and Cu plate,he used planar vibrations by dumbbell shape ultrasonic complex vibration.
1.2. RESEARCH OBJECTIVE
we study the effects on tensile strength by changing three variable-pressure, amplitude and weld time.
1. Effect of weld time on tensile strength. 2. Effect of amplitude on tensile strength. 3. Effect of pressure on tensile strength.
2. EXPERIMENTATION TECHNIQUE
2.1 Response Surface Methodology
𝑍 = ± 𝑎0 ± 𝑎1𝑥 ± 𝑎2𝑦 ± 𝑎3𝑥2± 𝑎4𝑦2± 𝑎5𝑥𝑦 ± 𝑒
where:
Z = response variable, a0, a1, a2 … = coefficient
e =experimental error , x, y =controllable factors
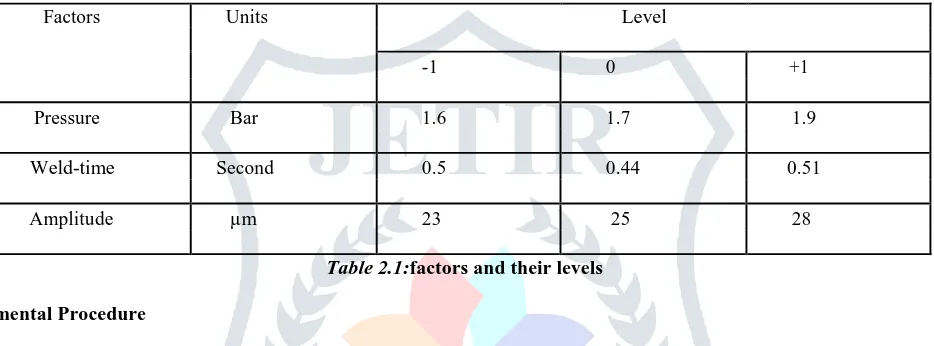
To conduct the experiment, there are three controllable factors selected -pressure, welding time and amplitude.
In table 2.1 factors and their levels are given
Factors Units Level
-1 0 +1
Pressure Bar 1.6 1.7 1.9
Weld-time Second 0.5 0.44 0.51
Amplitude µm 23 25 28
Table 2.1:factors and their levels
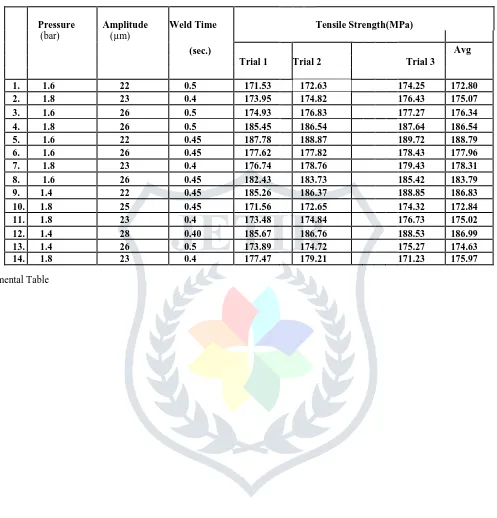
2.2 Experimental Procedure
Table 2.2
Experimental Table
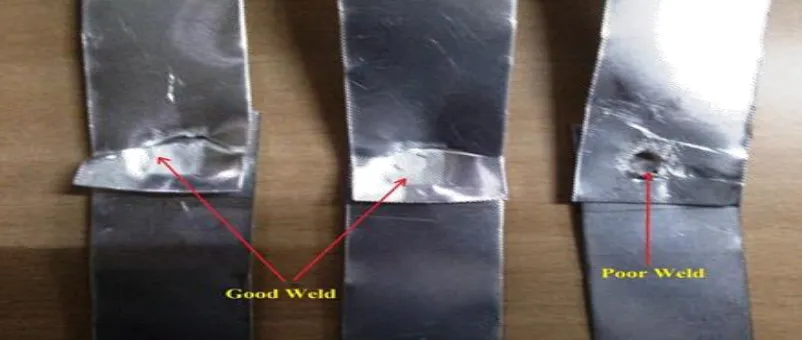
Computer Tensile testing m/c is used to meassure the tensile strength of the joint .We observe there is a ductile fracture except a few specimen which have poor quality . In dia. 2.2 some fracture specimen given
Pressure Amplitude Weld Time Tensile Strength(MPa)
(bar) (µm)
(sec.)
Trial 1 Trial 2
Trial 3
Avg
1. 1.6 22 0.5 171.53 172.63 174.25 172.80
2. 1.8 23 0.4 173.95 174.82 176.43 175.07
3. 1.6 26 0.5 174.93 176.83 177.27 176.34
4. 1.8 26 0.5 185.45 186.54 187.64 186.54
5. 1.6 22 0.45 187.78 188.87 189.72 188.79
6. 1.6 26 0.45 177.62 177.82 178.43 177.96
7. 1.8 23 0.4 176.74 178.76 179.43 178.31
8. 1.6 26 0.45 182.43 183.73 185.42 183.79
9. 1.4 22 0.45 185.26 186.37 188.85 186.83
10. 1.8 25 0.45 171.56 172.65 174.32 172.84
11. 1.8 23 0.4 173.48 174.84 176.73 175.02
12. 1.4 28 0.40 185.67 186.76 188.53 186.99
13. 1.4 26 0.5 173.89 174.72 175.27 174.63
Fig. 2.2 Fractured specimens
4. RESULTS AND DISCUSSION
A comprehensive analysis carry out for three trial value of tensile strength and their average. Here tensile strength depend upon three factors-pressure, amplitude and weld time. We plot three different graph ,in first graph we see tensile strength at different pressure. Here tensile strength vary from 172.80MPa to 188.79MPa and pressure vary from 1.4 bar to 1.8 bar.In second graph, we see tensile strength at different amplitude.Here tensile strength vary from 172.80MPa to 188.79MPa and amplitude vary from 22µm to 28µm.In third graph ,we see variation of tensile strength at different weld time. Here minimum value of tensile strength is 172.80MPa and maximum value is 188.79MPa and weld time vary from 0.40second to 0.50second.
160 165 170 175 180 185 190
1.4 1.4 1.4 1.6 1.6 1.6 1.6 1.6 1.8 1.8 1.8 1.8 1.8 1.8
Ten
si
le
S
tr
e
n
gth
(M
Pa)
pressure (Bar)
Fig4.2 Tensile strength vs Amplitude
Fig4.3 Tensile strength vs weld time
OPTIMIZATION USING DESIRABILITY FUNCTION
Derringerand Suich introduce this method . Individual response is changed into compairing desirability values and range of its values lie between zero and one.when value is one it means response is at target value.If value is zero it means it is not desired and response is outside its tolerance value.this formula is used to find individual desirability value
y∧≤ymin, di=0
If ymin≤y∧≤ymax, di=(y∧-ymin/ymax-ymix)r If y∧≥ymax, di=1
Number
Pressure
(Bar) Amplitude (µm) weld time (Sec.)
Tensile Strength
(MPa) Desirability
1 1.8 23 0.4 175.07 0.22
2 1.6 26 0.5 176.34 0.22
3 1.8 26 0.5 186.54 0.86
4 1.6 26 0.45 179.96 0.32
5 1.8 23 0.4 178.31 0.34
160 165 170 175 180 185 190
22 22 22 23 23 23 23 25 26 26 26 26 26 28
Ten si l S tr e n gth (M Pa) Amplitude Tensile 160 165 170 175 180 185 190
0.5 0.5 0.45 0.4 0.45 0.4 0.5
10 1.4 25 0.40 186.79 0.89
11 1.4 26 0.50 174.63 0.11
12 1.8 23 0.40 175.97 0.198
Here y∧represents the value of responses ymin represents the lower acceptable limit of y∧, ymaxrepresents the upper acceptable limit of y∧
and r represents desirability function index.We observe that optimal values for tensile strength are weld time 0.40 second, amplitude 25µm and 1.4 bar pressure. At optimal parameter setting tensile strength is 186.79MPa have desirability value 0.89.
5. Conclusion
The research work gives best way to choose parameters such that we achieved desired tensile strength.
When we optimize by desirability function then weld time 0.40 sec., amplitude 25µm and 1.4 bar pressure. At optimal parameter setting tensile strength is 186.79MPa have desirability value 0.89
REFERENCES
1. Elangovan, S., Semeer, S., and Prakasan, K. (2009). Temperature and stress distribution in ultrasonic metal welding—An FEA-based study. Journal of materials processing technology, 209(3), 1143-1150.
2. Siddiq, A., and Ghassemieh, E. (2008). Thermomechanical analyses of ultrasonic welding process using thermal and acoustic softening effects. Mechanics of Materials, 40(12), 982-1000.
3. Konchakova, N., Balle, F., Barth, F. J., Mueller, R., Eifler, D., and Steinmann, P.(2010). Finite element analysis of an inelastic interface in ultrasonic welded metal/fibre- reinforced polymer joints. Computational Materials Science, 50(1),184-190.
4. Levy, A., Le Corre, S., Chevaugeon, N., and Poitou, A. (2011). A level set based approach for the finite element simulation of a forming process involving multiphysics coupling: Ultrasonic welding of thermoplastic composites. European Journal of Mechanics-A/Solids, 30(4), 501-509.
5. De Vries, E. (2004). Mechanics and mechanisms of ultrasonic metal welding(Doctoral dissertation, The Ohio State University).
6.Fuat kara, kubilayAslantas, Adem Cieck, et al. Prediction of cutting temperature in orthogonal machining of AISI 316L using artificial neural network. Applied soft Computing.2015,3864-74.
7Girish kant, kuldip singh sangwan . Oredictive modeling and optimization of machining paramaters to Minimize surface Roughness using Artificial Neural Network Coupled with Genetic Algorithm. 15th CIRP Conference on modeling of Machining Operations2015,31453-458
8. Amin, S. G., Ahmed, M. H. M., and Youssef, H. A. (1995). Computer-aided design of acoustic horns for ultrasonic machining using finite-element analysis. Journal of Materials Processing Technology, 55(3), 254-260.
9. Pandya Bhavik, Patel Saral, and Patel Viral (2014). Effect of horn (sonotrode) profile on weld strength of HDPE plastic by using ultrasonic welding. International Journal for Technological Research and Engineering, 2(4), 2347-4718.
10. Derringer, G. and Suich, R. (1980) “Simultaneous Optimization of Several Response Variables”. Journal of Quality Technology 12, pp. 214-219.