Collaborative Approach among Management
Professionals: Scientometric approach
Dr. M. Tamizhchelvan
Deputy LibrarianThe Gandhigram Rural Institute-Deemed to be University Gandhigram – 624 302
Dr. S. Gopalakrishnan
Assistant Librarian (Retd)Madras Institute of Technology, Anna University Chennai – 600 044
Abstract - Collaborative approach, frequently referred to as a co-authored publication, has been used as a basic counting unit to measure collaborative activity. A variety of data analysis methods are employed during Scientometric analysis including co-authorship analysis, and citation analysis, indexes etc. In this study new derived method known as Chelvan and Gopal method of measures of reach of scientific output was made using Reach percentage (RP); Reach Activity Index (RAI); Unreach/Reach Activity Index (URAI); Unreach Activity Index (UAI) and Richness Factor Index (RFI) factors of authorship pattern has been used. In India, management education was way back to the 19th century. Since 1980’s management education got increased importance and received a professional education level status since management education aims to develop knowledge about overall business and also its different functions. Indian Institute of Management (IIM), a pioneering institution, recognized globally producing management professionals. There exist 20 IIMs of which 6 of them were established after 2015. In this study, the publications 13 IIMs those are included in the scopus alone taken for analyzing the collaborative approach. The research output data from Scopus, a multidisciplinary online database which is an international indexing and abstracting database, have been downloaded using the search terms as individual institutions. A total of 6061 publications have been identified and downloaded which were published between 1965 and 2017. Although there are several strategies such as citation analysis, indices, uncited publications, mapping the output outlined in number of studies, in this study a method thus derived giving due importance to number of papers and number of authors of the organization in calculating the Richness factor index and Reach Activity Index. It seems the factors that has been identified that attributed for reach and richness of publications seems to be meaningful instead of taking citation alone has a criteria to predict the value of the paper.
Key words: Collaborative approach, Scientometric approach, Management professionals; Richness Factor Index (RFI), Reach Activity Index (RAI), Unreach/Reach Activity Index (URAI), Unreach Activity Index (UAI)
I. INTRODUCTION
Scientometric, common research tool, has been widely applied in scientific production and research-trend studies in many disciplines of science and engineering (Almind & Ingwersen, 1997; Cronin, 2001; Moed, Debruin, & Vanleeuwen, 1995). The popularity in adaptation of these techniques in various disciplines stimulated stupendous growth of literature on scientometric and its related areas. The dimensional changes in these tool paved way for few innovative methods in measuring the trend of a particular domain.
For decades the multiple-author publication, frequently referred to as a co-authored publication, has been used as a basic counting unit to measure collaborative activity. Smith was one of the first researchers to observe an increase in the incidence of multiple-author papers and to suggest that such papers could be used as a proxy measure for collaboration among groups of researchers.
improves its performance in this respect. Let the collection K be the research papers published in a discipline or in a journal during a certain period of interest. In the following, we write fj is the number of papers having j authors in collection K; N is the total number of papers in K. N = Rjfj; and A is the total number of authors in collection K.
In this paper attempt has been made to identify the collaborative approach among management professionals with respect to Indian environment.
II. MANAGEMENT EDUCATION
In India, management education was way back to the 19th century. British government administration needs were fulfilled by this education to some extent. The graduates joined as clerks in the British administration. In Chennai in 1903 was set up the India’s first commercial school of Pachiappa charities. In 1913, Sydenham College in Mumbai was the first college level business school to be founded. This was followed by Shri Ram College of commerce in Delhi in 1920. These management institutions followed the US type of systems in terms of pedagogy, curriculum and interfacing with industry.
In the initial years of business education, it was not popular. All bright students were expected to join science stream and take engineering at the IIT’s or other technical institutes. Afterwards they joined companies as technical supervisors and then moved up to take up managerial positions. In 1961 two IIM’s were launched. IIM Calcutta with collaboration from Sloan school of Management at MIT and IIM Ahmadabad started with Harvard business school help.
Since 1980’s management education got increased importance and received a professional education level status since management education aims to develop knowledge about overall business and also its different functions. It was focused on graduate levels and help in developing future leaders. Some of the skills which management graduates were expected to have were good accounting skills and also operational management skills, marketing skills, good oral and written communications , critical thinking and as well team working skills. And also knowledge of information technology is required for leveraging its power in the business arena. The teaching pedagogy has been undergoing constant changes in the Management education to suit the above requirements.
III. INDIAN INSTITUTE OF MANAGEMENT
Indian Institute of Management (IIM), a pioneering institution, was initiated by Jawaharlal Nehru, the first Prime Minister of India, based on the recommendation of the Planning Commission. IIMs are registered as societies under the Indian Societies Registration Act. Each IIM is autonomous and exercises independent control over its day-to-day operations. However, the administration of all IIMs and the overall strategy of IIMs are overseen by the IIM council. The IIM Council is headed by India's Minister of Human Resource Development and consists of the chairpersons and directors of all IIMs and senior officials from the Ministry of Human Resource Development of the Government of India. There exist 20 IIMs of which 6 of them were established after 2015, in this study, the publications 13 IIMs are available in the scopus only taken for this study.
IV. REVIEW OF RELATED LITERATURE
A variety of data analysis methods are employed during Scientometric analysis including co-authorship analysis, and citation analysis (i.e., papers or authors often cited in cycle) Callon (1986); Callon, Courtiaol & Laville (1991); He (1999); Leydesdorff (1997); Peters & Van Raan (1993). Few indexing techniques such as h index (Hirsch,2005); h2 index (Kosmulski, 2006); g index (Egghe, 2006); a index (Jin, 2006); Normalized h index (hnom) (Sidiropoulos, Katsaros, and Manolopoulos 2007); r Index (Jin et al, 2007a); ar index, (Jin, 2007b); e index (Zhang, 2009); hg index, (Alonso 2010); p index (GanganPrathap, 2010); mapping techniques (Karpagam et al. 2011). Viswanathan and Tamizhchelvan (2014) analysed the growth on Spacecraft research during 2009-2013 based on the Scopus database. Bathrinarayanan and Tamizhchelvan (2014) studied Indian research output on MEMS literature using the Scopus database.
Lawani demonstrated that, as the number of authors per paper increases, the proportion of high-impact papers (i.e. papers earning a high number of citations) also increases.
(URAI);Unreach Activity Index (UAI) and Richness Factor Index (RFI) factors of authorship pattern has been used. (Tamizhchelvan and Gopalakrishnan, 2018a, 2018b)
V. OBJECTIVES The objective of the study were to identify the
Collaborative approach among the management professionals.
Reach of the paper
Richness of the paper
VI. HYPOTHESES Based on the objective the following hypotheses were formulated.
There exist collaboration trend among IIMs professionals
Collaborated papers have more citation then solo research papers
There exist significant difference between citation and reach of publications
There exist significant difference between citation and richness of the publications.
There exist no significant difference between RAI, URAI and UAI among IIMs VII. DATA ANALYSIS
For this study, the research output data have been downloaded using the search terms as follows Query : ((AF-ID("Indian Institute of Management Ahmedabad" 60033308) OR AF-ID("Indian Institute of Management Calcutta" 60070899) OR AF-ID("Indian Institute of Management Bangalore" 60071271) OR AF-ID("Indian Institute of Management Lucknow" 60072366) OR AF-ID("Indian Institute of Management Indore" 60105397) OR AF-ID("Indian Institute of Management Kozhikode" 60079444) OR AF-ID("Indian Institute of Management Rohtak" 60107374) OR (...) OR AF-ID("Indian Institute of Management Tiruchirappalli" 60107376))) from ‘Scopus’ a multidisciplinary online database which is an international indexing and abstracting database. For this study, a total of 6061 publications have been identified and downloaded which were published between 1965 and 2017.
VIII. MEASURE OF REACH AND RICHNESS
The scientific research output primarily depends on reach of the paper and richness of the paper. Even there were many methods adopted, in this paper the method suggested by Chelvan and Gopal has been adopted (Tamizhchelvan and Gopalakrishnan 2018a, 2018b) – Shown in Annexure I and II.
IX. COLLABORATIVE TREND OF IIM RESEARCH
Out of 6061 papers, single author papers and collaborated author papers were identified and the same has been shown in Table 1.
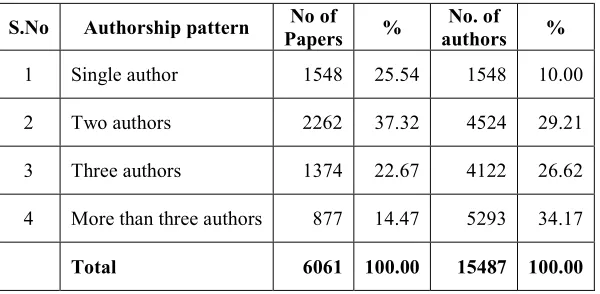
Table 1 Authorship pattern of IIM Publications
S.No Authorship pattern Papers No of % authors No. of %
1 Single author 1548 25.54 1548 10.00
2 Two authors 2262 37.32 4524 29.21
3 Three authors 1374 22.67 4122 26.62
4 More than three authors 877 14.47 5293 34.17
Figure 1 Papers Vs Authors
Out of 6061 papers, 1548 (25.54%) papers were of single author publications. It is followed by two authors (2262, 37.32%); three authors (1374, 22.67%) and More than three authors (877, 14.47%). Nearly 74.46% of papers were collaborative in nature. These 6061 papers were contributed by 15,487 authors. Only 10% of authors were single author papers. Remaining 90% were two authors, three authors and more three authors.
The trend of solo research and collaborated research among different IIMs were analysed and the same has been shown in Table 2
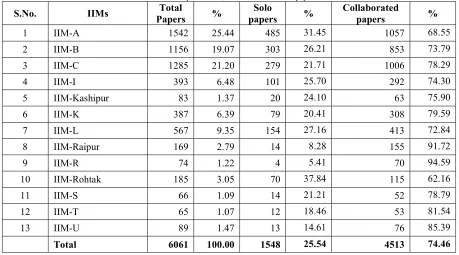
Table 2 Total publication, Solo and Collaborate papers
S.No. IIMs Papers Total % papers Solo % Collaborated papers %
1 IIM-A 1542 25.44 485 31.45 1057 68.55
2 IIM-B 1156 19.07 303 26.21 853 73.79
3 IIM-C 1285 21.20 279 21.71 1006 78.29
4 IIM-I 393 6.48 101 25.70 292 74.30
5 IIM-Kashipur 83 1.37 20 24.10 63 75.90
6 IIM-K 387 6.39 79 20.41 308 79.59
7 IIM-L 567 9.35 154 27.16 413 72.84
8 IIM-Raipur 169 2.79 14 8.28 155 91.72
9 IIM-R 74 1.22 4 5.41 70 94.59
10 IIM-Rohtak 185 3.05 70 37.84 115 62.16
11 IIM-S 66 1.09 14 21.21 52 78.79
12 IIM-T 65 1.07 12 18.46 53 81.54
13 IIM-U 89 1.47 13 14.61 76 85.39
`
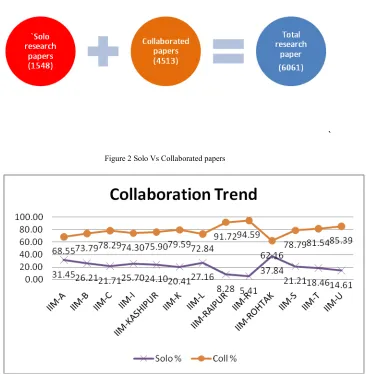
Figure 2 Solo Vs Collaborated papers
Figure 3 IIMs Vs Solo and Collaborated papers
The solo research papers were ranges between 5.41% and 31.45%. Out of the contributed papers of individual IIMs, maximum solo research paper can be seen in IIM – Rohtak (37.84%). It is followed by IIM-A (31.45%); IIM-L (27.16%); IIM-B (26.21%); and IIM-I(25.70%). Similarly in the case of collaborated papers, it ranges between 62.16% and 94.59%. Maximum number of collaborated papers can be seen from IIM-R (94.59%). It is followed by IIM- Raipur (91.72%); IIM-U (85.39%); IIM-T (81.54%). Least number of collaborated papers can be seen in IIM-Rohtak (62.16%) and IIM-A (68.55%).
X. COLLABORATED PAPERS
A total of 4513 (74.56%) papers were collaborated in nature. Collaborated papers were further analysed based on
Two Author Papers - 2262 Papers – 4524 Authors
Three Author Papers - 1374 Papers - 4122 Authors
More than Three authors papers - 877 Papers – 5293 Authors
Out of collaborated 4513 papers, 2262 papers were two authors; these 2262 papers were contributed by 4524 authors. These two authors were further analysed based on position of IIM authors and the same has been shown in Table 3.
Table 3 Collaborated Papers in IIMs – Two author papers
S .N o. II M s T ot al P ap er s C ol la b or at ed P ap er s T w o A u th or s p ap er F ir st A u th or S ec on d A u th or fr om o th er I IM S ec on d A u th or fr om s am e I IM A u th or s fr om O u ts id e II M T ot al N o. o f T w o A u th or s
1 IIM-A 1542 1057 537 477 60 35 502 1074
2 IIM-B 1156 853 379 340 39 12 367 758
3 IIM-C 1285 1006 532 483 49 17 515 1064
4 IIM-I 393 292 180 155 25 9 171 360
5 IIM-Kashipur 83 63 34 30 4 6 28 68
6 IIM-K 387 308 165 151 14 4 161 330
7 IIM-L 567 413 221 182 39 18 203 442
8 IIM-Raipur 169 155 41 31 10 8 33 82
9 IIM-R 74 70 36 30 6 3 33 72
10 IIM-Rohtak 185 115 61 58 3 1 60 122
11 IIM-S 66 52 15 15 0 0 15 30
12 IIM-T 65 53 23 13 10 0 23 46
13 IIM-U 89 76 38 21 17 1 37 76
6061 4513 2262 1986 276 114 2148 4524
Out of 2262 papers, 1986 papers IIM faculties were first author and 276 were second author. 114 authors were belonging to IIM. 2148 papers were one author from IIM and another from outside IIM. In other words out of 4524 authors, 2148 authors were outside IIM.
Three and More than Three Authors
Similarly three authors and more than three authors were analysed and the same has been shown in Table 4.
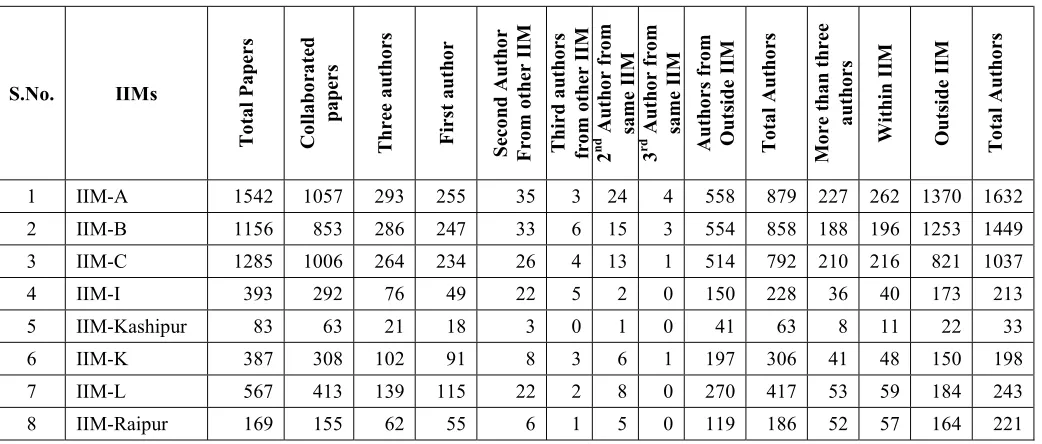
Table 4 Three and more authors collaboration
S.No. IIMs
T ot al P ap er s C ol la b or at ed p ap er s T h re e au th or s F ir st a u th or S ec on d A u th or F ro m o th er I IM T h ir d a ut h or s fr om o th er I IM 2 n
d A
u th or f ro m sa m e II M 3
rd A
u th or f ro m sa m e II M A u th or s fr om O u ts id e II M T ot al A u th or s M or e th an t h re e au th or s W it hi n I IM O u ts id e II M T ot al A u th or s
1 IIM-A 1542 1057 293 255 35 3 24 4 558 879 227 262 1370 1632
2 IIM-B 1156 853 286 247 33 6 15 3 554 858 188 196 1253 1449
3 IIM-C 1285 1006 264 234 26 4 13 1 514 792 210 216 821 1037
4 IIM-I 393 292 76 49 22 5 2 0 150 228 36 40 173 213
5 IIM-Kashipur 83 63 21 18 3 0 1 0 41 63 8 11 22 33
6 IIM-K 387 308 102 91 8 3 6 1 197 306 41 48 150 198
7 IIM-L 567 413 139 115 22 2 8 0 270 417 53 59 184 243
9 IIM-R 74 70 18 16 2 0 1 0 35 54 16 24 45 69
10 IIM-Rohtak 185 115 34 29 5 0 2 0 66 102 20 21 68 89
11 IIM-S 66 52 31 31 0 0 0 0 62 93 6 6 20 26
12 IIM-T 65 53 20 13 5 2 2 1 37 60 10 11 31 42
13 IIM-U 89 76 28 22 5 1 1 0 55 84 10 10 31 41
6061 4513 1374 1175 172 27 80 10 2658 4122 877 961 4332 5293
Out of 1374 papers, 1175 papers from IIM faculties were first author and 172 papers were second author. 27 papers were third author and further 2nd and 3rd authors from the same IIM are from 90 papers. The same way, 5293 authors contributed 877 papers, out of 5293 authors 961 from IIMs and 4332 authors from outside IIM.
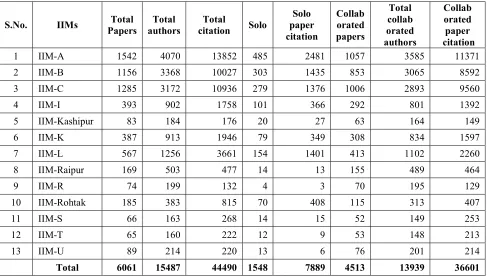
The citation of these 6061 papers were analysed and the same has been shown in Table 5. The total papers, total authors and total citations and the citations of solo and collaborated papers were calculated and presented.
XI. CITATIONS OF PAPERS
The citation of the solo and collaborated paper and authors presented is table 5. It is observed that the one fourth of the solo author papers and their citations 7889 and the remaining three fourth of collaborated author papers and their citations 36601.
Table 5 Citation papers for Solo and Collaborated Authors
S.No. IIMs Papers Total authors Total citation Total Solo paper Solo citation
Collab orated papers
Total collab orated authors
Collab orated paper citation
1 IIM-A 1542 4070 13852 485 2481 1057 3585 11371
2 IIM-B 1156 3368 10027 303 1435 853 3065 8592
3 IIM-C 1285 3172 10936 279 1376 1006 2893 9560
4 IIM-I 393 902 1758 101 366 292 801 1392
5 IIM-Kashipur 83 184 176 20 27 63 164 149
6 IIM-K 387 913 1946 79 349 308 834 1597
7 IIM-L 567 1256 3661 154 1401 413 1102 2260
8 IIM-Raipur 169 503 477 14 13 155 489 464
9 IIM-R 74 199 132 4 3 70 195 129
10 IIM-Rohtak 185 383 815 70 408 115 313 407
11 IIM-S 66 163 268 14 15 52 149 253
12 IIM-T 65 160 222 12 9 53 148 213
13 IIM-U 89 214 220 13 6 76 201 214
Total 6061 15487 44490 1548 7889 4513 13939 36601
XII. REACH ACTIVITY INDEX AND RICHNESS FACTOR
Reach Activity Index and Richness factors were calculated using the formula of Chelvan and Gopal in the annexure for
Total papers
Collaborated author papers
Total Papers
Reach Activity Index (RAI), Unreach / Reach Activity Index and Unreach Activity Index and Richness Factor Index are calculated for the total publications of the IIMs and presented in the table 6.
Table 6 Total Papers – RAI, URAI, UAI and RFI
S
.N
o.
II
M
s
T
ot
al
P
ap
er
s
T
ot
al
au
th
or
s
T
ot
al
C
it
ed
P
ap
er
s
T
ot
al
ci
ta
ti
on
s
R
an
k
R
A
I
R
an
k
U
R
A
I
R
an
k
U
A
I
R
an
k
R
F
I
R
an
k
1 IIM-A 1542 4070 999 13852 1 1.03 4 0.92 10 0.95 10 0.002207 13 2 IIM-B 1156 3368 752 10027 3 1.03 2 0.91 12 0.94 12 0.002575 12 3 IIM-C 1285 3172 867 10936 2 1.07 1 0.82 13 0.88 13 0.002683 11
4 IIM-I 393 902 203 1758 6 0.82 8 1.59 6 1.30 6 0.004959 10
5 IIM-Kashipur 83 184 41 176 12 0.79 10 1.74 4 1.36 4 0.011524 4 6 IIM-K 387 913 251 1946 5 1.03 3 0.92 11 0.95 11 0.005508 8
7 IIM-L 567 1256 358 3661 4 1.00 6 0.99 8 0.99 8 0.005141 9
8 IIM-Raipur 169 503 84 477 8 0.79 9 1.71 5 1.35 5 0.005611 7
9 IIM-R 74 199 32 132 13 0.69 12 2.22 2 1.53 2 0.008964 6
10 IIM-Rohtak 185 383 119 815 7 1.02 5 0.94 9 0.96 9 0.011502 5
11 IIM-S 66 163 40 268 9 0.96 7 1.10 7 1.06 7 0.024912 1
12 IIM-T 65 160 29 222 10 0.71 11 2.10 3 1.49 3 0.021346 2
13 IIM-U 89 214 36 220 11 0.64 13 2.49 1 1.60 1 0.011551 3
6061 15487 3811 44490
Based on total citation ranks were assigned to Individual IIMs. IIM-A were positioned first place with 13852 citations. It is followed by IIM-C; IIM-B, and IIM-L. Least rank were positioned by IIM-R (132 citations) and IIM- Kashipur (176).
The RAI, URAI, UAI and RFI, which gives importance to citation, total papers, total authors, were calculated using the formula stated in annexure – I and annexure – II. The ranks were assigned based on RAI, URAI, UAI and RFI and the same has been shown in Table -6.
According to RAI, the first three places were IIM-C; IIM-B and IIM-K. Least rank places were for IIM-U, IIM-R and IIM-T. Similarly based on URAI and UAI, the first three positions were for IIM-U, IIM-R and IIM-T. The least were for IIM-C; IIM-B and IIM-K.
The RFI for individual IIMs were calculated and the ranks were assigned. Based on RFI, IIM-S were positioned first. It is followed by IIM-T; IIM-U and IIM-Kashipur. Least positions were ranked by IIM-C, IIM-B and IIM-A.
Solo authored papers
Table 7 Solo Papers – RAI, URAI, UAI and RFI
S
.N
o.
II
M
s
S
ol
o
p
ap
er
s
S
ol
o
au
th
or
s
S
ol
o
p
ap
er
ci
ta
ti
on
C
it
at
io
n
ra
n
k
R
A
I
R
an
k
U
R
A
I
R
an
k
U
A
I
R
an
k
R
F
I
R
an
k
1 IIM-A 485 485 2481 1 0.93 6 1.18 8 1.09 8 0.011 13 2 IIM-B 303 303 1435 2 1.04 5 0.90 9 0.94 9 0.016 12 3 IIM-C 279 279 1376 4 1.05 4 0.90 10 0.94 10 0.018 11
4 IIM-I 101 101 366 6 0.86 9 1.38 5 1.19 5 0.036 9
5 IIM-Kashipur 20 20 27 8 0.88 7 1.30 6 1.15 6 0.068 4
6 IIM-K 79 79 349 7 1.19 2 0.64 12 0.76 12 0.056 8
7 IIM-L 154 154 1401 3 1.10 3 0.79 11 0.87 11 0.059 7 8 IIM-Raipir 14 14 13 10 0.50 11 3.26 2 1.65 2 0.066 5
9 IIM-R 4 4 3 13 0.88 8 1.30 7 1.15 7 0.188 1
10 IIM-Rohtak 70 70 408 5 1.31 1 0.45 13 0.59 13 0.083 2
11 IIM-S 14 14 15 9 0.50 12 3.26 3 1.65 3 0.077 3
12 IIM-T 12 12 9 11 0.44 13 3.91 1 1.73 1 0.063 6
13 IIM-U 13 13 6 12 0.54 10 2.93 4 1.59 4 0.036 10
1548 1548 7889
Based on Solo research paper citation ranks were assigned to Individual IIMs. IIM-A were positioned first place with 2481 citations. It is followed by IIM-B (1435 citations); IIM-L(1401 citations, and IIM-C (1376 citations). Least rank were positioned by IIM-R (3 citations); IIM-U (6) and IIM- Rajpur (10).
The ranks were assigned based on RAI, URAI, UAI and RFI. According to RAI, the first three places were IIM-Rohtak; IIM-K and IIM-L. Least rank places were for IIM-R, IIM-U and IIM-T. Similarly based on URAI and UAI, the first three positions were for IIM-T, IIM-Raipur and IIM-S. The least were for IIM-Rohtak; IIM-K and IIM-L.
The RFI for individual IIMs were calculated and rank were assigned. Based on RFI, IIM-R were positioned first. It is followed by IIM-Rohtak; IIM-S and IIM-Kashipur. Least positions were ranked by IIM-A, IIM-B and IIM-C.
Collaborated authors’ papers
Table 8 Collaborated Papers – RAI, URAI, UAI and RFI
S.No. IIMs borated Colla
papers
Colla borated authors
Colla borated
paper citation
Rank RAI Rank URAI Rank UAI Rank RFI Rank
1 IIM-A 1057 3585 11371 1 1.23 1 1.46 1 0.84 11 0.003 13
2 IIM-B 853 3065 8592 3 1.20 2 1.10 4 1.09 8 0.003 11
3 IIM-C 1006 2893 9560 2 1.00 3 1.24 2 0.80 13 0.003 12
4 IIM-I 292 801 1392 6 0.66 9 0.50 10 1.33 5 0.006 9
5 IIM-Kashipur 63 164 149 12 0.63 10 0.51 9 1.25 6 0.014 3
6 IIM-K 308 834 1597 5 0.80 7 0.78 6 1.03 9 0.006 7
7 IIM-L 413 1102 2260 4 0.81 6 0.83 5 0.98 10 0.005 10
8 IIM-Raipur 155 489 464 7 0.81 5 0.57 8 1.44 4 0.006 8
9 IIM-R 70 195 129 13 0.50 13 0.30 13 1.69 1 0.009 6
10 IIM-Rohtak 115 313 407 8 0.77 8 0.70 7 1.10 7 0.011 5
11 IIM-S 52 149 253 9 0.98 4 1.17 3 0.83 12 0.033 1
12 IIM-T 53 148 213 11 0.62 11 0.42 11 1.47 2 0.027 2
13 IIM-U 76 201 214 10 0.56 12 0.39 12 1.45 3 0.014 4
Total 4513 13939 36601
In regard to collaborated research paper citation ranks, IIM-A were positioned first place with 11371 citations. It is followed by IIM-C (9560 citations); IIM-B (8592 citations), and IIM-L (2260 citations). Least rank were positioned by IIM-R (129 citations); IIM- Kashipur (149 citations) and IIM- T (213).
The ranks were assigned based on RAI, URAI, UAI and RFI. The RAI ranges between 0.50 and 1.23. According to RAI, the first three places were A; B and C. Least rank were for R, U and IIM-T. Similarly based on URAI, the first three positions were for IIM-A, IIM-C and IIM-S. The least were for IIM-R; IIM-U and IIM-T. The first three ranks based on UAI were IIM-R; IIM-T and IIM-U. The least preferences were IIM-C, IIM-S and IIM-A.
Collaborated papers RFI for individual IIMs were calculated and rank were assigned. Based on RFI, IIM-S were positioned first. It is followed by IIM-T; IIM-Kashipur and IIM-U Least positions were ranked by IIM-A, IIM-C and IIM-B.
Table 9 Total, Solo and Collaborated Papers – RAI, URAI, UAI and RFI Rank Comparison
S.
No. IIMs
Total Papers Solo paper Collaborated papers
C it at io n R an k R A I R an k U R A I R an k U A I R an k R F I R an k C it at io n R an k R A I R an k U R A I R an k U A I R an k R F I R an k C it at io n R an k R A I R an k U R A I R an k U A I R an k R F I R an k
1 IIM-A 1 4 10 10 13 1 6 8 8 13 1 1 1 11 13
2 IIM-B 3 2 12 12 12 2 5 9 9 12 3 2 4 8 11
3 IIM-C 2 1 13 13 11 4 4 10 10 11 2 3 2 13 12
4 IIM-I 6 8 6 6 10 6 9 5 5 9 6 9 10 5 9
5 IIM-Kashipur 12 10 4 4 4 8 7 6 6 4 12 10 9 6 3
6 IIM-K 5 3 11 11 8 7 2 12 12 8 5 7 6 9 7
7 IIM-L 4 6 8 8 9 3 3 11 11 7 4 6 5 10 10
8 IIM-Raipur 8 9 5 5 7 10 11 2 2 5 7 5 8 4 8
9 IIM-R 13 12 2 2 6 13 8 7 7 1 13 13 13 1 6
10 IIM-Rohtak 7 5 9 9 5 5 1 13 13 2 8 8 7 7 5
11 IIM-S 9 7 7 7 1 9 12 3 3 3 9 4 3 12 1
12 IIM-T 10 11 3 3 2 11 13 1 1 6 11 11 11 2 2
13 IIM-U 11 13 1 1 3 12 10 4 4 10 10 12 12 3 4
XIII. CONCLUSION
Although there are several strategies such as citation analysis, indices, uncited publications, mapping the output outlined in number of studies, in this study a method thus derived giving due importance to number of papers and number of authors of the organization besides number of citation in calculating the Richness factor index and Reach Activity Index. The data thus obtained for calculation were from Scopus database and the RAI, URAI, UAI and RFI were calculated based on the Scopus data during the study period from 1965 to 2017. It seems the factors that has been identified that attributed for reach and richness of publications seems to be meaningful instead of taking citation alone has a criteria to predict the value of the paper.
REFERENCES
[1] Abramo, Glovanni and D'Angelo, Ciriaco Andrea, “How do you define and measure research productivity?”, Scientometrics, 101(2): 1129-1144, 2014.
[2] Ajiferuke, I, “Collaborative Co- efficient : A single measure of the degree of collaboration in research”, Scientometrics, 14(5-6), 421-433, 1988.
[3] Almind, Tomas C. & Ingwersen, Peter, “Informetric analyses on the world wide web: Methodological approaches to 'webometrics”, Journal of Documentation, 53: 404-426, 1997.
[4] Alonso, S., Cabrerizo, F., Herrera-Viedma, E. and Herrara, F, “hgindex: a new index to characterize the scientific output of researchers based on the h and g indices”, Scientometrics, 82: 391-400, 2010.
[5] Bathrinarayanan, AL and Tamizhchelvan, M. (2014), Indian Research output on MEMS literature using Scopus Database: A Scientometric study. Journal of Theoretical and Applied Information Technology, 67(1): 90-102
[6] Bornmann, L,“How are excellent (highly cited) papers defined in bibliometrics? A quantitative analysis of the literature”, Research Evaluation, 23(2):166-173, 2014.
[6] Callon, M, “The Sociology of an Actor-Network: The Case of the Electric Vehicle. In: Mapping the Dynamics of Science and Technology”, edited by M. Callon, J. Law, A. Rip. Macmillian, London, 1986.
[8] Cronin, B, “The Citation Process”, The Role and Significance of Citations in Scientific Communication, 103p. Taylor Graham, Oxford, 1984.
[9] Cronin, B, “Hyperauthorship: a postmodern perversion or evidence of a structural shift in scholarly communication practices?”, Journal of the American Society for Information Science and Technology Banner, 52(7) : 558-569, 2001.
[10] Dannenberg, A.L. et al., “Use of epidemiology in medical specialties: An examination by citation analysis”, American Journal of Epidemiology, 121 (1): 140–151, 1985.
[11] Devis, J.C & Gonzalez, J.G, “Scholarly Journal Article about the Asian Tiger Economics Authors : Journal and research fields 1986-2001” - Asian Pacific Economic Literature, 17(2): 15-61, 2003.
[12] Egghe, L, “Theory and practice of the g-index”, Scientometrics, 69(1): 131-152, 2006.
[13] Gangan Prathap, Rekha Mittal, “A performance index approach to library collection”, Performance Measurement and Metrics, 11(3): 259-265, 2010.
[14] He, Q, “Knowledge discovery through co-word analysis”, Library Trends, 48: 133-159, 1999.
[15] Hirsch, J.E, “An index to quantify an individual’s scientific research output” (available at http://www.pnas.org/content/pnas/102/46/16569.full.pdf), 2005.
[16] Javed, M, “Rawal Medical Journal – An Analysis of Citation Pattern”, Rawal Medical Journal, 33(2): 254-257, 2008. [17] Jin, B.H, “H index: an evaluation indicator proposed by scientist”, Science Focus, 1(1): 8-9, 2006.
[18] Jin, B.H., Liang, L., Rousseau, R. and Egghe, L, “The R- and AR-indices: Complementing the h-index”, Chinese Science Bulletin, 52(6): 855-863, 2007a.
[19] Jin, B.H, “The AR-index: complementing the h-index”, ISSI Newsletter, 3(1), 2007b.
[20] Karpagam, R, “Global research output of nanobiotechnology research: a Scientometircs study”, Current Science, 106(1490), 89: 1490-1499, 2014.
[21] Karpagam, R., Gopalakrishnan, S., Natarajan, M. and Babu Ramesh, B, “Mapping of nanoscience and nanotechnology research in India: a scientometric analysis, 1990–2009”, Scientometrics, 89: 501–522, 2011.
[22] Kosmulski, M, “"I" - a bibliometric index”. Forum Akademickie, 11: 31, 2006.
[23] Krishnamoorthy G., Ramakrishnan, J. & Devi, S, “Bibliometric analysis of literature on diabetes (1995-2004)”, Annals of Library and Information Studies, 56: 150-155, 2009.
[24] Lawani, S.M, “Quality Collaboration and citations in cancer research : A bibliometric study”. Ph.D Dissertation, Florida State University, 395p., 1980.
[25] Leydesdorff, L, “The Triple Helix as a Model for Innovation Studies : Conference Report”, Science & Public Policy, 25 (3): 195-203, 1997. http://www.leydesdorff.net/th2/spp.htm (accessed on 15-10-2018).
[26] Leydesdorff, L. “Alternatives to the journal impact factor: I3 and the top-10% (or top-25%?) of the most highly cited papers”,
Scientometrics, 92: 355-365, 2012.
[27] Moed, H.F., De Bruin, R.E. & Van Leeuwen, T.N., “New bibliometric tools for the assessment of national research performance: Database description, overview of indicators and first applications”, Scientometrics, 33 (3): 38-422, 1995.
[28] Persson, Olle, “Are highly cited paper are international? Scientometrics”, Scientometrics 83(2): 397-401, 2010.
[29] Peters, H. P. F., & van Raan, A. F. J, “Co-word based science maps of chemical engineering, by combined clustering and multidimensional scaling”, Research Policy, 22: 47–71, 1993a.
[30] Peters, H. P. F., & van Raan, A. F. J, “Co-word based science maps of chemical engineering, Part I: Representations by direct multidimensional scaling”, Research Policy, 22: 23–45, 1993b.
[31] Prathap Gangan, “The fractional and harmonic p-indices for multiple authorship”, Scientometrics, 86(2): 239-244, 2011.
[32] Rahman, M., Haque, T.L., & Fukui, T, “Research articles published in clinical radiology journals: Trend of contribution from different countries”, Academic Radiology, 12(7): 825-829, 2005.
[33] Rajendiran, P, Ramesh Babu B and Gopalakrishnan, S, “Bibliometric Analysis of “Fiber Optics literature”, Annals of Library and Information Studies, 52 (3): 82-85, 2005.
[34] Rajendram, R., Lewison, G., & Preedy, V, “Worldwide alcohol-related research and the disease burden”, Alcohol and Alcoholism, 41(1): 99-106, 2006.
[35] Sidiropoulos, A., Katsaros, D. and Manolopoulos, Y, “Generalized hirsch h-index for disclosing latent facts in citation networks”. Scientometrics, 72(2): 253–280, 2007.
[36] Subramanyam, K, “Bibliometric studies of research in collaboration: a review”, Journal of Information Science, 6(1): 33-38, 1983.
[37] Tamizhchelvan, M and Gopalakrishnan, S, “Measure the Reach of Scientific Publications: A Scientometric Study”, International Journal of Research in Library Science, 4(2), 2018a.
[38] Tamizhchelvan, M and Gopalakrishnan, S, “Measuring Richness of the Research Output: A Scientometric Method”, Journal of Advances in Library and Information Science, 7(3) p. 212-226, 2018b.
[39] Van Noorden R., Maher, B and Nuzzo, R, “The top 100 papers”, Nature. 2014 Oct 30;514 (7524) : 550-3, 2014.
[40] van Raan, Anthony F. J, “For Your Citations Only? Hot Topics in Bibliometric Analysis, Measurement: Interdisciplinary Research and Perspectives, 3(1): 50-62, 2005.
[41] Viswanathan, V and Tamizhchelvan, M. (2014) Bibliometric Analysis on Growth of Literature on Spacecraft During 2009-2013: A Scopus
Database Study, International Journal of Information Retrieval and Management, 2(4): 15-18
ANNEXURE – I
Measure of Reach
Chelvan and Gopal formula for Measure of Reach as stated below has been used in this study.
Measures of reach of scientific output were made using Reach Percentage (RP); Reach Activity Index (RAI); Unreach/Reach Activity Index (URAI) and Unreach Activity Index (UAI). The method of calculation were as follows
1. Reach % = Reach output of Institution/ Total output of the institution
. . . (1)
2. Reach Activity index
The formula reads as follows:
RAI = … (2)
Where, Rij= Number of Reached / Cited publications for the particular Institutions a particular country Tio= Total publications for the particular Institution
Roj= Number of Reached / Cited publications of all the Institutions Too = Total publications of all the Institutions
3. URAI = Unreach/Reach Activity Index
The formula reads as follows:
URAI = … (3)
Where, Rij= Number of Reached / Cited publications for the particular Institution / a particular country Uio= Total Unreached / Uncited publications for the particular Institution
Roj= Number of Reached / cited publications of all the Institutions Uoo = Total Unreached / uncited of all the Institutions
4. UAI = Unreach Activity Index
The formula reads as follows:
UAI = … (4)
Where, Uij= Number of Unreached / uncited publications for the particular Institution / a particular country Tio= Total publications for the particular Institution
Uoj= Number of Unreached / uncited publications of all the Institutions Too = Total publications of all the Institutions
ANNEXURE – II
Richness Factor Index (RFI)
Chelvan and Gopal formula for Richness Factor Index (RFI), stated below, has been used in this
analysis.
Richness Factor Index (RFI) = No. of citations/no. of authors*age of the paper
The RFI can be
for a paper
for a organization
for a year
for an author
1. Richness Factor Index for a paper
RFI Paper = …. (5) Tot author * AoP
where RFI Paper = Richness Factor Index of paper Cit Paper = No. of Citations of a paper Tot author = Total No. of authors of a paper AoP = Age of a paper
Age of a paper can be calculated as follows
AoP = (Base year of the study – Paper published year) + 1 Eg. Let Base year may be 2018
Paper publication year may be 2017 Therefore AoP = (2018-2017) + 1 = 1+1 = 2
2. Richness Factor Index for an Organization
Cit Org
RFI Org = …. (6)
Tot author * NoP
where RFI Org = Richness Factor Index for an organisation Cit Org = No. of Citations of an organisation Tot author = Total No. of authors of a paper NoP = Number of papers
3. Richness Factor Index for a year
Cit Year
RFI Year = …. (7)
Tot author * AoP
where RFIYear = Richness Factor Index of year CitYear = No. of Citations of a Year Totauthor = Total No. of authors of a year AoY = Age of a year
Age of a Year can be calculated as follows
AoY = (Current Year – Year of Publication of the paper) + 1 Eg. Let Year of publication of the paper = 2014
Current year = 2018
Therefore AoY = (2018 -2014)+1 = 4+1 = 5
4. Richness Factor Index for an author
Cit author
RFI author = …. (8)
Tot paper *Tot authors* PoP
where RFIauthor = Richness Factor Index of an author Citauthor = Total Citations of a author Totpaper = Total No. of paper by an author
Totauthor = Total No. of collaborated authors PoP = Period of Publish
Period of Publish can be calculated as follows
PoP = (Last paper published year – First published Paper year) + 1 Eg. Let first published paper year 2002
Last published Paper year may be 2018