Survey on Illumination Based Digital Image Forgery
Detection Techniques
1
Mahalakshmy A,
2Jayakumar T.V
1M.Tech Student, 2Assistant Professor1Department of Computer Science,
Vidya Academy of Science and Technology, Kerala, India
Abstract—This paper surveys the literature on illumination based digital image forgery detection techniques. With the
development of advanced digital image processing techniques, it has been so easy to manipulate images, and therefore forge new realities. So we need an effective approach to distinguish between real and fake images. In this paper, we introduce some methods of digital image forgery detection, mainly including detection based on inconsistencies in lighting, inconsistencies in lighting model, inconsistencies in reflections, specular highlights on the eye and inconsistencies in illumination color. The goal of this paper is to provide a review of the existing literature available on illumination based digital image forgery detection techniques.
Index Terms—Digital Tampering, illuminant color, illuminant map, image forensics, machine learning.
________________________________________________________________________________________________________
I.INTRODUCTION
Digital photographs are considered as evidence in many crime cases. However, with the advance in image editing softwares like Photoshop, Paintshop etc, one can easily manipulate the photographs. Image manipulation can be done for various reasons such as entertainment, fun, education etc. However, recently image manipulations are used to alter the meaning of the picture for illegal purposes. As a result, authenticity of photographs is highly reduced. So it is necessary to devise an effective approach to detect image forgeries to restore the trust in digital images.
Generally, there are two approaches for image forgery detection: active and passive detection. In active approach, the digital image requires some preprocessing such as watermark embedding or signature generation, which would limit their application in practice. To overcome these problems, passive techniques are evolved which does not need any digital signature to be generated or to embed any watermark in advance. These techniques are based on the assumption that they may alter the underlying statistics of an image, although digital forgeries may leave no visual clues that indicate tampering. Image forensic tools can be roughly grouped into five categories:
1. Pixel-based techniques that detect statistical anomalies introduced at the pixel level.
2. Format-based techniques that provide the statistical correlations introduced by a specific lossy compression scheme. 3. Camera-based techniques that exploit artifacts introduced by the camera lens, sensor, or on-chip postprocessing.
4. Physically based techniques that explicitly model and detect anomalies in the three-dimensional interaction between physical objects, light, and the camera.
5. Geometric-based techniques that make measurements of objects in the world and their positions relative to the camera. This paper surveys the different illumination based digital image forgery detection techniques. Illumination based methods for forgery detection are either geometry based or color based. Geometry based methods focus at detecting inconsistencies in light source positions between specific objects in the scene. Color based methods search for inconsistencies in the interactions between object color and light color. In the following section, different methods for forgery detection are presented.
II.INCONSISTENCIES IN LIGHTING
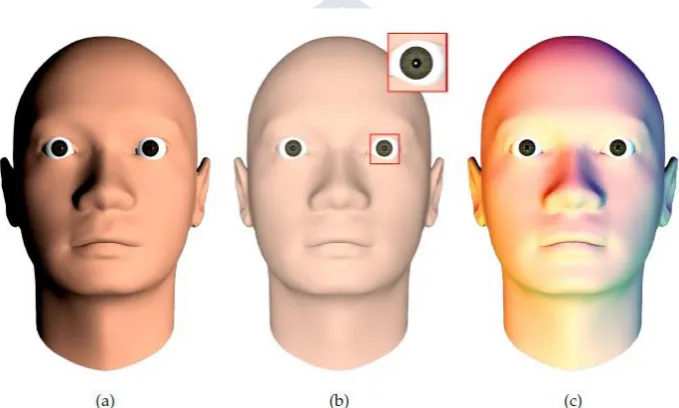
When creating a digital composite, it is very difficult to match the lighting conditions from the individual photographs. Therefore lighting inconsistencies can be used as a tool for revealing digital forgeries. M. Johnson and H. Farid proposed a technique for estimating the direction (within one degree of freedom) of an illuminating light source. Because the right side of the face in fig 1(a) is more illuminated than the left, we can infer that a light source is positioned to the right. This observation can be formalized by making simplifying assumptions: the amount of light striking a surface is proportional to the surface normal and the direction to a single light source. With knowledge of 3-D surface normals, the direction to the light source can therefore be estimated [2].Because 3-D surface normals usually cannot be determined from a single image, the authors in [1] consider only the 2-D surface normals at the occluding object boundary. In return, they estimate two of the three components of the light source direction. Although there remains an ambiguity in the estimated light direction, these two components of light direction are still useful in a forensic setting.
considered to have unit-value. At the occluding boundary of a surface, the z-component of the surface normal is zero.In addition, the x- and y- components of the surface normal can be estimated directly from the image. In this case, the z-component of both the surface normal and light direction are ignored. With at least three points with the same reflectance, R, and distinct surface normals, N , the light source direction and ambient term can be solved for using standard least-squares estimation. Then quadratic error function is minimized using standard least-squares estimation to yield v = (MTM)-1 MTb. This process can be repeated for different objects or people in the image to verify that the lighting is consistent.
In this method, the original color (RGB) image is converted to grayscale from which the intensity measurements were made. The light direction estimation requires the localization of an occluding boundary. These boundaries are extracted by manually selecting points in the image along an occluding boundary. This rough estimate of the position of the boundary is used to define its spatial extent. The boundary is then partitioned into approximately eight small patches. Three points near the occluding boundary are manually selected for each patch, and fit with a quadratic curve. The surface normals along each patch are then estimated analytically from the resulting quadratic fit. The intensity from the occluding boundary cannot be directly measured from the image as the surface is occluded. The authors in [2] note that simply using the intensity close to the border is often sufficient. The authors also found that under certain conditions it was advantageous to extrapolate the intensity by considering the intensity profile along a ray coincident to the 2-D surface normal. For objects of constant reflectance across the entire object, the extrapolation method is desirable, as it yields more accurate intensity estimates. The drawback is that there is an ambiguity in the estimation of third component of light source direction.
Fig. 1: The direction to a single light source can be determined from (a) the lighting gradient across the face, or (b) the position of the specularity (white dot) on the eye. More complex lighting environments consisting of multiple colored lights (c) can be modeled as piecewise continuous functions on the sphere.
III.SPECULAR HIGHLIGHTS ON THE EYE
When creating a digital composite of two people, it is difficult to exactly match the lighting conditions under which each individual was originally photographed. In many situations, the light source in a scene gives rise to a specular highlight on the eyes. Johnson and Farid [5] also proposed spliced image detection by exploiting specular highlights in the eyes. In this method, the location of a specular highlight is used to determine the direction to the light source. Inconsistencies in the estimates from different eyes, as well as differences in the shape and color of the highlights, can be used to reveal traces of digital tampering. The estimation of light source direction in the previous section was limited to 2-D because it is usually difficult to determine 3-D surface normals from a single image. In [5], the authors describe how to estimate the 3-D direction to a light source from the lights reflection in the human eye, figure 1(b).The required 3-D surface normals are determined by leveraging a 3-D model of the human eye. Although not specifically developed for a forensic setting, the authors described a technique for computing an environment map from eyes that embodies the illumination in the scene. While the environment map provides a rich source of information about the lighting, it has the drawback of requiring a relatively high-resolution image of the eye. The position of a specular highlight is determined by the relative positions of the light source, the reflective surface and the viewer (or camera).
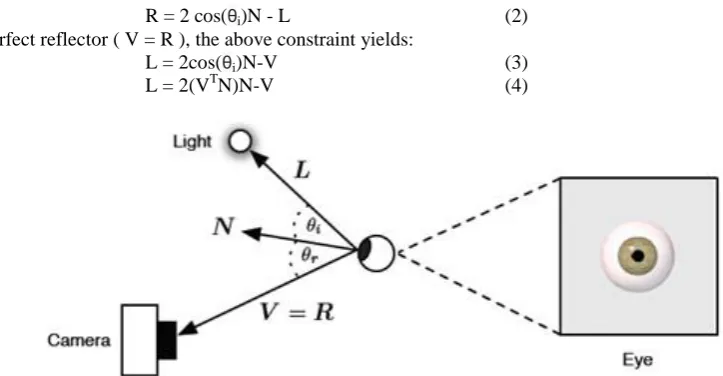
The position of a specular highlight is determined by the relative positions of the light source, the reflective surface and the viewer (or camera). In fig 2, for example, is a diagram showing the creation of a specular highlight on an eye. In this diagram, the three vectors L , N and R correspond to the direction to the light, the surface normal at the point at which the highlight is formed, and the direction in which the highlight will be seen. For a perfect reflector, the highlight is seen only when the view direction V = R . For an imperfect reflector, a specular highlight can be seen for viewing directions V near R , with the strongest highlight seen when V = R. The authors derived an algebraic relationship between the vectors L , N , and V and then showed that how the 3-D vectors N and V can be estimated from a single image, from which the direction to the light source L is determined. The law of reflection states that a light ray reflects off of a surface at an angle of reflection θr equal to the angle of incidence θi, where these angles are measured with respect to the surface normal N. Assuming unit-length vectors, the direction of the reflected ray R can be described in terms of the light direction L and the surface normal N :
R = 2 cos(θi)N - L (2) By assuming a perfect reflector ( V = R ), the above constraint yields:
L = 2cos(θi)N-V (3)
L = 2(VTN)N-V (4)
Fig 2: The formation of a specular highlight on an eye (small white dot on the iris). The position of the highlight is determined by the surface normal N and the relative directions to the light source L and viewer V.
The light direction L can therefore be estimated from the surface normal N and view direction V at a specular highlight. Note that the light direction is specified with respect to the eye, and not the camera. In practice, all of these vectors will be placed in a common coordinate system, allowing us to compare light directions across the image.
When creating a composite of two or more people it is often difficult to match the lighting conditions under which each person was originally photographed. Specular highlights that appear on the eye are a powerful cue as to the shape, color and location of the light source(s). Inconsistencies in these properties of the light can be used as evidence of tampering. 3-D direction to a light source was measured from the position of the highlight on the eye. While the authors are not specifically focused on it, the shape and color of a highlight are relatively easy to quantify and measure and should also prove helpful in exposing digital forgeries. Since specular highlights tend to be relatively small on the eye, it is possible to manipulate them to conceal traces of tampering. To do so, the shape, color and location of the highlight would have to be constructed so as to be globally consistent with the lighting in other parts of the image. The main drawback of this approach is that peoples eyes must be visible and available in high resolution.
IV.COMPLEX LIGHTING ENVIRONMENTS
In the previous two sections a simplified lighting model consisting of a single dominant light source was assumed. When creating a spliced image from multiple images, it is often difficult to exactly match the lighting conditions. The previous method is used to estimate the direction to a light source and digital image forgery was detected based on the inconsistencies in the illuminant direction. In practice, however, the lighting of a scene can be complex any number of lights can be placed in any number of positions, creating different lighting environments, figure 1(c). In [3], the authors describe how to estimate a low-parameter representation of such complex lighting environments.
This method is based on the assumption that the lighting is distant and that surfaces in the scene are convex and Lambertian. To use this model in a forensic area, assume that the surface reflectance is constant and the camera response is linear. In this method, first represent the lighting environment as a non-negative function on the sphere. If the object being illuminated is convex, the irradiance (light received) at any point on the surface is due to only the lighting environment; i.e., there are no cast shadows or interreflections. As a result, the irradiance can be parametrized by the unit length surface normal. It can be written as a convolution of the reflectance function of the surface, with the lighting environment. Irradiance describes the total amount of light reaching a point on a surface. For a Lambertian surface, the reflected light, or radiosity, is proportional to the irradiance by a reflectance term . In addition, Lambertian surfaces emit light uniformly in all directions, so the amount of light received by a viewer (i.e., camera) is independent of the view direction. The camera maps its received light to intensity through a camera response function. For simplicity, assume a linear camera response, and thus the intensity is related to the irradiance by an unknown multiplicative factor, which is assumed to have unit value. This assumption implies that the lighting coefficients can only be estimated to within an unknown scale factor.
Then lighting environment coefficients can be estimated using standard leastsquares estimation. This solution only provides five of the nine lighting environment coefficients. The estimated coefficient vector is a low-order approximation of the lighting environment. Based on these coefficients, lighting environments are differentiated for forensics purposes. Intuitively, coefficients from objects in different lighting environments should be distinguishable, while coefficients from objects in the same lighting environment should be similar. In addition, measurable differences in sets of coefficients should be mostly due to differences in the lighting environment and not to other factors such as object color or image exposure. Taking these issues into consideration, an error measure is computed between two estimated lighting environments. Let v1 and v2 be two vectors of lighting environment coefficients. From these coefficients, the irradiance profile along a circle (2-D) or a sphere (3-D) is synthesized, from which the error is computed.
assumptions (distant light sources and diffuse surfaces), arbitrary lighting environments can be modeled with a 9-dimensional model. This model approximates the lighting with a linear combination of spherical harmonics. The authors shown that how to approximate a simplified 5-dimensional version of this model from a single image, and how to stabilize the model estimation in the presence of noise. Inconsistencies in the lighting model across an image are then used as evidence of tampering.
V.INCONSISTENT REFLECTIONS SCENE ILLUMINATION
The advent of sophisticated photo editing software has made it increasingly easier to manipulate digital images. Often visual inspection cannot definitively distinguish the resulting forgeries from authentic photographs. In response, forensic techniques have emerged to detect geometric or statistical inconsistencies that result from specific forms of photo manipulation. J. F. OBrien and H. Farid [4] proposed a new forensic technique that focuses on geometric inconsistencies that arise when fake reflections are inserted into a photograph or when a photograph containing reflections is manipulated. This analysis employs basic rules of reflective geometry and linear perspective projection, makes minimal assumptions about the scene geometry, and only requires the user to identify corresponding points on an object and its reflection. The analysis is also insensitive to common image editing operations such as resampling, color manipulations, and lossy.
The authors focus on geometric inconsistencies that arise when fake reflections are inserted into a photo or when a photo containing reflections is manipulated. Prior work addressed this issue but required an explicit estimate of the reflecting surfaces three-dimensional normal. By contrast, the imaged-based construction does not require a prior estimate of a surface normal and does not make any assumptions about the reflecting surface other than that it is flat. They also described how noisy estimates of the images center of projection can be used to identify faked images containing rectangular reflectors. An additional feature of this methods is that, unlike some other forensic techniques, they are insensitive to common operations such as resampling, color manipulations, and lossy compression. This method will only be applicable to images containing reflections, but this type of limitation is typical of photo forensic techniques that are designed to detect specific forms of manipulation. Note that while a photo may be proven fake by detecting a statistical, lighting, or geometric inconsistency, the lack of any such inconsistency does not prove that a photo is authentic. Failure to detect an inconsistency only proves that it is either authentic or a very good fake.
VI.SCENE ILLUMINATION INCONSISTENCIES IN ILLUMINATION COLOR
The goal of blind image forensics is to distinguish original and manipulated images. C. Riess and E. Angelopoulou [6] proposed illumination color as a new indicator for the assessment of image authenticity. Many images exhibit a combination of multiple illuminants (flash photography, mixture of indoor and outdoor lighting, etc.). In the proposed method, the user selects illuminated areas for further investigation. The illuminant colors are locally estimated, effectively decomposing the scene in a map of differently illuminated regions. Inconsistencies in such a map suggest possible image tampering. Our method is physics-based, which implies that the outcome of the estimation can be further constrained if additional knowledge on the scene is available. Experiments show that these illumination maps provide a useful and very general forensics tool for the analysis of color images.
The authors present a system for the assessment of the illuminant color consistency over the image. The method involves the following steps.
1. The image is segmented in regions of approximately the same object color. These segments are called superpixels. A superpixel is required to a) be directly illuminated by the light sources under examination and b) roughly adhere to the physical model presented.
2. A user selects such superpixels whose incident illuminant he wants to fur ther investigate. Every group of superpixels represents one illuminant color under investigation.
3. Estimation of the illuminant color is performed twice. First, the estimation is done on every superpixel separately. Second, the estimation is done on the user-selected superpixel groups for greater robustness.
4. The user-selected groups form the reference illuminants. A distance measure from these illuminants to every superpixel estimate is computed. These persuperpixel distances in a distance map is used to support the analysis of the illumination color consistency.
In special cases, this method can be fully automated. On the other hand, since the estimation of the illuminant color is an underconstrained problem, there will always exist scenes that cannot be correctly processed. So a limited degree of human interaction is a valid tradeoff between the accuracy of the method and its usability.
6.1 Estimation of Illuminant Color –Inverse Intensity Chromaticity Space
It is based on dichromatic reflectance model, which states that the amount of light reflected from a point, x, of a dielectric, non-uniform material is a linear combination of diffuse reflection and specular reflection. Further assumptions are that the color of the specularities approximates the color of the illuminant, and that the camera response is linear. Tan et al.showed, that there exists a linear relationship between diffuse, specular and image chromaticities.
c (x) = pc (x) c(x) (5)
pc (x) = md(x) (Λc(x) - c(x)) (6)
c be the image chromaticity, pc (x) is the slope of a line with intercept c(x) , i.e. the specular chromaticity,which is also the
illuminant chromaticity. The domain of the line is determined by and the range is given by 0 ≤ c ≤ 1. Domain and range together
6.2 Local Analysis of Pixel Distributions
On real-world images, the automatic extraction of highly specular pixels is a very challenging task with unreliable performance . Furthermore, the basic method does not handle cases with multiple light sources. The authors analyzed and extended the exploitation of pixel distributions in IIC space, so that it can overcome these two weaknesses. In order to avoid specularity segmentation, they perform simple shape checks on the pixel distributions in IIC space in order to identify specular regions. Instead of examining the entire pixel distribution, they perform the analysis over small connected image regions of roughly uniform object color. Depending on the outcome of shape analysis, either this local region is used to obtain an illuminant estimate, or reject it if it does not seem to fulfill the underlying assumptions of the proposed model. Using local regions allows us to incorporate multiple sampling and voting in the estimation of local illuminants. Ultimately, this improved exploitation of the IIC space makes the method more robust to real-world analysis and also enables us to examine multiple illuminants. More specifically, the proposed algorithm works as follows.
1. For every dominant illuminant in the scene, select regions that a) follow the dichromatic reflectance model and b) are mostly lit by that light source.
2. Segment these regions in superpixels with roughly uniform chromaticity.
3. Further subdivide these superpixels in a rectangular grid. We call each such rectangular subregion a patch. 4. Transform every patch to inverse intensity space.
5. Apply tests on the shape of the patch’s pixel distribution. If the distribution passes, obtain a local illuminant color estimate for this patch.
6. Obtain a color estimate for each dominant illuminant, based on a majority vote on local estimates of the user-selected regions.
6.3 Detecting Inconsistencies in Illumination
The same process (see Section 6.1) that was used in computing the illuminant color estimates at the user-specified regions is now extended to the entire image. The voting, however, is now performed for every superpixel. Thus, every superpixel contains an individual illuminant estimate. Then store these illuminant estimates in a new image, where each superpixel is colored according to its estimated illuminant color γ1(x). Resultant new image is called illumination map. This map gives already quite meaningful results for the analysis. For forensic analysis, they aim to quantify the relationship between the illuminant estimates. In a scene with truly one dominant illuminant, this can be done by comparing the angular errors of the individual illuminant estimates. However, most real-world scenes contain a mixture of illuminants. Their influence on the scene is closely connected to the positions of the objects relative to the positions of the light sources. Since the geometric composition of the scene is typically unknown, they resort to developing a tool for supporting the visual assessment of the scene, which is known as distance map.
The distance map captures how well the illuminant estimation at each superpixel fits to the estimated dominant illuminants. For improved clarity, assume that two dominant illuminants I1 and I2 that were obtained from two user-selected regions. The methodology can however easily generalize to more illumination sources. So first create a grayscale-image that depicts the relative influence of both light sources. The distance map is created by assigning the value 0 (black) to the user-defined region corresponding to illuminant I1. Similarly, the second userdefined region, which gave rise to dominant illuminant I2, is assigned the value 1 (white). Then, for all the remaining pixels, the distance value Id(x) is computed as
Id(x) = (γ1(x) - I1) o (I2 - I1) (7)
where o denotes scalar multiplication. The distance map is then a grayscale image with values in the range [0; 1]. Such a map captures the relative influence of both light sources in this pixel. The illumination map and the distance map are used together for the analysis of the image. In order to be consistent, a local illuminant estimate in an image must a) either exhibit a relative illuminant contribution that fits in the spatial layout of the scene or b) fail to fulfill the underlying physical model. In the latter case, it must be ignored for the analysis.
VII. INCONSISTENCIES IN ILLUMINATION COLOR CONCLUSION
The authors [8] proposed a forgery detection method that exploits subtle inconsistencies in the color of the illumination of images. This approach is machine learning based and requires minimal user interaction. The technique is applicable to images containing two or more people and requires no expert interaction for the tampering decision. To achieve this, they incorporate information from physics and statistical-based illuminant estimators on image regions of similar material. From these illuminant estimates, texture- and edge-based features are extracted which are then provided to a machine-learning approach for automatic decision making.The classification performance using an SVM meta-fusion classifier is promising. It yields detection rates of 86% on a new benchmark dataset consisting of 200 images, and 83% on 50 images that were collected from the Internet. The method consists of five main steps and are given below.
7.1 Dense Local Illuminant Estimation (IE)
Generalized Gray World Estimates :
The classical gray world assumption states that the average color of a scene is gray. Thus, a deviation of the average of the image intensities from the expected gray color is due to the illuminant. Although this assumption is nowadays considered to be overly simplified, it has inspired the further design of statistical descriptors for color constancy. The generalized gray world approach was used to estimate the illuminant color.
7.1 Face Extraction
This is the only step that may require human interaction. An operator sets a bounding box around each face (e. g., by clicking on two corners of the bounding box) in the image that should be investigated. Alternatively, an automated face detector can be employed. We then crop every bounding box out of each illuminant map, so that only the illuminant estimates of the face regions remain.
7.2 Computation of Illuminant Features
For all face regions, texture-based and gradient-based features are computed on the IM values. Each one of them encodes complementary information for classification. Statistical Analysis of Structural Information (SASI) descriptor is used to extract texture information from illuminant maps. It captures small granularities and discontinuities in texture patterns. It is a generic descriptor that measures the structural properties of textures. It is based on the autocorrelation of horizontal, vertical and diagonal pixel lines over an image at different scales. Instead of computing the autocorrelation for every possible shift, only a small number of shifts is considered. One autocorrelation is computed using a specific fixed orientation, scale, and shift. Computing the mean and standard deviation of all such pixel values yields two feature dimensions. Repeating this computation for varying orientations, scales and shifts yields a 128-dimensional feature vector. As a final step, this vector is normalized by subtracting its mean value, and dividing it by its standard deviation.
Differing illuminant estimates in neighboring segments can lead to discontinuities in the illuminant map. Dissimilar illuminant estimates can occur for a number of reasons: changing geometry, changing material, noise, retouching or changes in the incident light. Thus, one can interpret an illuminant estimate as a low-level descriptor of the underlying image statistics. The authors observed that the edges, e. g., computed by a Canny edge detector, detect in several cases a combination of the segment borders and isophotes (i. e., areas of similar incident light in the image). When an image is spliced, the statistics of these edges is likely to differ from original images. To characterize such edge discontinuities, a new feature descriptor called HOGedge was proposed. It is based on the well-known HOG-descriptor, and computes visual dictionaries of gradient intensities in edge points. We first extract approximately equally distributed candidate points on the edges of illuminant maps. At these points, HOG descriptors are computed. These descriptors are summarized in a visual words dictionary.
7.3 Paired Face Features
Our goal is to assess whether a pair of faces in an image is consistently illuminated. For an image with n faces, we construct (n(n-1)/2) joint feature vectors, consisting of all possible pairs of faces.
7.4 Classification
Then a machine learning approach is used to automatically classify the feature vectors. Then tag an image as a forgery if at least one pair of faces in the image is classified as inconsistently illuminated. The authors presented a new method for detecting forged images of people using the illuminant color. Illuminant color is estimated using a statistical gray edge method and a physics-based method which exploits the inverse intensity chromaticity color space. These illuminant maps are treated as texture maps. They extracted information on the distribution of edges on these maps. In order to describe the edge information, they proposed a new algorithm based on edge points and the HOG descriptor, called HOGedge. These complementary cues (texture and edge-based) are combined using machine learning late fusion.
VIII.CONCLUSION
In recent years, there is a significant improvement in the field of image forgery detection. But, in spite of this improvement and higher number of methods, we still can see a lot of drawbacks and imperfections of the existing methods. When applying the existing methods to real-life applications, the variety of image contents and characteristics cause considerably higher false positive rates (true images denoted as forgeries) than which are reported in the existing papers. Generally, the problem of false positives exists in all research fields and applications. But, image forensics mostly deals with the trustworthiness of photographs having an essential value (for instance, the trustworthiness of photographs as evidence in courtrooms). Therefore, in real-life applications, the problem of false positives can have catastrophical consequences.
difficult task of visually examining an illuminant map for evidence of tampering. Inconsistencies in illumination color method requires only a minimum amount of human interaction and provides a crisp statement on the authenticity of the image.
REFERENCES
[1] M. Johnson and H. Farid, “Exposing digital forgeries by detecting inconsistencies in lighting,” in ACM Workshop on Multimedia and Security, ACM, 2005, pp. 110.
[2] P. Nillius and J.-O. Eklundh, “Automatic estimation of the projected light source direction, ” In Proceedings of the IEEE Computer Society Conference on Computer Vision and Pattern Recognition, 2001.
[3] M. Johnson and H. Farid, “ Exposing Digital Forgeries in Complex Lighting Environments, ” PIEEE Transactions on Information Forensics and Security (TIFS),, vol. 3,no. 2, pp. 450461, 2007.
[4] J. F. OBrien and H. Farid, “ Exposing Photo Manipulation with Inconsistent Reflections, ”ACM Transactions on Graphics, vol. 31, no. 1, pp. 111, Jan. 2012.
[5] M. Johnson and H. Farid, “ Digital Forgeries through Specular Highlights on the Eye, ” in International Workshop on Information Hiding, 2007, pp. 311325.
[6] C. Riess and E. Angelopoulou, “ Scene Illumination as an Indicator of Image Manipulation, ” in Information Hiding, vol. 6387, 2010, pp. 6680.
[7] A. Gijsenij, R. Lu, and T. Gevers, “Color Constancy for Multiple Light Sources,” IEEE Transactions on Image Processing, pvol. 21, no. 2, pp. 697707, 2012.
[8] de Carvalho, T.J.; Riess, C.; Angelopoulou, E.; Pedrini, H.; de Rezende Rocha, A, “ Exposing Digital Image Forgeries by Illumination Color Classification, ” Information Forensics and Security, IEEE Transactions on, vol.8, no.7, pp.1182,1194, July 2013.
[9] Saboia, Priscila, Tiago Carvalho, and Anderson Rocha. , “ Eye specular highlights telltales for digital forensics: A machine learning approach., ” Image Processing (ICIP) 2011, 18th IEEE International Conference on. IEEE, 2011.
[10] Riess, Christian, and Elli Angelopoulou. , “Physics-based illuminant color estimation as an image semantics clue, ” Image Processing (ICIP), 2009 , 16th IEEE International Conference on. IEEE, 2009.
[11] Albregtsen, Fritz, A, “ Statistical texture measures computed from gray level coocurrence matrices, ” Image Processing Laboratory, Department of Informatics, University of Oslo (1995)1-14
[12] Kobayashi, Takuya, Akinori Hidaka, and Takio Kurita:. “ Selection of histograms of oriented gradients features for pedestrian detection., ” Neural Information Processing., Springer Berlin Heidelberg, 2008.
[13] M. Ebner, “Color Constancy using Local Color Shifts, ” in European Conference in Computer Vision, 2004, pp. 276287. [14] Wang, Wei, Jing Dong, and Tieniu Tan. , “Effective image splicing detection based on image chroma, ”Image Processing
(ICIP), 16th IEEE International Conference on. IEEE, 2009.
[15] W. Fan, K. Wang, F. Cayre, and Z. Xiong, “3d lighting-based image forgery detection using shape-from-shading, ” in European Signal Processing Conference (EUSIPCO), aug. 2012, pp. 1777 1781.
[16] R. Kawakami, K. Ikeuchi, and R. T. Tan, “Consistent Surface Color for Texturing Large Objects in Outdoor Scenes, ” in IEEE International Conference on Computer Vision, 2005, pp. 12001207.
[17] A. C arkacoglu and F. T. Yarman-Vural., “SASI: A Generic Texture Descriptor for Image Retrieval, ” Pattern Recognition, vol. 36, no. 11,pp. 26152633, 2003.
[18] M. Bleier, C. Riess, S. Beigpour, E. Eibenberger, E. Angelopoulou,T. Troger, and A. Kaup, “Color Constancy and Non-Uniform Illumination:Can Existing Algorithms Work? ,” in IEEE Color and Photometry in Computer Vision Workshop, 2011, pp. 774781.