Parametric study of vortex train generated by plasma actuator in
dependency on input voltage waveform
P. Procházka1 and V. Uruba1
1Academy of Sciences of the Czech Republic, Institute of Thermomechanics, Dolejškova 1402/5, 18200 Prague, Czech Republic
Abstract. This article is based on previous work of authors. The vortex train is created by a plasma DBD actuator after application of low-frequency amplitude modulation on high-frequency high-voltage carrier waveform. Data acquisition of flow field around actuators will be performed using time-resolved PIV measurement technique in plane parallel to flow and in cross-section. Phase-averaging will be used due to pseudo-periodical character of this process. The vortex behaviour dependency on modulation frequency, duty cycle, voltage value, electrode gap and other parameters will be shown. The generated flow patterns are to be applied for control of a boundary layer.
1 Introduction
Plasma DBD actuators belong to the relatively new group of active flow control devices. Although many research groups use them for active control of flow over profiles or bodies, there is only limited amount of articles dealing with basics physical principles acting during working cycle of DBD actuator. Plasma DBD actuator creates wall-jet-like flow that is far away from conventional synthetic wall-jet whether its origin or specific features. Detailed experimental study should precede practical application of effect to boundary layer control. In [1], conventional synthetic jet Reynolds number is defined as
(1)
where U0 is inlet velocity, b is height (or width) of inlet orifice (nozzle) and ν is kinematic viscosity. There is no inlet velocity and not at all orifice in DBD actuator geometry. Re number of plasma wall-jet was defined by authors so that U0 represents maximal velocity in velocity profile far from wire electrode and b is height of the jet at the same place. The boundary of the plasma jet is defined as 50% of maximal velocity value in velocity profile at the same place.
This article builds on previous work of authors. In [2], the authors showed that the flow field generated using plasma actuator has pseudo-periodical character. To be able to study periodical vortex structures versus amplitude modulated input voltage waveform is necessary to perform a phase-averaging of obtained flow
field data. Two distinct ways were tested. The first was phase-averaging using external clock timing of data acquisition in DynamicStudio. The other one was a computation of phases from main (energetic dominant) mode of BOD analysis. However BOD mode composition showed more sensitivity to changing input data. For each configurations of input voltage waveform, the most energetic dominant modes were always different in types, which required to define a threshold concerning in total kinetic energy (taken into account). The phase-averaging using external clock is quite time-consuming to data acquisition and processing, but on the other hand does not embody any subjective aspects and that is why it will be used for data processing in this parametric study.
The plasma actuator is supported by high-frequency high-voltage carrier voltage waveform where after application of low-frequency amplitude modulation [3] vortex train is created. It will be shown the vortex flow field behaviour (either for mean flow field or for instantaneous flow field) in dependency on amplitude modulation frequency, duty cycle of rectangular modulation, input peak voltage value and electrode gap. The position of maximal velocity of electric wind will be shown as well as a comparison of trajectories of different vortex train. Data acquisition of flow field around actuators was performed using time-resolved PIV measurement technique in plane parallel to the flow (streamwise).
C
2 Experimental setup
The plasma actuator geometry is almost the same as in previous study [2]. Constantan wire with diameter of 0,15 mm was replaced by a hot-wire-anemometry wire (wolfram) with diameter of only 40 µ m. Although body force did not rise, plasma discharge became more homogenous and stable. Silica glass platform of 150x150 mm is used as a dielectric that separates both electrodes. Because silica glass has excellent dielectric strength, it can be used platform with thickness of only 1 mm. A lower electrode, which is grounded, is very thin gold layer and is made by glazing. The upper electrode is moveable in some range so electrode gap can be set each time differently. Unless otherwise noted, the basic setting is two millimeters. Next, the upper electrode is powered by high-frequency high-voltage waveform. The voltage signal is superimposed from two distinct frequencies – the lower one is 16 kHz (is adjustable) and determines efficiency of energy conversion and the higher one is 90 kHz and is related with LC oscillator properties. Because of a thermal extension of upper electrode, a spiral torsion spring is used to keep straight shape, therefore the whole system wire – spring is initially preloaded. Due to existence of tightly defined straight edge of HW wire electrode, electrostatic field is more uniform and plasma discharge is more homogenous along spanwise direction of actuator. The whole actuator is at the bottom covered with 8 mm thick glass plate due to keep plasma only at the top side and thus one can enhance energy efficiency of device.
Low-frequency modulation of voltage waveform precipitates presence of vortex series so-called vortex train. Adjustable parameters (except electrode gap) are then duty cycle of rectangular modulation, frequency of amplitude modulation (AM) and peak voltage value. Notice that duty cycle of 30 % means that plasma discharge is 70 % of period on and the rest 30 % off. Measured frequencies are 5, 10, 15, 20, 25, 30, 35, 40, 50, 60, 70, 80 and 90 Hz with duty cycle of 30, 50 and 70 %. Detailed examination of duty cycle (after 10 %) was performed on the frequency 20 Hz. The influence of electrode gap was measured for case without amplitude modulation as well as influence of peak input voltage. Here is a need to mention that maximal achievable peak voltage for case without amplitude modulation is much smaller than for AM. The reason is simple – there is a capacitor that is periodically charging and discharging inside power source, which creates an addition in continuous voltage signal.
The power source of our actuator was developed and fabricated at Institute of Thermomechanics [4]. Control unit of power source allows to set magnitude of voltage. LabView interface ensures a control signal that defines parameters of amplitude modulation. The same control signal works as a timing for laser and camera (external clock). Consequently the actuator is fed by amplitude modulated high-voltage waveform from the power source. For a measurement of peak voltage value, the waveform is rectified by a rectifier and high voltage probe with division ration of 1000:1 is used.
The time-resolved PIV measurement technique was used to gain instantaneous velocity field. The measuring system DANTEC consists of laser with cylindrical optics and CMOS camera. Laser New Wave Pegasus Nd:YLF, double head, wavelength 527 nm, maximal frequency 10 kHz, a shot energy is 10 mJ for 1 kHz (corresponding power 2 x 10 W). Camera NanoSense MkIII, maximal resolution 1280 x 1024 pixels and corresponding maximal frequency 512 double-snaps per second. The camera internal memory 4 GB represents 1635 full resolution double-snaps. The maximal working frequency of the camera is limited by data rate, so it could be augmented by reducing its resolution. In this experiment reduced resolution with maximal possible frequency was used, 2407 consecutive double-snaps were acquired and evaluated in DynamicStudio software version 3.20. As tracing particles a glycerol oil was applied.
Phase-averaging was performed in 20 phases in one period in almost all cases of amplitude modulation. However for higher frequencies (over 40 Hz) of AM, there was a need to sample only 10 phases per period due to limited trigger frequency of PIV. Since it was used sampling all phases per each periods, acquired data are in series resulting in need to reshape them (in Matlab) – 2400 sampled images was averaged over 120 periods to 20 phases.
Consequently in Matlab, calculation of mean flow field, vortex identification method (by vorticity, λ2, swirling strength, Q-criterion), vortex core trajectory, circulation of vortex, identification of maximal global and local velocity inside wall-jet and determination of jet height were computed. Some of most important and interesting features will be describe in the following chapter.
3
Results
Please notice that each plasma DBD actuators has own characteristics (voltage versus velocity, voltage versus current, el. gap versus velocity etc.) that are given by diverse geometry of electrodes and dielectric and by different used materials. These characteristics help to tune given actuator to best efficiency.
Fig. 1. Mean flow field by 10Hz and 30%.
Fig. 2. Mean flow field by 70Hz and 50%.
Figure 3 shows a development of maximal velocity in mean jet depending on electrode gap. After setting of electrode gap more than 5 mm plasma region cannot extend and discharge afterwards becomes non-uniform and disappears. On the other hand there are some limits in overlap of electrodes when more than -4 mm resulting in rapid velocity decrease. Optimal range is between 4 to -4 mm. Our geometry is set default to 2 mm when velocities in jet are sufficient and plasma disposes very good stability.
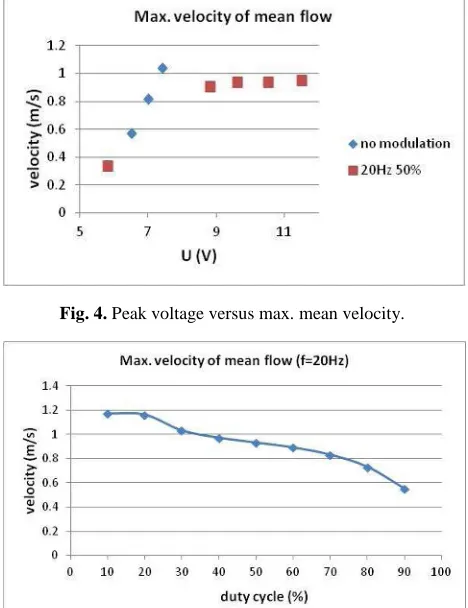
Fig. 3. Electrode gap versus max. mean velocity. How plasma electric wind is modifying by applied voltage magnitude shows figure 4. One can see how maximal velocity is rising linearly with applied voltage in case without modulation. For the case of AM with parameters 20 Hz/50 % the velocity is rising very slowly from a distinct voltage value, which is related whit total efficiency of energy conversion.
Evidently there is a clear depending on duty cycle to maximal velocity in wall-jet as illustrate figure 5. The longer time of plasma discharge, the bigger velocity of electric wind is present. At figure 5 can be seen how the
Fig. 4. Peak voltage versus max. mean velocity.
Fig. 5. Duty cycle versus max. mean velocity.
velocity is decreasing with DC to a half its original value. The increase of wall height is related with this effect. The shorter time of plasma discharge, the bigger jet height.
There is a dependency of maximal velocity on changing frequency of amplitude modulation at figure 6. The most powerful frequencies start on 40Hz where is a rapid step of increase for all three duty cycles. The effect of frequencies fades by 80 Hz when plasma discharge start to be similar to continuously discharge without modulation and that is probably why the body force of wall-jet becomes weaker. Of course duty cycle of 30% is most dominant in term of maximal velocity accordingly figure 5.
Fig. 6. AM frequency versus max. mean velocity.
Fig. 7. 6th phase of one vortex period; vorticity distribution.
cycle. During relaxation time, there is present no electric wind and vortex structures develop individually. However, for lower frequencies of modulation, the vortex is not fed during all working cycle. The vortex breaks down before then working cycle ends so then there is only wall-jet disturbed by velocities of previously perished vortex until working cycle ends. For example, the cases 10 Hz and 30 % or 10 Hz and 70 % are almost the same concerning vortex development.
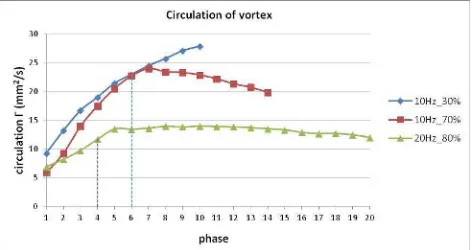
A comparison of three different configurations could be seen in figure 8. The smallest circulation of the vortex has vortex generated by 20 Hz and DC of 80 %. So it is clear the higher frequency of modulation, the higher frequency of vortex shedding as well as the smaller diameter of vortices (and smaller circulation). On the contrary, vortices generated by 10 Hz have much bigger circulation in all phases of its life. Besides duty cycle of 30 % gives a rise of circulation for all phases compare to 70 %. Dotted lines show the end of working cycle for 10 Hz/70 % and 20 Hz/80 %. It can be seen that vortex is fed by a distinct inertia because vortex strengthen occurs still after working cycle. Then the vortex develops with slowly decreasing tend.
Fig. 8. Circulation of vortex versus phases of period.
Finally figure 9 shows a trajectory of vortex core. By comparison one can find that each vortex train trajectories form a different angle with horizontal. The vortex excited by 10 Hz/30 % forms an angle of 16° with horizontal and same frequency but DC of 30 % forms an angle of 22°. This phenomenon is caused because velocities inside wall-jet are smaller for 70 % thus the wall-jet is formed into bigger height. Also these vortices
Fig. 9. Vortex core trajectory by 20 Hz/80 %.
are not so close to surface and can influence larger area. Vortices generated by 20 Hz/80 % form angle of 20° and last example is 60 Hz with DC of 30 % where vortex train trajectory is very flat, but anyway at the beginning of trajectory forms small angle of 9°. There are corresponding Reynolds numbers based on definition given in first chapter in table 1.
Table 1. Reynolds number of wall-jet.
Configuration Re
10Hz_30% 697
10Hz_70% 708
20Hz_80% 602
60Hz_30% 808
4 Conclusion
The flow field around plasma actuator fed by amplitude modulated voltage was investigated to better understand basic physical principles acting during working cycle of the actuator. A few of many measured configuration was presented. Reynolds number of this unconventional wall-jet was defined. Vortical structures were evaluated through instantaneous snap-shots or through mean flow field. Vortex identification methods and circulation computation were accomplished. The results should be summarized in the following.
Position of maximal mean velocity is approximately the same for each configuration and is located 40 mm from wire electrode, downstream. The useable range of electrode gap alternates between -4 mm (overlap) to 4 mm. By this range, plasma actuator disposes the best efficiency. The dependency on used peak voltage is linear. The smaller value of duty cycle, the more powerful plasma body force is. To obtain maximal mean velocity, frequencies of amplitude modulation should be set around 50 Hz. Vortex core trajectory was studied using core vorticity. It can be found how the vortex is developing in time by vortex circulation.
Next research should bring more information about vortex life longer than one period as well as interaction between two vortices inside vortex train. A new vortex identification scheme must be developed for this purpose. This research is to be applied for sophisticated active flow control of a boundary layer over a profile.
Acknowledgements
The authors gratefully acknowledge financial support of the Grant Agency of the Czech Republic, No. 101/08/1112.
References
1. J. G. Eriksson, R. I. Karlsson, J. Persson,
Experiments in Fluids 25, 50-60 (1998)
2. P. Procházka, V. Uruba, Proceedings in Applied
Mathematics and Mechanics, (2012 – to be
published)
3. P. Procházka, V. Uruba, J. Šonský, Topical Problems
of Fluid Mechanics, 101-104 (2011)
4. P. Procházka, V. Uruba, J. Šonský, XXIX. Setkání
Kateder Mechaniky Tekutin a Termomechaniky,