Licensed under Creative Common Page 1
http://ijecm.co.uk/
ISSN 2348 0386
E-COMMERCE ADOPTION LEVELS AND APPLICATIONS
AMONG MANUFACTURING SMEs IN KENYA
Charles Yugi Tibbs
Department of Accounting and Finance, University of Kabianga, Kericho, Kenya [email protected]
Japheth Ondiek
Department of Accounting and Finance, University of Kabianga, Kericho, Kenya
Paul Gichuki Kingori
Department of Accounting and Finance, University of Kabianga, Kericho, Kenya
Alice Ngele Mwazuna
Department of Accounting and Finance, University of Kabianga, Kericho, Kenya
Abstract
This study examines the state of E-commerce adoption among the SMEs. The research design
was survey with study population comprising all registered manufacturing SMEs in clothing and
textile, machinery and metal products, chemical, food-processing, leather products, printing and
publishing with Kenya Industrial Estates (KIE) Nairobi. A sample size of 47 firms was selected
using probability sampling. The data was analyzed using descriptive statistics. The study found
out that 91.5% of the firms were small enterprises, 48.9% were run under sole proprietorship
while 57.4% employed managers. Also, 46.8% were between 6-10 years old. All the
respondents had formal education with 44.7%, 39.9% and 23.4 having attained tertiary training,
secondary and university education respectively. Majority of the firms (97.9%) were utilizing
mobile phones and 87.2% used fixed lines while 95.7%, 72.3% and 46.8% had computers,
internet connectivity and website respectively. For the use of computers and internet, 95.7%,
72.3% and 46.8% were using computers, had internet connectivity and website respectively.
Most SMEs have only implemented basic e-commerce applications such as email and simple
web sites resulting in level 1 and level 2 applications.
Licensed under Creative Common Page 2
INTRODUCTION
Among the studies that have focused on technology adoption, only few have been devoted to the adoption of E-commerce in SMEs, Grandon and Pearson (2004). It is generally accepted that SMEs play an important role in the economics of their countries. Although, there are many potential advantages, the adoption of E-commerce by SMEs remain limited since SMEs have different characteristics from large enterprises. It has been shown that the characteristics of SMEs include small management teams, strong owner influence, lack of staff in specialized areas like information technology, multi-functional management, limited control over their business environment, limited market share, lower employee turnover, reluctance to take risks and avoidance of sophisticated software or applications (Seyal and Rahman 2003). Due to these differences SMEs have slower technology adoption rate and more difficulties realizing technology benefit than large enterprises (Poon and Swatman, 1999).
E-Commerce Adoption Level
Studies have shown there are disparities in adoption rates between the different European Community member states (Allan, 2003). It is, therefore, apparent that countries throughout the world are at different stages of adoption and that the rate of adoption is influenced by local conditions and that there is still much work needed to achieve the desired results. In Kenya, it was found out that E-commerce application was limited to use of phones according to Matambalya and Wolf (2001) while, the use of computers stood at 71.8% and internet connectivity by SMEs stood at 52.2% (Esselaar, 2007). It was also established that 62% and 82% of small and medium enterprises respectively utilized e-mail while 14% of small enterprises and 37% of medium enterprises had website connections (Kashorda, 2009). It was concluded that the low uptake of E-commerce in Kenya may not be directly related to laws but limited to internal readiness and use of ICT. Baseline survey to be done to ascertain the exact level of E-commerce adoption was recommended.
Stages of E-commerce Adoption
Licensed under Creative Common Page 3
as technologies that are easier to adopt, or adoption ladder with stages model showing that most SMEs only see value at the bottom of the ladder (Levenburg, 2002).
Although the SMEs have adopted many types of E-commerce applications, they might be at different stages of adopting those applications in accordance with the level of complexity. Therefore, it is important to examine the state of E-commerce adoption among the SMEs. In order to study different stages of E-commerce adoption, a conceptual framework is needed. One of the earliest models with respect to the usage of E-commerce evaluated the value of the commercial websites from different parts of the world (Ho, 1997). In his study, usage of E-commerce was categorized into promotion of products and services, provision of data and information, and processing of business transactions.
Table 1: Stages of E-commerce adoption
Stages Descriptions
Promotion Promotion of products and services
Provision Online enquiry, technical information, FAQ and value-added links. Processing Online sales, online ordering and payments, order status enquiry,
links warehouse and links distributors.
Source: Lawson et al. (2003)
This model was then adapted and merged with the Internet Business Models, APT Strategies (1997) developed into a graphical model of E-commerce adoption which was labeled as Internet E-commerce Staged Model. This model was later developed further by Lawson (2003) but without much modification to study the adoption of E-commerce by SMEs in Australia. This model was termed as Model of Internet Commerce Adoption (MICA) and it basically describes the three stages of E-commerce adoption proposed by Ho (1997) (see Table 1).
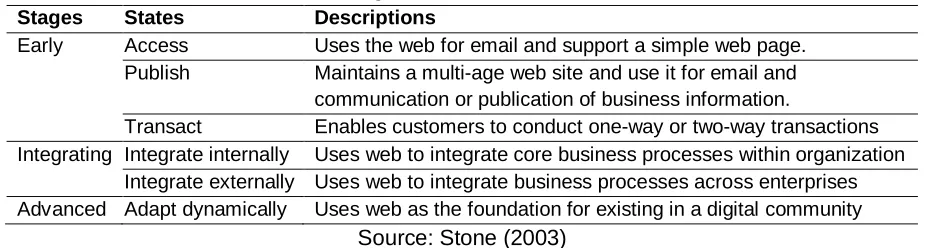
In addition, another adoption model known as the IBM model of stages and states by Stone (2003) categorizes E-commerce adoption into the early stage, the integrating stage and the advanced stage and these three stages again subdivided into six states (Table 2).
Table 2: Stages and states of E-commerce
Stages States Descriptions
Early Access Uses the web for email and support a simple web page. Publish Maintains a multi-age web site and use it for email and
communication or publication of business information.
Transact Enables customers to conduct one-way or two-way transactions Integrating Integrate internally Uses web to integrate core business processes within organization
Integrate externally Uses web to integrate business processes across enterprises Advanced Adapt dynamically Uses web as the foundation for existing in a digital community
Licensed under Creative Common Page 4
Tables 1 and Table 2 provide a comprehensive picture about the stages of E-commerce adoptions and a basis for the development of measures of E-commerce usage. However, due to the facts that the adoption of E-commerce among SMEs in Kenya is low, a simpler adoption model is needed. E-commerce applications have been classified into five categories namely; electronic marketing, electronic advertising, customer support services, order and delivery and online payment (Sulaiman, 2000). For this study same applications were considered.
RESEARCH METHODOLOGY
Research Design
The research was carried out through survey. This method was the most appropriate design for the study considering the distribution of manufacturing firms in various sectors. The method is relatively inexpensive as it allows for many questions to be asked about a particular factor giving considerable flexibility to the analysis. Standardized questions were used to make measurement more precise and ensure that similar data were collected from respondents.
Study Population
This research was carried out in KIE cluster of small and medium manufacturing firms. The population comprised all the registered Small and Medium (SM) manufacturing firms in clothing and textile, machinery and metal products, chemical processing, leather products, printing and publishing, motor vehicle, and carpentry and joinery at KIE Nairobi region. The Nairobi region has the highest number of SMEs clusters in the country with up to date register of all the enterprises. The register was useful when determining sample size.
Sample and sampling technique
The determination of sample size was through the approach based on the precision rate and confidence level and since the population was finite, the following Yamane sampling formula was used;
Where;
n = optimum sample size,
N = number of SMEs registered in the cluster area e = probability of error
Licensed under Creative Common Page 5
Data Collection
The data was collected using a questionnaire administered to the entrepreneurs (owner/manager) using the ‘drop and pick later’ method. The structured questionnaire had both
open and closed ended questions. The questionnaire was designed to cover: general information about the E-commerce adoption levels, factors affecting the adoption levels and benefits realized by adopting E-commerce.
ANALYSIS AND FINDINGS
Demographic Information
A total of 47 SMEs manufacturing firms in clothing and textile, machinery and metal products, chemical processing, leather products, printing and publishing, motor vehicle, and carpentry and joinery at KIE Nairobi region were surveyed. Majority of the firms, 43 (91.5%) were small sized while 4 (8.5%) were medium sized as shown in Table 3. A higher proportion of the firms 16 (34.0%) was in the printing sector while the smallest, 4 (8.5%) each were in the Textile and clothing, Motor vehicle and Leather products.
Table 3: Business sector
Sector Small (%) Medium (%) Total (%)
Textile and clothing 4 (9.3) 0 (0.0) 4 (8.5)
Chemical processing 5 (11.6) 0 (0.0) 5 (10.6)
Metal and machinery 7 (16.3) 1(25.0) 8 (17.0)
Printing 13 (30.2) 3 (75.0) 16 (34.0)
Motor vehicle 4 (9.3) 0 (0.0) 4 (8.5)
Leather products 4 (9.3) 0 (0.0) 4 (8.5)
Carpentry and joinery 6 (14.0) 0 (0.0) 6 (12.8)
Total 43 (91.5) 4 (8.5) 47 (100)
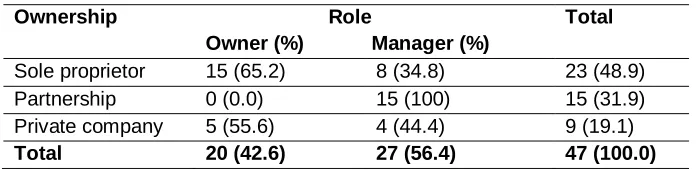
In terms of ownership, close to half of the firms, 23 (48.9) were under sole proprietorship while 15 (31.9%) and 9 (19.1%) were registered as partnership and private companies respectively as shown in Table 4. Also majority of them 27 (57.4%) are run by managers as oppose to 20 (42.6%) which were run by the owners.
Table 4: Business ownership Ownership Role
Owner (%) Manager (%)
Total
Sole proprietor 15 (65.2) 8 (34.8) 23 (48.9)
Partnership 0 (0.0) 15 (100) 15 (31.9)
Private company 5 (55.6) 4 (44.4) 9 (19.1)
Licensed under Creative Common Page 6
Majority of the businesses 45 (95.7%) were less than 20 years old. The highest proportion of them 22 (46.8%) were in the category of 6 – 10 years while the least 2 (4.3%) were both in the category of 16 – 20 years and over 20 years as shown in Table 5.
Table 5: Age of business
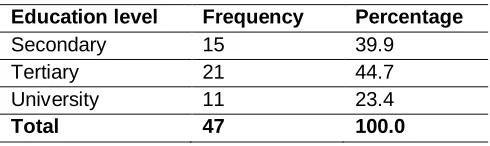
In terms of education level of the respondents, 15 (39.9%), 21 (44.7%) and 11 (23.4%) had secondary education, tertiary level training and university education respectively as shown in Table 6.
Table 6: Educational level of respondents
Electronic Commerce Applications
Majority of the firms were using E-commerce technology with 46 (97.9%) using mobile phones, 45 (95.7%) had computers and 41 (87.2%) had fixed line telephones. Also 34 (72.3%) and 22 (46.8%) had internet connection and website respectively as shown in Table 7.
Table 7: Electronic commerce technology
Table 8 shows E-commerce adoption level per sector. The highest proportion, 19 (40.4%) of the enterprises had adopted level 1 of E-commerce application while 13 (27.7%) had not adopted any level. The least number 4 (8.5%) had adopted level 3. About 39% of the firms which had not
Age (yrs) Frequency Percentage
0 – 5 17 36.7
6 – 10 22 46.8
11 – 15 4 8.5
16 - 20 2 4.3
Over 20 2 4.3
Total 47 100
Education level Frequency Percentage
Secondary 15 39.9
Tertiary 21 44.7
University 11 23.4
Total 47 100.0
Type of technology Yes No Total
Mobile phone 46 (97.9) 1 (2.1) 47
Fixed line 41 (87.2) 6 (12.8) 47
Computers 45 (95.7) 2 (4.3) 47
Internet connection 34 (72.3) 13 (27.7) 47
Licensed under Creative Common Page 7
adopted any level were in the metal and machinery and carpentry and joinery sectors. For the enterprises which had adopted E-commerce application, printing sector was leading with 6 (31.6%) in level 1, 7 (63.6%) in level 2 and 3 (75.0%) in level 3. chemical processing and Motor vehicle sectors had only adopted level 1 while textile and clothing and leather products had adopted up to level 2 of E-commerce application.
Table 8: E-commerce adoption level per sector
Sector E – commerce adoption levels
Total None (%) Level 1 (%) Level 2 (%) Level 3 (%)
Textile and clothing 0 (0.0) 2 (10.5) 2 (18.2) 0 (0.0) 4 (8.5)
Chemical processing 1 (7.7) 4 (21.1) 0 (0.0) 0 (0.0) 5 (10.6)
Metal and machinery 4 (30.8) 2 (10.5) 1 (9.1) 1 (25.0) 8 (17.0)
Printing 0 (0.0) 6 (31.6) 7 (63.6) 3 (75.0) 16 (34.0)
Motor vehicle 1 (7.7) 3 (15.8) 0 (0.0) 0 (0.0) 4 (8.5)
Leather products 2 (15.4) 1 (5.3) 1 (9.1) 0 (0.0) 4 (8.5)
Carpentry and joinery 5 (38.5) 1 (5.3) 0 (0.0) 0 (0.0) 6 (12.8)
Total 13 (27.7) 19 (40.4 11 (23.4) 4 (8.5) 47 (100)
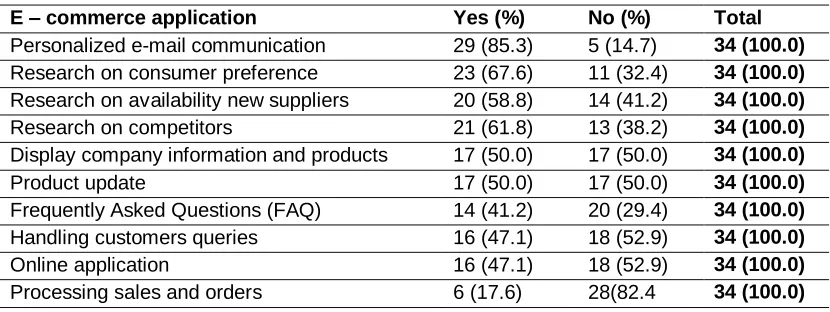
About 60% of the businesses which had adopted E-commerce application were in Level 1. These included research on consumer preference, availability of new suppliers, research on competitors and display of company information and products. Those practicing applications which fall in Level 2 were about 40%. The applications included Frequently Asked Questions (FAQ), handling customers’ queries and online application. Less than 20% practiced
applications in level 3 which included processing sales and orders and coordinating procurements. None of the firms engaged in Level 4 of E-commerce applications which include tracking goods and Electronic Data Interchange (EDI), Electronic Fund Transfer (EFT). Others were online credit, smart card processing and pre-paid card as shown in Table 9.
Table 9: Electronic commerce applications
E – commerce application Yes (%) No (%) Total
Personalized e-mail communication 29 (85.3) 5 (14.7) 34 (100.0)
Research on consumer preference 23 (67.6) 11 (32.4) 34 (100.0) Research on availability new suppliers 20 (58.8) 14 (41.2) 34 (100.0)
Research on competitors 21 (61.8) 13 (38.2) 34 (100.0)
Display company information and products 17 (50.0) 17 (50.0) 34 (100.0)
Product update 17 (50.0) 17 (50.0) 34 (100.0)
Frequently Asked Questions (FAQ) 14 (41.2) 20 (29.4) 34 (100.0)
Handling customers queries 16 (47.1) 18 (52.9) 34 (100.0)
Online application 16 (47.1) 18 (52.9) 34 (100.0)
Licensed under Creative Common Page 8
Coordinating procurement 6 (17.6) 28(82.4 34 (100.0)
Advertising on third party website 4 (11.8) 30 (88.2) 34 (100.0)
Tracking goods 0 (0.0) 0 (0.0) 34 (100.0)
Electronic Data Interchange (EDI) 0 (0.0) 0 (0.0) 34 (100.0)
Electronic Fund Transfer (EFT) 0 (0.0) 0 (0.0) 34 (100.0)
Online credit 0 (0.0) 0 (0.0) 34 (100.0)
Smart cards processing 0 (0.0) 0 (0.0) 34 (100.0)
Pre-paid card 0 (0.0) 0 (0.0) 34 (100.0)
DISCUSSIONS
The study found out that 91.5% of the firms were small enterprises, 48.9% were run under sole proprietorship while 57.4% employed managers. Also 46.8% were between 6 – 10 years old. The results agree with the study of Matambalya (2001) which found that majority of the SMEs in Kenya were employing less than 50 employees. This is because the small enterprises are cheap to start and run because of the structures. This could be the reason why a higher proportion of them were under sole proprietorship. However, it was observed that majority employed managers to run their business which in most cases is not common with small enterprises. All the respondents had formal education with 44.7%, 39.9% and 23.4 having attained tertiary training, secondary and university education respectively. The high proportion of the respondent with tertiary training is because the sectors considered were in manufacturing which by the nature of their operation require intensive knowledge and skills and therefore certain level of literacy and formal training.
Majority of the firms (97.9%) were utilizing mobile phones and 87.2% used fixed lines while 95.7%, 72.3% and 46.8% had computers, internet connectivity and website respectively. The results show the usage of ICT in Kenya in general and SMEs in particular has been increasing over time and with fixed lines reaching nearly saturation point while the percentage of the firms using mobile phone were growing faster. This is in line with the expectations that by year 2007, the mobile phones usage was going to be higher than the number of fixed lines in many Africa countries which was attributed to low quality and long waiting lists of fixed lines services Matambalya (2001). For SMEs, the survival and the competitiveness in economic activities among others are propelled by the use of mobile telephones. Therefore, the existence of an efficient mobile telephone infrastructure in the country is cardinal to SMEs’ development.
Licensed under Creative Common Page 9
accessed through one’s mobile telephone. This has the advantage of reducing transaction costs
in terms lost of man hours spent at a bank to request for a cheque book or make balance enquiry.
The adoption of General Packet Radio Services (GPRS) technology by the mobile telephone operators in the country provides the opportunity for users of the service to access internet using their already acquired handsets. Relatively, this has the advantage of less cost of access to the internet for limited usage in the form of sending and receiving emails. With the adoption of this technology, over 20 million mobile telephone subscribers in the country could have access to internet through their handsets. Therefore, if the service is effectively utilized, it will considerably increase the total internet subscription in the country. One important use of mobile telephones which has not been exploited effectively in the country relates to advertisement. The increasing mobile telephone subscription provides an avenue for the SMEs to use the service to advertise their products and services. One SMS advert sent by a mobile telephone operator will reach all the subscribers of its service and this may be better than radio or TV advert which one can easily miss if the communication gadget (radio and TV) has been switched off. With the SMS advert, it can be saved for future reference and one can still receive the message later if the handset was initially turned off. Though the cost implication is not known, it is important that this service should be explored by the SMEs. It also means that the operators should adopt a competitive pricing system which could attract many potential SMEs to use the service to advertise their products. Therefore, it is important that aggressive marketing promotions (including cost incentives) are initiated by the mobile telephone operators in this country to encourage the use of their value-added services.
Licensed under Creative Common Page 10
Costa Rica, Mexico and Venezuela) showed that 97% of the SMEs surveyed in these countries had computers and 94% had Internet access ,UNCTAD (2005) .
In general, the results of the study indicated that most SMEs in Kenya have adopted some form of commerce applications. However, most have only implemented basic E-commerce applications such as email and simple web sites resulting in level 1 and level 2 applications. Most of the websites were not active and the active ones do not provide online order processing and payments facilitations. Moreover, not many SMEs seemed to have the capabilities to perform online procurement and order tracking. The preceding findings showed that the adoption of E-commerce is still low among the SMEs in Kenya. These findings matched the results in similar studies conducted by Kashorda, M. (2009).
CONCLUSION
It can be concluded that although the use of E-commerce technology in Kenya is very high, 27.7% of the SMEs have not adopted any level of E-commerce applications, while 40.4% and 23.4% had adopted Level 1 and Level 2 of E-commerce applications respectively such as basic E-commerce applications such as email and simple web sites. Major limitation of the study was the sample size, which was obtained only from the SMEs at KIE cluster, Nairobi. Hence, the findings were only generalized to the extent of the sample population who will participated in the study.
RECOMMENDATIONS
The implications of the preceding findings mean that:
i. The SMEs need to examine the reasons why they have only adopted low levels of E-commerce application.
ii. They need to consider investing in more advanced E-commerce applications as well as redesign their marketing strategies in order to reap profit out of the adoption of the above applications.
iii. The government to lend a helping hand in terms of E-commerce investment by giving out loans and avail ICT infrastructures to the SMEs.
REFERENCES
Allan, C.; Annear, J.; Beveren Van, J. (2003) A framework for adoption of ICT and security technologies by SMEs. Ballarat: A paper for the small enterprise Association of Australia and New Zealand 16th annual conference
Licensed under Creative Common Page 11 Cater – Steel, A and Grist, S. (2004) Steps to the internet adoption success: A study of four small regional organization. Australian Journal of Information Systems, 11 (2), 37 – 45
Esselaar, S; Stork, C; Ndiwalana, A; Deen-Swarray (2007). ICT usage and its impact on profitability of SMEs in 13 African countries. RIA volume 4, No. 1
Grandon, E. E., Pearson, J. M. (2004). Electronic commerce adoption: an empirical study of small and medium US businesses. Information & Management, 42(1), 197-216.
Gray, C. (2003). A state model of ICT and adoption in small firms. Rimini: Firms and consumers facing e-commerce: Strategies to increase Its adoption and usage workshop
Ho, J. 1997,’evaluating the WWW: A global study of commercial sites’, Journal of Computer Mediated Communication, vol.3, no.1
Jeffcoate, J; Chappell, C; Feindt, S. (2002). Best practice in SME adoption of e-commerce.
Benchmarking. An International Journal, 9(2) 122 – 132
Kashorda, M. (2009) The Role of SMMEs in ICT Innovation and Knowledge of Economy. A paper presented at CODIST in Addis Ababa. April 30, 2009.
Khatibi, A., Thyagarajan, V. & Seetharaman, A. (2003). ‘E-commerce in Malaysia:Perceived Benefits and Barriers’, The Journal for Decision Makers, Vol. 28, no.3, p77-82
Lawson, R., Alcock, C., Cooper, J., Burgess, L. (2003). Factors affecting adoption of electronic commerce technologies by SMEs: An Australian study. Journal of Small Business and Enterprise Development, 10(3), 265-276.
Levenburg, N.M.; Schwarz, T.V.; Danridge, T.C. (2002). Understanding adoption of the Internet technologies. Small Business Advancement National Centre Newsletter, June 2002, 230, 5
Levy, M and Powell, P. (2003). Exploring SME the Internet Adoption: towards contingent model. Electronic Markets, 13(2), 173 – 181
Matambalya, F; Wolf, S. (2001). The role of ICT for the performance of SMEs in East Africa. Emperical Evidence from Kenya and Tanzania. ZEF – Discussion paper on Development Policy. Born, December, 2001
OECD. (2004). ICT, E-Business and SMEs. Paris Cedex, France: Organisation for Economic Co-operation and Development.
Poon, S and Swatman, P, (1999). An exploratory study of small Business internet commerce issue. Information and management, 9-18
Seyal, A and Rahman, M.N.A (2003). A preliminary investigation of E-commerce Adoption in Small and Medium Enterprises in Brunei. Journal of Global Information Technology Management 6, 3-21
Sulaiman, A. (2000). ‘The Status of E-commerce applications in Malaysia’, Information Technology for Development, vol.9, pp.153-161
Stone, M. (2003). ‘SME e-business and supplier-customer relations’, Journal of Small Business and Enterprise Development, vol. 10, no. 3, pp 345-353.