Nat. Hazards Earth Syst. Sci., 16, 1881–1895, 2016 www.nat-hazards-earth-syst-sci.net/16/1881/2016/ doi:10.5194/nhess-16-1881-2016
© Author(s) 2016. CC Attribution 3.0 License.
Factors controlling erosion/deposition phenomena related to lahars
at Volcán de Colima, Mexico
Rosario Vázquez, Lucia Capra, and Velio Coviello
Centro de Geociencias, UNAM-Campus Juriquilla, Querétaro, C.P., 76046, Mexico
Correspondence to:Rosario Vázquez (rvazmor@geociencias.unam.mx)
Received: 20 April 2016 – Published in Nat. Hazards Earth Syst. Sci. Discuss.: 12 May 2016 Revised: 11 July 2016 – Accepted: 24 July 2016 – Published: 15 August 2016
Abstract. One of the most common phenomena at Volcán de Colima is the annual development of lahars that runs mainly through the southern ravines of the edifice. Since 2011 the study and the monitoring of these flows and of the associated rainfall has been achieved by means of an instrumented station located along the Montegrande ravine, together with the systematic surveying of cross-topographic profiles of the main channel. From these, we present the com-parison of the morphological changes experimented by this ravine during the 2013, 2014 and 2015 rainy seasons. The erosion/deposition effects of 11 lahars that occurred during this period of time were quantified by means of the topo-graphic profiles taken at the beginning and at the end of the rainy seasons and before and after the major lahar event of 11 June 2013. We identified (i) an erosive zone between 2100 and 1950 m a.s.l., 8◦in slope, with an annual erosional rate
of 10.3 % mainly due to the narrowness of the channel and to its high slope angle and (ii) an erosive-depositional zone, between 1900 and 1700 m a.s.l., (∼8 % erosion and∼16 % deposition), characterized by a wider channel that decreases in slope angle (4◦). Based on these observations, the major factors controlling the erosion/deposition rates in the Monte-grande ravine are the morphology of the gully (i.e., channel bed slope and the cross section width) and the joint effect of sediment availability and accumulated rainfall. On the dis-tal reach of the ravine, the erosion/deposition processes tend to be promoted preferentially one over the other, mostly de-pending on the width of the active channel. Only for extraor-dinary rainfall events are the largest lahars mostly erosive all along the ravine up to the distal fan where the deposi-tion takes place. In addideposi-tion, as well as the morphological characteristics of the ravine, the flow depth is a critical fac-tor in controlling erosion, as deeper flows will promote
ero-sion against deposition. Finally, by comparing rainfalls asso-ciated with lahars that originated after the last main eruptive episode that occurred in 2004–2005, we observed that higher accumulated rainfall was needed to trigger lahars in the 2013 and 2014 seasons, which points to a progressive stabilization of the volcano slope during a post-eruptive period. These re-sults can be used as a tool to foresee the channel response to future volcanic activity, to improve the input parameters for lahar modeling and to better constrain the hazard zonation at Volcán de Colima.
1 Introduction
oc-cur by dilution due to tributary streamflows, overrunning ac-tive stream channels or entrainment of water-saturated sedi-ments (Pierson and Scott, 1985; Costa, 1987; Cronin et al., 1999). All of these flow changes control the capacity of la-hars to modify the morphology of the channels where they flow, as observed in several studies (Muñoz-Salinas et al., 2008, 2009; Doyle et al., 2009, 2011; Starheim et al., 2013; Andrés de Pablo et al., 2014), not only in volcanic environ-ments, but also in mountainous regions in the form of debris flows. The role that the slope, the sediment availability, rain-fall distribution and flow dynamics play, among other param-eters, has been studied for a long time (e.g., Coe et al., 2008; Guthrie et al., 2010; Berger et al., 2011; Schürch et al., 2011; Abancó and Hürlimann, 2014; Theule et al., 2015), and has served to extrapolate these findings to volcanic conditions.
Previous studies found that the highest erosion rates in river basins (105–106m3km−2yr−1) correspond to active
volcanoes under humid climate (Milliman and Syvitski, 1992; Walling and Webb, 1996; Major et al., 2000). As ob-served by Lavigne (2004), for these types of volcanoes, the efficiency of erosion is a consequence of rain-triggered lahars that develop during the rainy season; converting the estima-tion of sediment yield and erosion rate is a very difficult task to achieve (Lavigne, 2004; Procter et al., 2010; Pierson et al., 2011; Thouret et al., 2014). However, several studies analyze the erosion/deposition (E/D) processes of active channels on volcanic environments along with the factors that controls them (Major et al., 2000; Lavigne, 2004; Berger et al., 2011; Pierson et al., 2011; Starheim et al., 2013; Thouret et al., 2014). These studies point out that the main factors affecting (E/D) rates are the amount of rainfall and volume of sedi-ments available, the hydrologic characteristics of the stream-bottom deposits, the flow depth, and the morphology of the channel (Mizuyama and Kobashi, 1996; Fagents and Baloga, 2006; Berger et al., 2011; Okano et al., 2012; Thouret et al., 2014). Moreover, a number of studies address the issue of identifying governing factors of debris flow entrainment, and most of them have been carried out in laboratory (Mangeney et al., 2010; Iverson et al., 2011) or mountain environments (e.g., Chen et al., 2005; Hungr et al., 2005; Guthrie et al., 2010; Berger et al., 2011; McCoy et al., 2012; Abancó and Hürlimann, 2014; Theule et al., 2015). These latter studies show large scattered results, which suggests that mechanisms governing the entrainment are complex and depend on site and flow characteristics.
At Volcán de Colima, one of the most active volcanoes in Mexico, the annual occurrence of lahars during the rainy sea-son is a common feature that has allowed the development and dynamics of these flows to be studied. Since 2011, the formation and evolution of lahars were monitored along the Montegrande ravine, a gorge located on the southern slope of the volcano, and one of the most active ravines in laharic activity. The real-time monitoring of these phenomena has been conducted by means of a monitoring station located at 2000 m a.s.l. (for a detailed description of the equipment see
Vázquez et al., 2014, 2016), along with topographic profiles and field data obtained during the 2013–2014 seasons. From these data, it was possible to analyze and describe the annual sediment budget at selected sites, as well as the factors that mostly control the (E/D) processes. No important volcanic activity producing pyroclastic flow deposits on the volcano slope was reported during this period, a fact that could have altered the annual sedimentation rate. The results presented here can contribute to a better definition of the mitigation strategies and hazard assessment of lahars, and a determina-tion of the most suitable sites for lahar monitoring, as well as a better understanding of the behavior of lahars at Volcán de Colima.
2 Morphological features of Montegrande ravine Volcán de Colima is an almost perfectly cone-shaped stra-tovolcano, and has a slope that varies between 40 and 35◦ from the summit at 3840 m a.s.l., which decreases to < 10◦ to-wards its base (Capra et al., 2010) at∼1600 m a.s.l. (Fig. 1). The ravines where lahars develop annually are located in the southeastern and southwestern sector of the edifice. In this paper we will focus on Montegrande ravine which is one of the most active ravines in the formation of lahars (Fig. 1), and which has been being monitored since 2011 (Vázquez et al., 2014, 2016).
The Montegrande ravine begins where two main gullies connect at the main break in the slope of the cone (from 30 to∼20◦), at approximately 2400 m a.s.l. (e.g., the prox-imal zone, Fig. 1-Ia, b, and II). After this, the ravine ex-tends∼6.5 km in length, comprising the intermediate zone, from∼2300 to 1900 m a.s.l., where the slope decreases to ∼8◦(Fig. 1-I c, d, e, f, and II), and the distal zone, located from 1900 to 1600 m a.s.l. at the mouth of the ravine, where the main channel opens to a wide fan, where the slope de-creases to∼2◦(Fig. 1-Ig, h, and II) and lahars discharge all their loads (Fig. 1h). The ravine is formed by the erosion of Holocene debris avalanche deposits, and pyroclastic flow de-posits from the 1913 Plinian eruption, with vertical walls up to 20 m in height and up to 70 m in width (e.g., Fig. 1a and b). The active channel is highly variable in width, from 20 m to very narrow sections of∼3 m (Fig. 1c, d, e, f, and g), and is flanked by historic laharic terraces a few meters high (e.g., Fig. 1c). In addition, the ravine presents a complex morphol-ogy downwards, showing straight paths in some places, and in others tight turns of around 60–20◦(Fig. 1-I). Where the
ravine ends, the power lines of Comisión Federal de Elect-ricidad (CFE), the national power company, cross the entire width of the fan (Fig. 1-I), and because of this, during the lahar season they are prone to be damaged, as has occurred in previous years (Davila et al., 2007).
R. Vázquez et al.: Factors controlling erosion/deposition phenomena 1883
Figure 1.[I] SPOT 5 image (1, 2, 3, and 4 bands in RGB combination, 5 m of resolution) of Volcán de Colima showing the Montegrande ravine and the location of the checkpoints. Yellow triangles represent the location of the analyzed cross sections, green dots the location where the photos were taken: within the proximal zone(a, b), the intermediate zone(c, d, e, and f)and the distal zone(g, h). [II] Topographic profile along the ravine, showing its slope values and the location of the checkpoints and the monitoring site.
the morphology of the main channel and the terraces that flank it evolve markedly (Fig. 2a and b). Meanwhile, during the dry season, the main channel is filled up by wood debris and small failures from the banks (Fig. 2c).
3 Methodology
The study of the morphological changes suffered by Monte-grande ravine during the 2013–2015 seasons associated with the laharic activity was carried out by taking topographic profiles perpendicular to the flow path in selected sites (e.g., Fig. 2d) and by monitoring rainfall trends in the basin. Five checkpoints were selected and their respective topographic profiles were taken on 11 and 12 June, 30 July, 11 Octo-ber 2013, 12 SeptemOcto-ber 2014, and 18 March 2015. These sites are numbered from MG_01 to MG_05, starting from the monitoring site at∼2000 m a.s.l. within the
intermedi-ate zone (Fig. 1-I, and II), up to the mouth of the ravine in the distal zone (Fig. 1-I). In addition, we also take into ac-count two profiles within the portion of the monitoring site named MG_T-P1 and MG_T-P2. All profiles were taken and are presented here, looking upstream (i.e., towards the vol-cano crater, Fig. 2d).
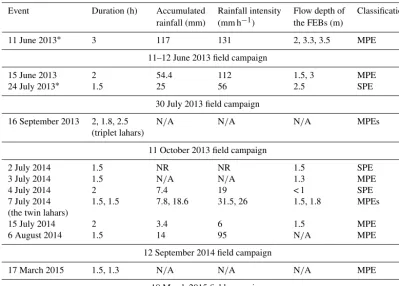
lo-Table 1.Classification and features of the lahars that developed during the 2013 and 2014 rainy seasons, along with the first lahar of the 2015 season, on Montegrande ravine.
Event Duration (h) Accumulated Rainfall intensity Flow depth of Classification rainfall (mm) (mm h−1) the FEBs (m)
11 June 2013∗ 3 117 131 2, 3.3, 3.5 MPE 11–12 June 2013 field campaign
15 June 2013 2 54.4 112 1.5, 3 MPE 24 July 2013∗ 1.5 25 56 2.5 SPE
30 July 2013 field campaign
16 September 2013 2, 1.8, 2.5 N/A N/A N/A MPEs (triplet lahars)
11 October 2013 field campaign
2 July 2014 1.5 NR NR 1.5 SPE
3 July 2014 1.5 N/A N/A 1.3 MPE 4 July 2014 2 7.4 19 < 1 SPE 7 July 2014 1.5, 1.5 7.8, 18.6 31.5, 26 1.5, 1.8 MPEs (the twin lahars)
15 July 2014 2 3.4 6 1.5 MPE
6 August 2014 1.5 14 95 N/A MPE 12 September 2014 field campaign
17 March 2015 1.5, 1.3 N/A N/A N/A MPE 18 March 2015 field campaign
∗The event was described by Vázquez et al. (2016).
FEBs: fronts enriched in blocks. N/A: no data available.
NR: no rainfall registered at the monitoring site.
cally. However, and as stated by Capra et al. (2010), rain-fall episodes are often localized, and sometimes the rains that trigger the lahars are not recorded at the monitoring site. Despite this uncertainty, a global analysis clearly can distin-guish the characteristics of rainfall that trigger lahars (Capra et al., 2010), as will be discussed below.
Morphological changes are compared here based on the results of topographic surveys. We analyze and classify a to-tal of 15 flows which occurred during the 2013–2015 seasons (Table 1), following the methodology described in Vázquez et al. (2016), which is based on monitoring data that are gathered at Montegrande monitoring site and that identify them as single-pulse events (SPEs), and multi-pulse events (MPEs). The SPEs are characterized by a flow that lasts 1– 1.5 h and develops a single front enriched in blocks (FEBs), followed by diluted surges (DSs), whereas the MPEs present more than one FEB interspersed by a sustained flow that shows changes in flow discharges (DSs) and lasts up to 3 h, ending with a prolonged streamflow (Vázquez et al., 2016). In Table 1, a summary of the 15 lahars that developed during this time is presented. Maximum flow depth at the monitor-ing site was also estimated for the lahars with available
im-ages. No more events were detected during the 2013–2015 period analyzed here.
Only for the 11 June 2013 lahar were topographic surveys performed the day before and after the event. In the other cases, profiles mostly take the annual season of lahars into account (Table 1). For example, after the 11 June lahar and before the 30 July survey, two lahars formed; after these and until the next field campaign on 11 October, an MPE event named “triplet lahars” (see Table 1) took place; it was formed of three lahars during the same day, though these were sep-arated by some hours. During the 2014 season, seven lahars developed until the field campaign on 12 September, after which no more lahars formed in 2014. The first event of the following season occurred on 17 March 2015 and the topo-graphic profiles were measured the day after. Thus, the mor-phological changes described in the following sections are related to the beginning and the end of the 2013–2015 sea-sons.
R. Vázquez et al.: Factors controlling erosion/deposition phenomena 1885
Figure 2.Photographs showing the main morphological features of Montegrande ravine and the changes due to laharic activity.(a)Photo of the morphology at MG_04 checkpoint on 11 June 2013 (at the beginning of the rainy season, and before the development of the lahar) and(b)on 12 June 2013, a day after the lahar, showing the erosion caused by the flow.(c)Trees and debris obstructing the main channel of the ravine during the dry season due to small landslides.(d)Photo of one of the checkpoints, with the sketched profile shown by a hatched yellow line, and the corresponding measured profile.
Figure 4.Cross-section profiles before (bold blue lines) and after (hatched lines in light-blue) the 11 June 2013 lahar for the following checkpoints (Fig. 1 for location):(a)MG_01,(b)MG_02,(c)MG_03,(d)MG_04,(e)MG_05. All the profiles were taken facing upstream of the channel.
the topographic profiles are superimposed to qualitatively ob-serve channel variation in depth and width during the 2013– 2015 seasons (Fig. 5). To do so, the topographic profiles were embedded in a rectangle of a known area (Fig. 3a and b), and the (E/D) rates were determined according to the following statements (Fig. 3a and b).
1. During date i and date ii for the same site:x=x0and
y=y0; henceAT =x·y=100 %.
2. During date i,A1+A2=AT =100 %; also, during date
ii,A3+A4=AT; henceA1+A2=A3+A4=100 %.
3. There will be erosion (E)if between date i and date ii,
A3>A1andA4<A2.
4. There will be deposition (D)if between date i and date ii,A3<A1andA4>A2.
From these remarks, the areal valuesAT,A1,A2,A3and A4, along with the rates E andD, were estimated for the
dates reported in Table 2.
4 Results
4.1 Morphology of Montegrande ravine before and after the 11 June 2013 lahar
R. Vázquez et al.: Factors controlling erosion/deposition phenomena 1887
Figure 5.Comparative cross-section profiles of the checkpoints in Montegrande ravine, according to the field campaigns (Fig. 1 for location).
(a)MG_T-P1,(b)MG_T-P2,(c)MG_01,(d)MG_02,(e)MG_03,(f)MG_04, and(g)MG_05. The dotted lines represent erosion, and lines represent deposition. The blue colors are related to the 2013 season, while the red and green lines refers to the 2014 and 2015 season respectively.
total rainfall associated with this lahar was 117 mm, which accumulated in ∼2.2 h with a maximum peak intensity of 131 mm h−1 (Table 1). For this lahar, we took profiles the day before and the day after (Figs. 3c, d and 4) the event, which allowed us to outline theEandDrates qualitatively and quantitatively (Table 2), and which served as an example of the effects of an MPE under extreme hydrometeorological conditions.
In general, the MPE of 11 June 2013 eroded the channel bed of the ravine by 1 m depth on average, as can be observed in Fig. 3d, and from the profiles of checkpoints MG_01, MG_02, and MG_03 (Fig. 4a, b, and c, respectively).
How-ever, from the profiles of MG_04 and MG_05 sites (Figs. 4d and e), it is clear that bothE/D processes were acting si-multaneously. In fact, on checkpoint MG_05, the lahar left a final deposit that filled up the channel bed by at least 1 m, but eroded the right later terrace. In general, along the ravine, erosion was more predominant in the channel bed than in the walls; however in some portions of the ravine, the ero-sion tends to wash away one side of the channel more prefer-entially than the other, developing a lateral migration of the channel axis (e.g., Fig. 4a and c).
Table 2.Channel morphology at checkpoints, in relation to theE/D(Ein bold,Din italics) rates, flow depths and annual rainfall for the 11 June 2013 lahar and the 2013–2014 seasons.
Checkpoint transect MG_01 MG_02 MG_03 MG_04 MG_05
15 Table II. Channel morphology at checkpoints, in relation to the E/D rates, flow depths and annual rainfall for 575
the 11 June 2013 lahar, and the 2013-2014 seasons. 576 577 578 579 580 581 582 583 584 585 586 587 588 589 15 Table II. Channel morphology at checkpoints, in relation to the E/D rates, flow depths and annual rainfall for 575
the 11 June 2013 lahar, and the 2013-2014 seasons. 576 577 578 579 580 581 582 583 584 585 586 587 588 589 15 Table II. Channel morphology at checkpoints, in relation to the E/D rates, flow depths and annual rainfall for 575
the 11 June 2013 lahar, and the 2013-2014 seasons. 576 577 578 579 580 581 582 583 584 585 586 587 588 589 15 Table II. Channel morphology at checkpoints, in relation to the E/D rates, flow depths and annual rainfall for 575
the 11 June 2013 lahar, and the 2013-2014 seasons. 576 577 578 579 580 581 582 583 584 585 586 587 588 589 15 Table II. Channel morphology at checkpoints, in relation to the E/D rates, flow depths and annual rainfall for 575
the 11 June 2013 lahar, and the 2013-2014 seasons. 576 577 578 579 580 581 582 583 584 585 586 587 588 589
Mean slope 8◦ 8◦ 6◦ 5◦ 4◦
E/Drate (%) Total rainfall (mm)
Mean flow depth of the FEBs (m) 11 June 2013 lahar 0.5 15.3 5.2 5.3 2.5 117 3.0 2013 season 2.7 22.1 6.9 16.6 7.9 580 2.6 2014 season 8.1 0.7 18.5 19.6 9.6 540 1.5
E: erosion.
D: deposition.
FEBs: front enriched in blocks.
MG_01 and MG_02 sites (Fig. 4a and b), but to a lesser ex-tent (< 1 m) in the other sites (Fig. 4c, d, and e).
4.2 Morphological evolution of Montegrande ravine within the 2013–2015 field campaigns
Besides the MPE of 11 June 2013, three more lahars were de-veloped during the 2013 rainy season (one of them being the triplet lahars, Table 1), for which additional observations are provided here. In 2014, more than five flows were observed, classified and analyzed, and the annual balance is presented here based on a survey before and after the season. Finally, for 2015, only data gathered after the first lahar (which was an MPE) of the season are described here (Figs. 5 and 6 and Table 1).
Figure 5 shows the profiles of the channel bed of Monte-grande ravine, from the monitoring site (at ∼2050 m a.s.l., Fig. 5a) towards the mouth of the ravine (at∼1750 m a.s.l., Fig. 5g). In all profiles, the same color corresponds to the same year, and the gradient of its color corresponds to different field campaigns. The segmented lines represent an erosion-dominated regime with respect to the previous profile, while the continuous lines represent a deposition-dominated regime (Fig. 5).
The first checkpoint (MG_T-P1) is located within the seg-ment of the channel that is being monitored by the video camera (e.g., Figs. 1c, 3c, and d). In this site, the channel morphology does not change significantly through the sea-son. Small variations of the channel axis position are ob-served, which tends to migrate to the left side of the bank, towards the wall of an old terrace (Fig. 5a). After the event that occurred on 17 March 2015, the channel becomes nar-rower (from∼14 to∼12 m) due to a new small terrace
de-velopment along the left bank, and to a small collapse of the right wall which occurred during the dry season (Fig. 5a).
Checkpoint MG_T-P2 (Figs. 1-I and 5b), situated∼20 m downstream from MG_T-P1, shows an increase in depth of the channel from June to July 2013, from ∼1.5 to ∼5 m (Fig. 5b). For this checkpoint, we only took the topographic profiles during the 2013 season since in 2014 the exact loca-tion of this site was not recognizable.
The MG_01 checkpoint is located ∼80 m downstream from the monitoring site (Fig. 1-I), shows a progressive in-crease in depth by almost 2 m (Fig. 5c), and becomes nar-rower, from 7 m wide at the beginning of the 2013 season to ∼2 m wide at the end of the season. It is also evident that the terraces that flank the active channel were eroded by more than 2 m in depth (Fig. 5c) during the 2013–2014 seasons.
The next checkpoint (MG_02, Fig. 5d) is located approx-imately 750 m downstream from the MG_01 site (Fig. 1-I), where the channel path is almost rectilinear and has a regular width of∼10 m. As can be observed from the overlapping of the profiles (Fig. 5d), the process of erosion dominates at this site, deepening the channel bed by almost 4 m, and ex-tending its width up to 15 m, but maintaining the main axis in the same place (Fig. 5d).
R. Vázquez et al.: Factors controlling erosion/deposition phenomena 1889
Figure 6.Annual balances during 2013 and 2014 seasons of theE/Dprocesses from the cross-section profiles of the checkpoints at Mon-tegrande ravine (Fig. 1 for location). For the 2013 season:(a)MG_01,(b)MG_02,(c)MG_03,(d)MG_04, and(e)MG_05. For the 2014 season:(f)MG_01,(g)MG_02,(h)MG_03,(i)MG_04, and(j)MG_05. The light fill patterns represent the eroded area within the active channel and the darker fill patterns represent deposition.
the right side of the channel, narrowing its previous width (∼12 m) by∼2.8 m, and was deeply eroded by the 17 March 2015 lahar, showing a tendency to recover its initial morphol-ogy (i.e., that from 11 June 2013, Fig. 5e) but moving the channel axis to the left side.
The MG_04 checkpoint is located approximately 800 m downstream from the MG_03 site, just before the path of the ravine makes a turn into another straight segment (Fig. 1-I).
chan-Figure 7.Comparative plot of accumulated rainfall vs. duration of historic and recent events that triggered lahars at Volcán de Colima. The black diamonds represent the data from this paper (2013–2015), and the extraordinary event of 11 June 2013 is denoted by a red box. The historical data (Capra et al., 2010) are represented with empty circles and refer to 2007–2009 years. The gray triangles represent a number of rainfall events that occurred during the 2014 season and that did not trigger a lahar.
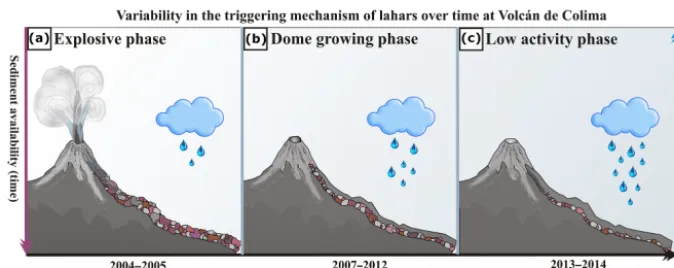
Figure 8.Conceptual model of the variability in the conditions needed to trigger a lahar over time at Volcán de Colima.(a)After the main explosive phase during 2004–2005, the slopes of the volcano were filled with material, and the rate of rainfall needed to trigger a lahar was minor.(b)During the dome growing phase (from 2007 to 2012), the amount of material decreased, while the amount of rainfall needed to trigger lahars was increasing over time.(c)Finally, during the phase of the lowest eruptive activity (from 2012 to 2015), the rate of material available to form lahars was diminishing, while a major quantity of rainfall was needed to trigger the flows.
nel of which the main axis migrated to the right, to recover a morphology in 2015 similar to the main channel shape at the beginning of the 2013 season. (i.e., 11 June 2013, Fig. 5f).
The morphology of the last checkpoint (MG_05), located ∼650 m downstream (Fig. 1-I), is also the result of a com-bination ofE/Dprocesses. Similarly to checkpoints MG_03 and MG_04, the morphology of the channel tends to be re-covered (Fig. 5g) but with a lateral migration of the main axis towards the left side through the season. After the 11 June 2013 lahar, the active channel continues to be filled up by the successive flows (Fig. 5g), decreasing its depth by about 2 m, as observed by the 30 July campaign. By 11 October 2013, the channel suffered a major morphological change, with a widening from∼7 to∼18 m, and a deepening of the
chan-nel bed 1 m in the central axis (Fig. 5g). During the 2014 season and from the evidence of the 18 March 2015 cam-paign, it could be observed that the lateral terraces were built up again, and the morphology of the middle portion of the channel tends to be recovered (Fig. 5g).
4.3 AnnualE/Dbalance in Montegrande ravine 4.3.1 The 2013 season
R. Vázquez et al.: Factors controlling erosion/deposition phenomena 1891
event corresponds to an exceptional accumulated rainfall of 117 mm (Fig. 7).
At checkpoints MG_01 and MG_02 erosion dominates with∼12 % of erosion of the channel bed on average (Fig. 6a and b, Table 2), mainly on the main axis of the channel. At the end of the 2013 season, the depth of the channel at check-point MG_01 was 2 m deeper than at the beginning (Figs. 5c and 6a), and the channel width became wider, from ∼7 to ∼15 m (Figs. 5c and 6a). At checkpoint MG_02 (Fig. 6b), the level of erosion was lower, deepening the channel bed by ∼2.5 m and widening it up to 6 m at the end of the season (Figs. 5d and 6b).
In the subsequent checkpoints (MG_03 to MG_05, i.e., Fig. 6c–e) located downstream of the ravine, the rate ofE/D
was more or less balanced (Table 2). At checkpoint MG_03 (Fig. 6c), at the end of the 2013, the channel was filled by sediments up by 2 m thick, reaching an 11 m width by the erosion on lateral walls.
At MG_04 checkpoint the rate of deposition was larger ac-cording to the values in Table 2, even though, as can be seen in Fig. 6d,E/Drates are present within the profiles. The main change in the morphology of the site was the widening of the channel, from∼10 m (on 11 June, Figs. 5f and 6d) to∼13 m at the end of the season, but with an accretion of the channel bed of up to 2 m. It is worth observing that the widening of this part of the channel was preferentially towards the right bank of the bed axis (Fig. 6d).
Finally, at checkpoint MG_05 (Fig. 6e), the level of ero-sion during the 2013 season was more evident, with a value of ∼8 % that corresponds to the widening of the channel from ∼8 m to ∼16 m (Fig. 6e), but with a deposit in the middle axis of∼0.5 m in thickness by the end of the season. 4.3.2 The 2014 season
During the 2014 season, the total rainfall in Montegrande ravine was∼540 mm. In comparison with the 2013 season, the changes in the morphology of the checkpoints were dom-inated rather by the process of deposition than by erosion (Fig. 6), even though seven lahars were developed during 2014 (five MPEs and two SPEs, Table 1).
In general, at checkpoints MG_01 and MG_02 (Fig. 6f and g), the rate of erosion was higher than in the downstream checkpoints (MG_03, MG_04, and MG_05, Fig. 6h–j, re-spectively), but not that high in comparison to the 2013 sea-son (Fig. 6a–e, Table 2).
At checkpoint MG_01 (Fig. 6f), the erosion was mainly focused on the walls of the terraces that flank the channel axis, eroding∼8 % of the material, diminishing its height by 2 m, but conserving the active channel width of∼2.5 m with a final deposit of∼1 m in thickness (Fig. 6f). On the other hand, at checkpoint MG_02, bothE/Dare present, (Fig. 6g), with a final deposition rate of 0.7 % (Table 2) and conserving the main morphology through the season, i.e., a wide channel (∼16 m width), flanked by terraces of 5 m height (Fig. 6g).
In contrast to the observed balance onE/Drates for the MG_01 and MG_02 sites, at the successive checkpoints, the deposition process dominates. For instance, at site MG_03 (Fig. 6h), the channel width reduced from ∼11 to ∼8 m, due to 18.5 % of deposition within the channel bed forming a new terrace on the right side of the channel. Similarly, at checkpoint MG_04 (Fig. 6i), the width of the channel re-duced from∼16 to∼5 m, because of the∼20 % of deposi-tion (Table 2) left in the channel bed, with the formadeposi-tion of new terraces along the flank of the active channel (Fig. 6i). Finally, at checkpoint MG_05 (Fig. 6j), a morphology simi-lar to the MG_03 site can be observed, where new material was deposited preferentially on the right side of the channel wall (D=9.6 %), leaving vertical steps and narrowing the channel from∼16 to∼14 m (Fig. 6j).
5 Discussion
It is well known that channel morphology controls flow depth, flow velocity and peak discharge, and that it also pro-motes bulking or de-bulking of lahars. According to the ob-servations made by Doyle et al. (2011), when these flows reach a steady state, they tend to have extremely dynamic in-teractions with their channel and may rapidly alternate be-tween net deposition and erosion, and thus exchange part of their sediment load. Dynamically, erosion normally oc-curs under a rise of the peak flow, even though the degree of erosion-related bulking depends upon the erodibility of the channel bed, bank, and related material, the shear stress ap-plied to these surfaces, and the volume of sediment available for erosion (Pierson, 1995). Hence, a narrow channel will increase the depth of the flow, its velocity, and thus the dis-charge, promoting erosion, as seen at MG_01 and MG_02 checkpoints, where the channel mean width is∼10 m, and the channel is flanked by steep terraces, in comparison to the downstream sites (from MG_03 to MG_05), where the chan-nel width is > 10 m on average. Conversely, deposition tends to be concentrated in sites of local sudden slope decrease (Fannin and Wise, 2001; Hürlimann et al., 2003; Hungr et al., 2005; Schürch et al., 2011), increased channel width, chan-nel bends, or bifurcations (Doyle et al., 2011; Schürch et al., 2011).
ravine). This behavior is in agreement with the hydrogeomor-phological model proposed by Lavigne (2001), which identi-fies the chief processes that shape the channel morphology in three main channel segments: (1) a proximal segment where riverbed and bank erosion is continuous (i.e., from MG_01 to MG_02), (2) an unsteady transitional zone, where ero-sional processes alternate with depositional processes (i.e., from MG_03 to MG_05), and (3) a distal segment where sediment deposition is continuous (in this case, the alluvial fan of Montegrande ravine).
Based on these results, the channel bed slope represents the first morphological parameter in controlling the E/D
rates at Montegrande ravine; erosion is prevalent where the channel bed slope is higher than 8◦, while depositional pro-cesses dominate where the channel bed slope is smaller than 5◦. This latter slope value represents a higher value than that observed in Ruapehu of ∼2.7–0.7◦ (Fagents and
Baloga, 2006) or the < 1.2◦ found by Pierson (1995) for
snow-clad volcanoes, but a similar value to those observed in Popocatépetl volcano (i.e., < 6.5◦, Capra et al., 2004; Muñoz-Salinas et al., 2008, 2009). On the other hand, the domi-nant erosional behavior of lahars above 8◦is also consistent with observations made in other volcanic environments (e.g., Procter et al., 2010) and in Alpine basins affected by debris flows (e.g., Berger et al., 2011; Schürch et al., 2011; Theule et al., 2015).
The second morphological parameter that affects E/D
processes at Montegrande ravine is the cross-section width. In Montegrande, at distal sections (MG-04 and MG-5),E/D
processes alternate and appear to be controlled by both the channel width variation and the decrease of the channel bed slope angle. However, our observations dictate that erosion dominates as the channel reaches a critical width, after which deposits start forming new terraces along the channel wall (e.g., Fig. 5f and g). When the channel narrows anew, ero-sion takes place again. This cyclic behavior ofE/Dregimes controlled by the channel morphological changes has been previously observed and quantified by Doyle et al. (2009), Berger et al. (2011), and Schürch et al. (2011). In particu-lar, Schürch et al. (2011) supported this remark by studying the scouring effects of debris flows at Illgraben, in the Swiss Alps. According to their measurements, substantial erosion is more likely when flow depth increases. Events with front heights > 2.3 m were all erosive; meanwhile the events with front heights < 2.7 m were mainly depositional. Similar be-havior was observed in the Montegrande ravine, where the flows that occurred during the 2013 season had front heights of more than 2 m and up to 3.5 m (Table 1), presenting a regime that was mainly erosive, especially considering the 11 June lahar alone (Figs. 3 and 4). During the 2014 season, the flows presented mean front heights of∼1.5 m (Table 1), be-ing mainly depositional. These values clearly correlated with the annualE/Drate observed during the 2013–2014 season. The 11 June 2013 lahar represents an exceptional event that was erosive almost all along the ravine. This lahar was
asso-ciated with an extraordinary rainfall event (117 mm of accu-mulated rain, Table 1) that developed a large flow depth up to 3.5 m, and highly erosive flow all along the Montegrande ravine. Similar exceptional events have been previously ob-served in the same ravine during the Jova hurricane, which also developed a high-magnitude lahar that deeply eroded the channel (Capra et al., 2013).
R. Vázquez et al.: Factors controlling erosion/deposition phenomena 1893
the precipitation required to trigger a lahar was of higher val-ues of accumulated rainfall and/or longer duration (Figs. 7 and 8c). During the 2014 season, a number of rainfall events did not trigger lahars. These events had similar characteris-tics to those observed during the 2007–2012 period (Fig. 7), which confirms the gradual decrease of sediment availability around the volcanic edifice.
6 Conclusion
The systematic monitoring of the morphological changes ob-served in Montegrande ravine in the past years ob-served as a starting point for the analysis of the geomorphic modifica-tions due to post-eruptive lahars in an active channel in a volcanic environment.
Channel bed slope, cross-section width and the joint effect of sediment availability and rainfall magnitude are the main factors controllingE/Dprocesses at Montegrande ravine. In particular, the proximal and middle reaches, where the bed slope is up to 10–8◦, are dominated by erosion, while in the distal reach (5–2◦),E/Dprocesses act simultaneously. In the distal reach of the ravine, theE/Dprocesses tend to be pro-moted preferentially one over the other, also depending upon the channel width between events, which in turn affects the flow depth, inducing one regime or the other. Only for ex-traordinary rainfall events are lahars mostly erosive all along the ravine up to the distal fan where deposition takes place.
These results can be used as a tool to foresee the effects of future laharic events in Volcán de Colima, and as a tool to improve the input parameters for the modeling of these flows along other volcanoes (e.g., the Popocatépetl volcano; see Caballero and Capra, 2014), in order to determine the hazard zonation for lahars in this volcano.
The 2013–2014 period was characterized by very low ex-plosive activity at Volcán de Colima, during which only small rockfalls and pyroclastic flows formed at the beginning of the 2013 and at the end of 2014. As previously observed (Capra et al., 2010), lahar frequency increases right after an eruptive phase and decreases during the following years, but this study evidences that the number of events is not di-rectly related to theE/Drate, in comparison to the amount and intensity of rainfall, which still remains as the main fac-tor in controlling flow discharge (magnitude) and duration. The volcano landscape recovered its hydrological and sed-iment yield equilibrium in less than 10 years, and only the largest and long-lasting lahars can catastrophically modify the ravine morphology.
A series of BAFs that occurred during the dome collapse episode of 10–11 July 2015 at Volcán de Colima dramatically changed the morphology of Montegrande ravine, filling up the main channel up to its distal fan (Capra et al., 2016), and became rectilinear, altering its geomorphic and hydrological features again. These new geomorphic conditions will prob-ably lead to the formation of a new morphology and to a
change in the characteristics of the flows of the next rainy season that will likely involve a large amount of sediment.
7 Data availability
Rain gauge data and images of the recorded lahars are avail-able under a collaborative framewok between Centro de Geo-ciencias, UNAM (L. Capra), and related Institutes, and Uni-versities. In case of needing further information, we ask you kindly to contact directly the authors.
Acknowledgements. This work was supported by CONA-CyT 220786, PAPIIT-UNAM IN-105116 and SRE-CONACONA-CyT 146324 projects, managed by Lucia Capra. Thanks are expressed to the staff of Centro Nacional de Prevención de Desastres (CENAPRED) for the setup of the instrumentation at Montegrande monitoring site. Thanks are due to Penélope López for managing the Spot image acquisition from ERMEX-SPOT IMAGE S.A. We also thank all the students and colleagues who helped to take the topographic profiles during the seasons.
Edited by: G. Macedonio
Reviewed by: L. Caballero and R. Cioni
References
Abancó, C. and Hürlimann, M.: Estimate of the debris-flow entrain-ment using field and topographical data, Nat. Hazards, 71, 363– 383, doi:10.1007/s11069-013-0930-5, 2014.
Andrés de Pablo, N., Zamorano, J. J., and Blasco, J. J. S.: Evolu-ción post-lahárica de un canal proglaciar: garganta de Huiloac (México), Bol. Soc. Geol. Mex., 66, 305–328, 2014.
Berger, C., McArdell, B. W., and Schlunegger, F.: Direct measure-ment of channel erosion by debris flows, Illgraben, Switzerland, J. Geophys. Res., 116, F01002, doi:10.1029/2010JF001722, 2011.
Beverage, J. and Culbertson, J.: Hyperconcentrations of suspended sediment, Am. Soc. Civ. Eng., 90, 117–126, 1964.
Caballero, L. and Capra, L.: The use of FLO2D numerical code in lahar hazard evaluation at Popocatépetl volcano: a 2001 la-har scenario, Nat. Hazards Earth Syst. Sci., 14, 3345–3355, doi:10.5194/nhess-14-3345-2014, 2014.
Capra, L., Poblete, M. A., and Alvarado, R.: The 1997 and 2001 la-hars of Popocatépetl volcano (Central Mexico): textural and sedi-mentological constraints on their origin and hazards, J. Volcanol. Geotherm. Res., 131, 351–369, 2004.
Capra, L., Borselli, L., Varley, N., Gavilanes-Ruiz, J. C., Norini, G., Sarocchi, D., Caballero, L., and Cortes, A.: Rainfall-triggered lahars at Volcán de Colima, Mexico: Surface hydro-repellency as initiation process, J. Volcanol. Geotherm. Res., 189, 105–117, 2010.
Capra, L., Gavilanez-Ruiz, J. C., Bonasia, R., Saucedo-Giron, R., and Sulpizio, R.: Re-assessing volcanic hazard zonation of Volcán de Colima, México, Nat. Hazards, 74, 41–61, doi:10.1007/s11069-014-1480-1, 2015.
Capra, L., Macías, J. L., Cortés, A., Dávila, N., Saucedo, R., Osorio-Campo, S., Arce, J. L., Gavilanes-Ruiz, J. C., Corona-Chávez, P., García-Sánchez, L., Sosa-Ceballos, G., and Vázquez, R.: Prelim-inary report on the July 10–11, 2015 eruption at Volcán de Col-ima: Pyroclastic density currents with exceptional runouts and volume, J. Volcanol. Geotherm. Res., 310, 39–49, 2016. Chen, J., He, Y. P., and Wei, F. Q.: Debris flow erosion and
de-position in Jiangjia Gully, Yunnan, China, Environ. Geol., 48, 771–777, doi:10.1007/s00254-005-0017-z, 2005.
Coe, J. A., Kinner, D. A., and Godt, J. W.: Initiation con-ditions for debris flows generated by runoff at Chalk Cliffs, central Colorado, Geomorphol., 96, 270–297, doi:10.1016/j.geomorph.2007.03.017, 2008.
Costa, J. E.: Physical geomorphology of debris flows, in: Develop-ments and Applications of Geomorphology, edited by: Costa, J. E. and Fleisher, P. J., Springer, Berlin, 268–317, 1984.
Costa, J. E.: Rheologic, geomorphic, and sedimentalogic differenti-ation of water floods, hyperconcentrated flows and debris flows, in: Flood geomorphology, edited by: Baker, V. R., Craig Kochel, R., and Patton, P. C., John Wiley and Sons, New York, 113–122, 1987.
Cronin, S. J., Neall, V. E., Lecointre, J. A., and Palmer, A. S.: Dynamic interactions between lahars and stream flow: A case study from Ruapehu volcano, New Zealand, Geol. Soc. Am. Bull., 111, 28–38, doi:10.1130/0016-7606(1999)111<0028:DIBLAS>2.3.CO;2, 1999.
Davila, N., Capra, L., Gavilanes-Ruiz, J. C., Varley, N., Norini, G., and Gómez-Vazquez, A.: Recent lahars at Volcán de Col-ima (Mexico): Drainage variation and spectral classification, J. Volcanol. Geotherm. Res., 165, 127–141, 2007.
Doyle, E. E., Cronnin, S. J., Cole, S. E., and Thouret, J.-C.: The challenges of incorporating temporal and spatial changes into numerical models of lahars, in: 18th World IMACS/MODSIM Congress, Cairns, Australia, 2009.
Doyle, E. E., Cronin, S. J., and Thouret, J.-C.: Defining conditions for bulking and debulking in lahars, Geol. Soc. Am. Bull., 123, 1234–1246, 2011.
Fagents, S. A. and Baloga, S. M.: Toward and model for the bulk-ing and debulkbulk-ing of lahars, J. Volcanol. Geotherm. Res., 111, B10201, doi:10.1029/2005JB003986, 2006.
Fannin, R. J. and Wise, M. P.: An empirical-statistical model for debris flow travel distance, Can. Geotech., J., 38, 982–994, doi:10.1139/cgj-38-5-982, 2001.
Guthrie, R. H., Hockin, A., Colquhoun, L., Nagy, T., Evans, S. G., and Ayles, C.: An examination of controls on debris flows mobil-ity: Evidence from coastal British Columbia, Geomorphol., 114, 601–613, 2010.
Hungr, O., McDougall, S., and Bovis, M.: Entrainment of material by debris flows, in: Debris-flows hazards and related phenomena, edited by: Jabob, M. and Hungr, O., Springer, Berlin Heidelberg, 135–158, 2005.
Hürlimann, M., Rickenmann, D., and Graf, C.: Field and data mon-itoring of debris-flow events in the Swiss Alps, Can. Geotech. J., 40, 161–175, doi:10.1139/t02-087, 2003.
Iverson, R. M., Reid, M. E., Logan, M., LaHusen, R. G., Godt, J. W., and Griswold, J. P.: Positive feedback and momentum growth during debris-flow entrainment of wet bed sediment, Nat. Geosci., 4, 116–121, doi:10.1038/ngeo1040, 2011.
Lavigne, F.: Evolution géomorphologique de la vallée Boyong à la suite de l’éruption du 22 novembre 1994 du volcán Merapi, Java, Indonésie, Geomorphologie Suppl., 46, 123–142, 2001. Lavigne, F.: Rate of sediment yield following small-scale volcanic
eruptions: A quantitative assessment at the Merapi and Semeru stratovolcanoes, Java, Indonesia, Earth Surf. Process. Landf., 29, 1045–1058, 2004.
Macías, J. L., Saucedo, R., Gavilanes, J. C., Varley, N., Velasco-García, S., Bursik, M., Vargas-Gutiérrez, V., and Cortés, A.: Flu-jos piroclásticos asociados a la actividad explosiva del Volcán de Colima y perspectivas futuras, GEOS, 25, 340–351, 2006. Major, J. J., Pierson, T. C., Dinehart, R. L., and Costa, J. E.:
Sedi-ment yield following severe volcanic disturbance: a two-decade perspective from Mount St. Helens, Geology, 28, 819–822, 2000. Major, J. J., Bertin, D., Pierson, T. C., Amigo, Á., Iroumé, A., Ulloa, H., and Castro, J.: Extraordinary sediment deliv-ery and rapid geomorphic response following the 2008–2009 eruption of Chaitén Volcano, Chile, Water Resour. Res., 52, doi:10.1002/2015WR018250, 2016.
Mangeney, A., Roche, O., Hungr, O., Mangold, N., Faccanoni, G., and Lucas, A.: Erosion and mobility in granular collapse over sloping beds, J. Geophys. Res. Earth. Surf., 115, 1–21, doi:10.1029/2009JF001462, 2010.
Manville, V., Németh, K., and Kano, K.: Source to sink: A review of three decades of progress in the understanding of volcanicastic processes, deposits and hazards, Sed. Geol., 220, 136–161, 2009. McCoy, S. W., Kean, J. W., Coe, J. A., Tucker, G. E., Stan-ley, D. M., and Wasklewicz, T. A.: Sediment entrainment by debris flows: In situ measurements from the headwaters of a steep catchment, J. Geophys. Res. Earth Surf., 117, 1–25, doi:10.1029/2011JF002278, 2012.
Milliman, J. D. and Syvitski, J. P.: Geomorphic/tectonic control of sediment discharge to the ocean: the importance of small moun-tainous rivers, J. Geol., 100, 525–544, 1992.
Mizuyama, T. and Kobashi, S.: Sediment yield and topographic change after major volcanic activity, in: Proceedings of the Ex-eter Symposium, IAHS Publication, IAHS Publication 236 pp., 295–301, 1996.
Muñoz-Salinas, E., Renschler, C. S., Palacios, D., and Namikawa, L. M.: Updating cannel morphology in digital elevation models: lahar assessment for Tenenepanco-Huiloac Gorge, Popocatépetl volcano, Mexico, Nat. Hazards, 45, 309–320, 2008.
Muñoz-Salinas, E., Renschler, C. S., and Palacios, D.: A GIS-based method to determine the volume of lahars: Popocatépetl volcano, Mexico, Geomorphol., 111, 61–69, 2009.
Okano, K., Suwa, H., and Kanno, T.: Characterization of debris flows by rainstorm condition at a torrent on the Mount Yakedake Volcano, Japan, Geomophol., 136, 88–94, 2012.
Pierson, T. C.: Flow characteristics of large eruption-triggered debris flows at snow-clad volcanoes: Constraints for debris-flow models, J. Volcanol. Geotherm. Res., 66, 183–194, doi:10.1016/0377-0273(94)00070-W, 1995.
R. Vázquez et al.: Factors controlling erosion/deposition phenomena 1895
phenomena, edited by: Jakob, M. and Hungr, O., Springer Verlag, New York, 159–196, 2005.
Pierson, T. C. and Costa, J. E.: A rheologic classification of sub-aerial sediment-water flows, Geol. Soc. Am. Rev. Eng. Geol., 7, 1–12, 1987.
Pierson, T. C. and Scott, K. M.: Downstream dilution of a lahar, transition from debris flow to hyperconcen-trated streamflow, Water Resour. Res., 21, 1511–1524, doi:10.1029/WR021i010p01511, 1985.
Pierson, T. C., Pringle, P. T., and Cameron, K. A.: Magnitude and timing of downstream channel aggradation and degradation in response to a dome-building eruption at Mt. Hood, Oregon, Geol. Soc. Am. Bull., 123, 3–20, 2011.
Procter, J., Cronin, S. J., Fuller, I. C., Lube, G., and Manville, V.: Quantifying the geomorphic impacts of a lake-breakout lahar, Mount Ruapehu, New Zealand, Geol., 38, 67–70, doi:10.1130/G30129.1, 2010.
Schürch, P., Densmore, A. L., Rosser, N. J., and McArdell, B. W.: Dynamic controls on erosion and deposition on debris-flow fans, Geol., 39, 827–830, doi:10.1130/G32103.1, 2011.
Scott, K. M.: Origins, behavior, and sedimentology of lahars and lahar-runout flows in the Toutle-Cowlitz River system, US Geo-logical Survey Professional Paper, 1447-A, 47 pp., 1988. Scott, K. M., Vallance, J. W., Kerle, N., Macias, J. L., Strauch, W.,
and Devoli, G.: Catastrophic precipitation-triggeres lahar at Ca-sita volcano, Nicaragua: Occurrence, bulking, and transforma-tion, Earth Surf. Proc. Landf., 30, 59–79, doi:10.1002/esp.1127, 2005.
Smith, G. A. and Fritz, W. J.: Volcanic influences on terrestrial sed-imentation, Geology, 17, 375–376, 1989.
Starheim, C., Gomez, C., Daves, T., Lavigne, F., and Wassmer, P.: In-flow evolution of lahar deposits from video-imagery with im-plications for post-event deposit interpretation, Mount Semeru, Indonesia, J. Volcanol. Geotherm. Res., 256, 96–104, 2013. Sulpizio, R., Capra, L., Sarocchi, D., Saucedo, R., Gavilanes-Ruiz,
J. C., and Varley, N. R.: Predicting the block-and-ash flow inun-dation areas at Volcán de Colima (Colima, Mexico) based on the present day (February 2010) status, J. Volcanol. Geotherm. Res., 193, 49–66, 2010.
Theule, J. I., Liébault, F., Laigle, D., Loye, A., and Jaboyedoff, M.: Channel scour and fill by debris flows and bedload transport, Ge-omorphol., 243, 92–105, 2015.
Thouret J. C., Oehler, J. F., Gupta, A., Solikhin, A., and Procter, J. N.: Erosion and aggradation on persistenly active volcanoes – a case study from Semeru Volcano, Indonesia, Bull. Volcanol., 857, 26 pp., doi:10.1007/s00445-014-0857-z, 2014.
Vallance, J. W.: Lahars, in: Encyclopedia of volcanoes, edited by: Sigurdsson, H., Houghton, B., McNutt, S. R., Rymer, H., and Stix, J., Academic Press, New York, 601–616, 2000.
Vázquez, R., Capra, L., Caballero, L., Arámbula-Mendoza, R., and Reyes-Dávila, G.: The anatomy of a lahar: Deciphering the 15th September 2012 lahar at Volcán de Colima, Mexico, J. Volcanol. Geotherm. Res., 272, 126–136, 2014.
Vázquez, R., Suriñach, E., Capra, L., Arámbula-Mendoza, R., and Reyes-Dávila, G.: Seismic characterisation of lahars at Volcán de Colima, Mexico, Bull. Volcanol., 78, 14 pp., doi:10.1007/s00445-016-1004-9, 2016.
![Figure 1. [I] SPOT 5 image (1, 2, 3, and 4 bands in RGB combination, 5 m of resolution) of Volcán de Colima showing the Montegranderavine and the location of the checkpoints](https://thumb-us.123doks.com/thumbv2/123dok_us/8341954.1381639/3.612.127.469.67.436/figure-combination-resolution-volcan-colima-montegranderavine-location-checkpoints.webp)


![From Tin Pan Alley to the Royal Schools of Music : the institutionalisation of classical and jazz music : a thesis presented in partial fulfilment of the requirements for the degree of Master of Arts in Sociology at Massey University [at Albany]](data:image/gif;base64,R0lGODlhAQABAIAAAP///wAAACH5BAEAAAAALAAAAAABAAEAAAICRAEAOw==)