www.nat-hazards-earth-syst-sci.net/16/1571/2016/ doi:10.5194/nhess-16-1571-2016
© Author(s) 2016. CC Attribution 3.0 License.
GIS analysis of effects of future Baltic sea level rise
on the island of Gotland, Sweden
Karin Ebert, Karin Ekstedt, and Jerker Jarsjö
Department of Physical Geography and the Bolin Centre for Climate Research, Stockholm University, 10691 Stockholm, Sweden
Correspondence to:Karin Ebert ([email protected])
Received: 15 February 2016 – Published in Nat. Hazards Earth Syst. Sci. Discuss.: 1 March 2016 Revised: 16 June 2016 – Accepted: 20 June 2016 – Published: 7 July 2016
Abstract. Future sea level rise as a consequence of global warming will affect the world’s coastal regions. Even though the pace of sea level rise is not clear, the consequences will be severe and global. Commonly the effects of future sea level rise are investigated for relatively vulnerable de-velopment countries; however, a whole range of varying re-gions needs to be considered in order to improve the under-standing of global consequences. In this paper we investi-gate consequences of future sea level rise along the coast of the Baltic Sea island of Gotland, Sweden, with the aim to fill knowledge gaps regarding comparatively well-suited ar-eas in developed countries. We study both the quantity of the loss of features of infrastructure, cultural, and natural value in the case of a 2 m sea level rise of the Baltic Sea and the effects of climate change on seawater intrusion in coastal aquifers, which indirectly cause saltwater intrusion in wells. We conduct a multi-criteria risk analysis by using lidar data on land elevation and GIS-vulnerability mapping, which gives the application of distance and elevation param-eters formerly unimaginable precision. We find that in case of a 2 m sea level rise, 3 % of the land area of Gotland, cor-responding to 99 km2, will be inundated. The features most strongly affected are items of touristic or nature value, in-cluding camping places, shore meadows, sea stack areas, and endangered plants and species habitats. In total, 231 out of 7354 wells will be directly inundated, and the number of wells in the high-risk zone for saltwater intrusion in wells will increase considerably. Some valuable features will be ir-reversibly lost due to, for example, inundation of sea stacks and the passing of tipping points for seawater intrusion into coastal aquifers; others might simply be moved further in-land, but this requires considerable economic means and
pri-oritization. With nature tourism being one of the main in-come sources of Gotland, monitoring and planning are re-quired to meet the changes. Seeing Gotland in a global per-spective, this island shows that holistic multi-feature studies of future consequences of sea level rise are required to iden-tify overall consequences for individual regions.
1 Introduction
the predictions until 2100 but still clearly below the highest possible sea level rise.
One frequent and arguably severe effect of sea level rise on coastal regions would be seawater intrusion into coastal aquifer systems. For the Baltic Sea and elsewhere, most stud-ies have primarily been concerned with effects on climate change on river discharge (Andréasson et al., 2004; Graham, 2004; Chalov et al., 2015). Fewer have addressed groundwa-ter resources; Sherif and Singh (1999) present one of the first studies on the effects of climate change on seawater intrusion in two coastal aquifers. Even relatively modest increases in average sea level will change the position of the toe of the freshwater–saltwater interface of coastal aquifers relatively far in the inland direction. More generally, observations show that the thickness and volume of coastal freshwater reservoirs of the Baltic Sea can reduce considerably under changing en-vironmental conditions (Rasmussen et al., 2013).
In addition to such effects on water quality and water sup-ply, climate-driven sea level rise is expected to have vari-ous effects on agricultural, industrial, and service sectors. Flooded industrial and agricultural land may be associated with significant production losses. This land may potentially also release contaminants and nutrient from the soil surface. The inherent complexity of natural and social systems makes it a research challenge to more comprehensively understand and address the impacts of climate change on the basis of social relevance, systemic risks, and options for action. In this context it is important to build a knowledge base that al-lows consideration of various conflicting perspectives when dealing partly emotive issues (Raymond et al., 2010). Cli-mate adaptation involves the management of shared natural resources, where the different possible priorities and condi-tions make sustainable management relatively complex. In particular, the system risks, unlike traditional risks, need at-tention. Systemic risks are characterized by a high degree of complexity and uncertainty and are usually not limited to a single sector, which requires more holistic, reflective, and adaptive strategies (Renn et al., 2011).
To allow for system analysis on the necessary overall level, we will here process spatially distributed data and, through GIS, synthesize and visualize areas that are at high risk of suffering from the effects (basic methodology e.g. accord-ing to Persson et al., 2011). Risks related to climatology, geomorphology, hydrology, natural resources, ecology, and environmental assessment can then be explicitly considered. We acknowledge that several studies have considered the im-pact of sea level rise on a variety of environmental and an-thropogenic features (Kont et al., 2003; Blankespoor et al., 2014), yet often they fail to take on the multi-consequential characteristic of this subject. Often the effects of future sea level rise are investigated for development countries (Das-gupta et al., 2009; Dwarakish et al., 2009). A whole range of varying regions, including both developing and developed countries, need to be considered in order to improve the un-derstanding of global consequences. In this paper, we use the
case study of the Baltic Sea island of Gotland, Sweden, as an example for a well-suited area in a non-developed country, where means may be stronger to prepare for future sea level rise but at the same time historical investments in infrastruc-ture, industries, and private properties may be considerable. Gotland has a fully intact and self-maintaining infrastructure; it can only be reached by boat and is therefore its own entity. We here investigate the effects of future sea level rise on a multitude of features combined, thereby providing a ba-sis for assessments on overall impacts on the environment and infrastructure of the island. We base the investigation on GIS-vulnerability mapping as a variant of the coastal vulner-ability index (CVI) (Gornitz, 1990; Dwrakish et al., 2009), addressing the following main issues:
1. quantitative assessment of certain consequences of fu-ture 2 m sea level rise around Gotland on feafu-tures of infrastructure, cultural, and environmental value; 2. establishment of the pattern of effects on groundwater
hydrology and wells;
3. establishment of the risk of well salinization at the cur-rent (2015) sea level and at a 2 m sea level rise. We note that Gotland, according to the standards of EU’s Water Framework Directive, already shares the characteris-tics of having unsatisfactory (ground)water status with other coastal regions of the Baltic Sea, including the nearby Stock-holm region in Sweden (Andersson et al., 2012, 2014). We use an extensive dataset to underpin our calculations and in-terpretations, including data from well measurements, eleva-tion data, meteorological data, data on infrastructure, land cover and land use, and data on cultural objects. In other words, these data are used to investigate possible economic losses, changed quality of life (e.g. from water quality dete-rioration), and loss of features of cultural value of land in-undation due to sea level rise. Also, if we see Gotland as a “miniature world”, what effects can we expect from sea level rise globally?
2 Gotland – study area description
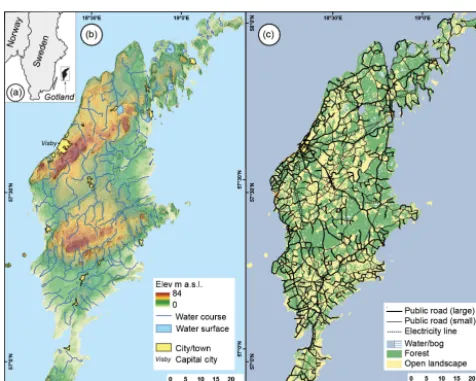
Figure 1.Study area:(a)location in Scandinavia;(b)topography,
hydrology, and major settlements;(c)road network and land cover.
heritage on the island are rich in hundreds of stone ships (old-est dating 1000 BC) and rune stones (old(old-est dating year 400), 92 medieval churches, and extensive historical pasture- and farmland (Region Gotland, 2014).
Tourism is therefore an important factor in commercial life on the island. Almost 100 000 international tourists vis-ited the island in 2014 (Region Gotland, 2014). Other impor-tant business areas are lime and cement mining, agriculture, and food industry; more than 10 % of the sheep and lambs in Sweden are found on this island, for example. Admin-istratively Gotland constitutes both a county and a munic-ipality of its own, with a gross regional product per capita of 308 000 SEK in 2013 which corresponds to 78 % of the national average. Infrastructure on the island is well estab-lished: the public transport network, for example, covers most of the island and frequent ferry and airplane departures connect it to the mainland. In 2013 40 % of the electricity supply came from wind power stations on the island, 50 % of the rural population had access to fiber broadband, and the municipal water supply system was of good quality. There are issues of pollution, mainly from poor individual sewage systems, in many of the separate water catchments, however (Region Gotland, 2014).
Gotland was covered by Fennoscandian ice sheets dur-ing the Quaternary (Kleman et al., 1997) and is still uplifted in glacio-isostatic adjustment,∼1.5 mm yr−1in its northern
parts and ca. 0.5 mm/year in its southern parts (Ågren and Svensson, 2011), which is insufficient to amend the conse-quences of predicted sea level rise.
The topography of Gotland is shaped by the Silurian cover rock layers, dipping slightly towards the east, and with a clear SW–NE structure forming the two highest ridges in the is-lands interior (Fig. 1b). The lowest and thereby most
vulner-able parts of the coastline are consequently along the east coast and with increasing distance to the ridges.
3 Data and methods
Analyses for this study were conducted in an ArcGIS en-vironment using a broad range of data sources: (i) LiDAR elevation data with 2 m resolution over the 3140 km2 study area from the Swedish National Land Survey; (ii) GIS-based data from the county administrative board of Gotland in-cluding various infrastructure (such as roads, buildings, wind power stations, power lines, camping sites), land cover and land use data (farming land, wetlands, forests, conservation areas, shore meadows, bird nesting areas, endangered plant species habitats) and features of cultural value (churches, his-torical wind mills, ancient monuments); (iii) well data from 7534 wells including location coordinates, elevation, well depth, groundwater level, and salinity, as well as soil types (vector) from the Swedish Geological Survey (SGU); and (iv) a map of annual average precipitation from the Swedish Meteorological and Hydrological Institute (SMHI). Notably, the lidar-based 2 m resolution elevation model of Sweden gives a formerly unimaginable precision in the application of distance and elevation parameters with a standard error in elevation of 0.05 m and a standard error on plain of 0.25 m on average (Lantmäteriet, 2015). The Swedish raster model is delivered in ASCII format. This 2 m ground elevation model is based on airborne laser scanning of the terrain, with a point density of approximately 0.5–1 points per m2. The ground surface was produced through automatic classifica-tion of points in the point cloud, with known elements (such as water polygons and buildings) used as supportive elements to remove buildings and vegetation (Lantmäteriet, 2015). 3.1 Quantitative assessment of inundated areas
For quantifying the proportion of affected and lost assets, a successive overlay analysis was applied combining the digital elevation model (DEM) with vector layers of in-frastructure, cultural objects, and features of environmental value. The overlay layer of the DEM consisted of all pix-els≤2 m a.s.l. of the 2 m elevation model to model a sea level rise of a 2 m worst case scenario until 2100. The vector layers of infrastructure included for example built-up areas, wells, roads, industrial areas and gas stations, as well as natural and cultural heritages such as shore meadows, cultural grazing fields, and rune stones.
3.2 Well density and depth to groundwater
were extracted for every well point. The well database con-tains information about the depth to groundwater at the time of well establishment. With this mosaic of snapshot mea-surements of groundwater depths for the different available wells, we estimated the depth to groundwater for the entire area through interpolation using inverse distance weighting, whereby random differences in measurement values between individual wells would partly cancel. We then subtracted the estimated depth to groundwater from the land surface to-pography to derive an estimate of the spatially distributed groundwater elevation.
3.3 Risk of saltwater intrusion into wells
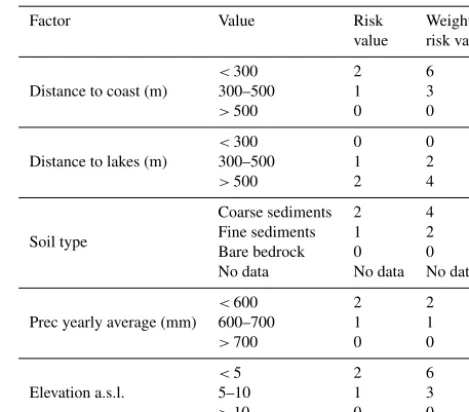
In assessing the risk of groundwater salinization of wells, we use a weighted overlay analysis, with inspiration from the risk value–weighing factor (RV) method (Lindberg et al., 1996; Sazvar, 2010), which is a variant of multi-criteria risk analysis that has been used widely for both groundwater protection and environmental management (e.g. Vias et al., 2005; Hossam et al., 2013) as well as for slope risk analysis (e.g. Tangestani, 2009; Pradhan, 2010; Sharma et al., 2013). The method is based on risk parameters and weighing fac-tors that are assessed for individual areas. The risk facfac-tors R=0, 1, 2, 3 are given with increasing importance of the pa-rameters influence on the salinization risk; the risk factorR is multiplied with the weighing factorV of each parameter to achieve the final weighted risk value (Eq. (1), Table 1). Weighted risk value=V1·R1+V2·R2+V3·R3+. . .
+Vn·Rn=6Vi·Ri, (1) whereRis the risk value andV is the weighing factor.
Since one of our main aims is to assess sea level rise im-pacts on saltwater intrusion risks, we give relatively high weight to factors that clearly must increase risks at elevated sea levels, such as the proximity of a groundwater well to the coast. Notably, some inland wells may currently be subject to high risk for intrusion of fossil seawater. However, this risk is essentially unaffected by sea level rise; therefore our set of weighting factors gives relatively low-risk values to such wells. In other words, this approach enables comparison of present results on impacts of sea level rise with other factors that can cause salinization of wells.
The risk values and weighting factors are used in a GIS-overlay of the parameter layers (see input layers in Fig. 5, and visual result of the overlay analysis in Fig. 6). In Sweden, this method has been used previously in areas around Stockholm (Lång et al., 2006) and Gotland (Lange, 2013). The variant used here comprises parameters that express (1) distance to coast, (2) distance to lakes, (3) soil type, (4) yearly average precipitation, and (5) elevation a.s.l. (Table 1). Gotland con-sists almost entirely of Silurian limestone; in the digital geo-logical data we have available, it consists of one bedrock type polygon only. Therefore we omit for simplicity bedrock type
Table 1.Factors included in the risk analysis for saltwater intrusion.
Factor Value Risk Weighted
value risk value
Distance to coast (m)
<300 2 6
300–500 1 3
>500 0 0
Distance to lakes (m)
<300 0 0
300–500 1 2
>500 2 4
Soil type
Coarse sediments 2 4
Fine sediments 1 2
Bare bedrock 0 0
No data No data No data
Prec yearly average (mm)
<600 2 2
600–700 1 1
>700 0 0
Elevation a.s.l.
<5 2 6
5–10 1 3
>10 0 0
as a parameter, since the factor would be constant across Got-land without effect on the outcome of the analysis. We here use values of parameters and weighing factors that were de-veloped for Sweden and Gotland in previous work (Gontier et al., 2003; Lång et al., 2006; Sazvar, 2010; Lange, 2013). For Gotland’s current ambient conditions, these parameters and weighing factors (Table 1) were found to produce risk values that agree well with observed chloride contents of ex-isting wells in coastal areas (Lange, 2013). Nevertheless, in the adopted methodological approach, it is unavoidable that there is a component of subjectivity in the assignment of risk values and weighting factors. Therefore, we investigate whether, and to which extent, our results and conclusions would be affected were they based on a different, but still realistic and methodologically reasonable, set of parameters. Specifically, we do this by considering the case that all the factors would be given the same weight,V =1. This implies very different input in terms ofR·V for some key terms, such as the distance to the coastline, which originally had V=3. The results obtained based on this alternative parame-ter set are compared to the original results, checking whether the drawn conclusions remain the same in both cases.
Table 2.Proportions of various types of infrastructure and features of cultural and environmental value that would be inundated in a 2 m sea
level rise scenario. Areas are given in square kilometres (km2) and lengths in kilometres (km).
In current data Inundated Proportion (%)
Parameter Area Length Number Area Length Number Area Length Number
Gotland 3147.4 98.8 3
Infrastructure
Roads1 5723.8 131.2 2
Individual buildings2 16 570 520 3
Power lines 312.3 3.1 1
Wells 7354 231 3
Wind power stations3 146 23 16
Lumber yards 3 2 67
Camping sites 20 7 35
Lighthouses 31 7 23
Cultural features
Farming land 894.6 7.9 1
Churches (smaller) 10 1 10
Wind mills 212 3 1.5
Ancient monuments 1140 11 1
Environmental features
Wetlands 79.1 5.6 7
Forests 1597.9 22.3 1.5
Conservation areas 311.0 59.2 19
Shore meadows4 31.0 18.6 60
Bird nesting areas 47.6 6.0 13
Endangered plant species
0.24 0.13 53
habitat (coastal)
1Of which several are mid-sections. From visual inspection total loss is about 2 times the inundated length.2Buildings (residential and others) outside “built-up areas”.3Unclear what year these data were updated exactly. There were 170 wind power stations in 2014 according to Region Gotland (2014); all but one of the inundated stations are found along the southern coast.468 % of the shore meadows are bordered landwards by open areas which possibly allow for habitat migration.
from the new elevations a.s.l., with 0 m a.s.l. corresponding to the current 2 m a.s.l. We acknowledge that wave actions (e.g. Gutierrez et al., 2011) could contribute to the here quan-tified effects being on the low-end side of the actual outcome, since we base our quantifications on a mean sea level, which could be temporarily exceeded e.g. because of waves. Nev-ertheless, our main focus is on relative change (future sit-uation relative to today’s sitsit-uation), and we expect that the approach gives robust results in terms of where the risk is higher than elsewhere – although absolute numbers are sub-ject to uncertainty. For instance, wave actions would gen-erally be most inland-effective at the flattest coastal zones, which also would be most affected by the average seawater level rise.
4 Results
4.1 Inundation of land area and infrastructure
The main findings of the overlay analysis are presented in Table 2. The table presents values that experience notable losses according to our calculation. An investigation of gas stations identified two of the existing ones as inundated in the scenario. Some examples are illustrated in Fig. 2.
Figure 2. (a)In the case of a 2 m sea level rise, 99 km2of Gotland’s
total area of 3140 km2will be inundated, corresponding to 3 % of
Gotland’s land area.(b)Gotland is famous for its nature attractions,
e.g. the sea stack area in Digerhuvud’s nature reservoir, NW
Got-land.(c) Gotland has the richest bird life in northern Europe. A
number of bird protection areas, mostly located at the coast, will be
inundated.(d)In some areas, the sea will intrude more than 1 km
inland in case of a 2 m sea level rise. Except for natural and cul-tural features, agriculcul-tural areas and wells will be affected. In some cases, new islands will be created.
As for cultural features, mostly solitary objects are af-fected, such as one smaller church and 11 ancient monu-ments. The characteristic sea stacks will suffer considerable loss (Fig. 2b), which may also be considered of cultural value. Almost the entire sea stack area will be inundated. Walking between sea stacks in Digerhuvud’s nature reserve will not be possible anymore (Fig. 2b); wave action will con-tribute to an increased erosion of the sea stacks (Forsberg, 2001).
For natural reasons, the dominating proportion of the key habitats and nature protection zones are located along the coast; these are indeed vulnerable to rising sea levels and
Figure 3. (a)Out of a total of 7354 wells, 231 are located on ele-vations 0–2 m, corresponding to about 3 % of all wells. These wells will be directly affected by sea level rise through inundation; how-ever, other wells on higher elevations further inland will be
indi-rectly affected by salinization.(b)Well density expressed as point
density.
potential losses here reach 10–60 % (e.g. Fig. 2c). With time these habitats may migrate landwards yet. The Gotland shore meadows are unique habitats for birds and endangered species (Olsson, 2008); 60 % of shore meadows (Table 2; Fig. 2a) will be inundated. Landward migration of these is limited by forests and would require human intervention to persist (cf. Olsson, 2008; Cedergren, 2013).
4.2 Well density and depth to groundwater
Figure 3a shows that 231 wells, corresponding to about 3 % of all wells, are located at ground elevations between 0 and 2 m a.s.l. They will hence be directly affected by sea level rise through inundation. Most of these wells, 131 out of 231, belong to summer houses and smaller farms. There were also 30 energy wells, 8 large farm wells, 4 industry wells, 1 irriga-tion well, and 49 wells with unspecified usage. This reflects the overall spectrum of usage; outside cities and towns, wells are used for summer houses and smaller farms (3837 out of a total of 7354), large farms (297 out of 7354), and irrigation and market gardens (74 out of 7354). There are also a rela-tively large number of energy wells (1068 out of 7354) and a smaller number of wells with industrial and other usages.
Figure 4. (a)Estimated depth to groundwater. Values for each well
were interpolated to one surface.(b) The estimated groundwater
elevation across Gotland, calculated by subtracting the estimated depth to groundwater from the topography.
is currently near or at the sea surface level (Fig. 4b). In par-ticular, in the areas shown in purple in Fig. 4b the estimated groundwater elevation is at sea level, which implies very high risk of salinization of wells even without sea level rise. 4.3 Wells and risk of salinization
Figure 5 shows individual contributions of different factors to the risk of well salinization. For each factor, the risk is ex-pressed as a weighted risk value (Eq. 1), where high values reflect elevated saltwater intrusion risk. The risk for density-driven intrusion of relatively heavy saltwater is clearly high (red areas of Fig. 5) at short distances to the coast where saline waters can readily replace fresh groundwater when the fresh groundwater is pumped from the well. Land surface elevation is also an important risk factor, since elevation dif-ferences drive groundwater flows from the coast, which can counteract density driven flows of saline water from sea to land. The fact that the annual mean precipitation of Gotland is higher in its central parts than near the coast implies lower local recharge of freshwater close to the coast, which con-tributes to higher salinization risks. Conversely, proximity to lakes implies higher potential for freshwater replenishment, which decreases the saltwater intrusion risk. The heteroge-neous pattern of soil types across Gotland adds patchiness in the weighted overlay analysis. The salinization risk is el-evated in coarse sediments (Table 1), which in many cases are located close to the coast. In contrast, lower-risk bare bedrock is frequently located further from the coast.
Figure 6a shows the current spatial variation in final risk of saltwater intrusion, resulting from all contributing factors of Fig. 5. Reinforcing factors related to soil, precipitation, topography, and proximity to seawater make the current
salt-Figure 5.Factors included in the risk analysis for saltwater intru-sion (see Table 2 for values and Fig. 6 for visual result).
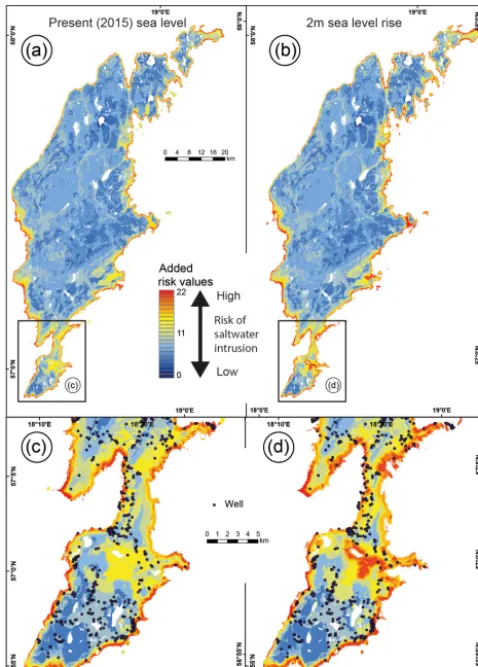
water intrusion risk considerably higher in a zone that ex-tends up to 5 km from the coastline (yellow to red areas in Fig. 6a). Beyond that zone, risks exhibit a considerable spa-tial variability (light to dark blue shades of Fig. 6a) but are generally lower albeit non-negligible. These current risks of saltwater intrusion in groundwater wells can be compared to estimated future risks given a projected sea level rise of 2 m shown in Fig. 6b. As previously mentioned, the land area of Fig. 6b is 3 % lower than in Fig. 6a due to inundation from intruding seawater, which for instance is reflected in a wider straight to between Gotland and the smaller island of Fårö in the northwestern corner of Fig. 6. Differences are also pro-nounced on the southern tip of Gotland; see Fig. 6c (current sea level) and Fig. 6d (2 m sea level rise). In particular, the spit of land in the middle region of the insert maps is con-siderably narrower in Fig. 6d than in Fig. 6c due to the 2 m sea level rise. However, despite this shrinkage of total land area, the areas that have high risk for saltwater intrusion are projected to increase in the future, which is most pronounced in the south, where for instance the very highest-risk classes (red to orange) extend much further in Fig. 6d than for the current conditions depicted in Fig. 6c.
Figure 6.Risk of saltwater intrusion as a result of the addition of
weighted risk values according to Table 2 and Fig. 5.(a)Risk of
saltwater intrusion in wells with the current (2015) sea level;(b)risk
of saltwater intrusion in wells after a 2 m sea level rise (areas below
2 m a.s.l. are subtracted);(c, d)magnification of southern Gotland
for both scenarios, including well locations.
class 21, where the number of wells will increase by 150 % in the future, from 402 to a total value of 609. Overall this shows that the percentage of high-risk wells will increase in the future, considering the remaining part of the island.
Investigating the robustness of the above results to the as-sumed set of risk values and weighting factors (Table 1), we found that results for a relatively different set of parameters (risk valueRaccording to Table 1, weightV=1 in all cases) revealed a very similar pattern (see Supplement), although there are some differences in the absolute values. This is most likely due to the fact that certain regions are subject to high risks because of combined impacts from multiple factors, which means that the results essentially remain the same even in case some of the factors are completely removed from the analysis (or as in the example, by reducing its impact by a factor 3). This means that our main conclusions remain the same in both cases and hence appear to be robust.
Figure 7.Risk value classes of wells on Gotland for today’s (2015) sea level and after 2 m sea level rise. The number of wells in higher-risk classes will increase. Wells below 2 m above the current sea level will be inundated.
5 Discussion
5.1 Multi-criteria risk analysis
Multi-criteria risk analysis with help of GIS-vulnerability mapping to identify risk areas of different types has been used in numerous studies (e.g. Vias et al., 2005; Tangestani, 2009; Pradhan, 2010; Hossam et al., 2013; Sharma et al., 2013). The advantages of this type of analysis is that param-eters used can be adapted to the characteristics of both the study area in question and the type of studied risk. However, studies that rely on elevation models for mapping inundation from sea level rise have frequently had too coarse vertical accuracy to support local decision making (Williams, 2013). The on-going development of high-resolution lidar datasets, including the presently used one for Gotland, contributes to the removal this constraint from an increasing number of coastal regions of the world.
coastal regions, results of inundation-focussed studies such as ours should be seen as relatively robust estimates of mini-mum effects, which may be exceeded due to the influence of parallel processes and secondary effects (e.g. Torresan et al., 2012).
5.2 Sea level rise – effect pattern on Gotland
For any region affected, sea level rise will create changes in environmental conditions, with consequences people’s qual-ity of life. We find for the island of Gotland that, as globally (Neumann et al., 2015), the density of settlements and infras-tructure is considerably higher towards the coast. We show that this is reflected in an increasing density of wells near the coastal stretch (Fig. 3). In the case of Gotland, the most endangered features are touristically interesting. More than 50 % of the wells in the risk zone of direct inundation by a 2m sea level rise belong to summer houses and small farms. Additionally, more than 50 % of the area of nature protec-tion areas such as sea stacks, shore meadows, and habitats for endangered plants species that are naturally at the coast are threatened by direct inundation (Fig. 2). Even the mini-mum predicted sea level rise will consume 60 % of Gotland’s protected shore meadows, a breeding place for a large vari-ety of bird species. With the shore meadows, sea stack ar-eas, and bird life diminishing, not only will uniquefeatures of natural and cultural value, providing live quality for hu-mans, animals, and plants, diminish but, as a consequence, tourism will also decrease.
This is a pattern known from other Baltic Sea states, for example Estonia (Kont et al., 2003). Tourism and nature pro-tection areas are main attractions and a major income of the economy of Gotland so these losses will need to be addressed in future planning. This basic problem is, for instance, also seen in the Caribbean islands, where main touristic attrac-tions are located in coastal regions that have been subject to considerable developments, but which are vulnerable to sea level rise and extreme weather events (Lewsey et al., 2004).
An indirect effect of inundation by a higher sea level will be the inland migration of areas with the risk of saltwater in-trusion in wells. Naturally the risk is highest along the coast-line, with distance to sea shore and elevation above sea level providing two main parameters in the overlay analysis. How-ever, in the case of Gotland this trend is even enforced by permeable soil types along the east coast as well as lower amounts of precipitation that bring an even stronger increase of risk values along the lowland areas along the coastline of Gotland.
Our results illustrate that in addition to direct and irre-versible loss of land, cultural features, and infrastructure such as roads, industrial land, natural reserves, and drinking wa-ter wells, the remaining part of the island will be more vul-nerable to saltwater intrusion. The problem could be further accentuated by pressures from increasing population and/ or population density of the coastal zone (as the island shrinks).
This means that the irreversible loss of 231 wells, according to our study, would be followed by a near irreversible loss of 120 wells that are located in the group of the highest-risk fea-tures of our GIS-vulnerability analysis. Parallel studies have shown that sea level rise may induce abrupt saltwater intru-sion events due to the existence of tipping points in coastal aquifers (e.g. Mazi et al., 2013); for coastal aquifers of Got-land, the risk of such abrupt shifts appear to be high since all five parameters we used in the overlay had the highest weighing values of the highest-risk parameters.
Our study gives a basis for further investigation of dif-ferent indirect consequences of sea level rise, not least eco-nomic and administrative implications. For example, present results show that a 2 m sea level rise will result in inunda-tion of approximately 2 % of the total length of Gotland’s road network. This is on a par with projected road inunda-tions as a result of 1 to 2 m sea level rise in coastal regions of southern Europe (Demirel et al., 2015) and the USA (Koetse and Rietveld, 2009). Despite such relatively low percentage of inundation, more detailed analyses of consequences in the US case showed that impacts on transport would be large due to network effects (Koetse and Rietveld, 2009). Over-all, many costs will appear due to necessary movement of inhabitants, movement/rebuild of infrastructure, leakage of contaminants from inundated polluted areas, drilling of new wells that replace saline ones, and decreasing tourism as cultural value disappears. Economic estimates need to take into account different possible scenarios where environmen-tal features need to be weighed against economical means. This study can be the base for crucially needed future stud-ies that include contact with the local administration to take foresighted action (cf. Libkovska and Zilniece, 2015).
With regard to industrial activities, the region that will be submerged by expected future sea level rise contains contam-inated industrial land and infrastructure that may have ad-verse environmental effects such as gas stations. Sea level rise can hence imply that costs for mitigation measures addressing Gotland’s current environmental problems may change due to changing environmental conditions; for com-pletely submerged regions, costs for remediation may even become too high to be feasible due to an increased inacces-sibility of flooded or partly flooded land. This in turn might lead to severe environmental consequences for the already burdened Baltic Sea (e.g. Garmaga, 2012).
eco-nomic, environmental, and life-quality consequences are not further assessed in this effect–pattern vulnerability analysis. An increase in multi-factor research on the consequences of climate driven sea level rise, as well as the distribution of the results to coastal municipalities and global exchange of experiences, is needed as soon as possible.
6 Conclusions
We performed multi-risk analysis, based on lidar data on land elevation and GIS-vulnerability mapping, to identify region-based consequences of future sea level rise and land inunda-tion, providing a basis for understanding their contribution and significance relative to secondary effects of sea level rise and other effects of hydro-climatic change on coastal regions. In the case of a 2 m sea level rise, 3 % of the land area of the Baltic Sea island of Gotland, corresponding to∼99 km2, will be inundated. The features most strongly effected, either by direct inundation or by a decrease in size, are mostly items of touristic or natural value, including the complete inunda-tion of 35 % of all camping places, 60 % of all shore mead-ows, 60 % of protected sea stack areas, and 53 % of endan-gered plants and species habitats. In addition to direct inun-dation of 231 out of a total of 7354 wells, the number of wells in the high-risk zone for seawater intrusion will increase con-siderably, further diminishing the habitable land area of the island. Most of the effected wells are summer houses and small farms that attract summer tourists.
With nature tourism being one of the main income sources of Gotland, monitoring and planning are required to meet the changes. Some features will be irreversibly lost due to, for example, inundation of sea stacks and the passing of tip-ping points for seawater intrusion into coastal aquifers; oth-ers might simply be moved further inland, but this requires considerable economic means and prioritization. Seeing Got-land in a global perspective shows that holistic multi-feature studies of future consequences of sea level rise are required in order to identify the consequences for individual regions and to be able to take action adjusted to the particular needs of the region in question. Studies like the present one can provide a basis for administrative discussions and planning.
The Supplement related to this article is available online at doi:10.5194/nhess-16-1571-2016-supplement.
Acknowledgements. We thank two anonymous reviewers for
constructive comments that led to improvements in our paper.
Edited by: H. Mitasova
Reviewed by: two anonymous referees
References
Ågren, J. and Svensson, R.: The Height System RH 2000 and the Land Uplift Model NKG2005LU, Map. Image Sci., 3, 4–12, 2011.
Andersson, I., Petersson, M., and Jarsjö, J.: Impact of the European Water Framework Directive on local-level water management: Case study Oxunda Catchment, Sweden, Land Use Policy, 29, 73–82, 2012.
Andersson, I., Jarsjö, J., and Petersson, M.: Saving the Baltic Sea, the inland waters of its drainage basin, or both? Spatial perspec-tives on reducing P-loads in eastern Sweden, Ambio, 43, 914– 925, 2014.
Andréasson, J. S., Bergström, B., Carlsson, L. P., Graham, L. P., and Lindström, G.: Hydrological change – Climate change impact simulations for Sweden, Ambio, 33, 228–234, 2004.
Blankespoor, B., Dasgupta, S., and Laplante, B.: Sea-Level Rise and Coastal Wetlands, Ambio, 43, 996–1005, doi:10.1007/s13280-014-0500-4, 2014.
Cedergren, B.: Havsnivåhöjningens påverkan på Gotlands kust och strandängar år 2100, Undergraduate thesis in Physical Geogra-phy, department of Physical GeograGeogra-phy, NG11, Stockholm Uni-versity, Stockholm, 2013.
Chalov, S. R., Jarsjö, J., Kasimov, N. S., Romanchenko, A. O., Pietro´n, J., Thorslund, J., and Promakhova, E. V.: Spatio-temporal variation of sediment transport in the Selenga River Basin, Mongolia and Russia, Environ. Earth Sci., 73, 663–680, 2015.
Dasgupta, S., Laplante, B., Meisner, C., Wheeler, D., and Yan, J.: The impact of sea level rise on development countries: a compar-ative analysis, Climatic Change, 93, 379–388, 2009.
Demirel, H., Kompil, M., and Nemry, F.: A framework to analyze the vulnerability of European road networks due to Sea-Level Rise (SLR) and sea storm surges, Transport. Res. Pt. A, 81, 62– 76, 2015.
Dwarakish, G. S., Vinay, S. A., Natesan, U., Asano, T., Kakinuma, T., Venkataramana, K., Jagadeesha Pai, B., and Babita, M. K.: Coastal vulnerability assessment of the future sea level rise in Udupi coastal zone of Karnataka state, west coast of India, Ocean Coast. Manage., 52, 467–478, 2009.
Forsberg, P.: Bjärget: geomorfologisk beskrivning av raukstråket och kustplattformen vid Digerhuvuds naturreservat, Fårö Karl-stad University studies, Fårö, 2001.
Garmaga, G.: Integrated assessment of pollution in the baltic sea, Ekologija, 58, 331–355, 2012.
Gontier, M. and Olofsson, B.: Areell sårbarhetsbedömning för grundvattenpåverkan av vägföroreninger, TRITA-LWR RE-PORT 3011, Royal Institute of Technology (KTH), Sweden, 2003.
Gornitz, V.: Vulnerability of the east coast, USA to future sea level rise, J. Coast. Res., 1, 201–237, 1990.
Graham, L. P.: Climate change effects on river flow to the Baltic Sea, Ambio, 33, 235–241, 2004.
Gutierrez, B. T., Plant, N. G., and Thieler, E. R.: A Bayesian net-work to predict coastal vulnerability to sea level rise, J. Geophys. Res.-Ea. Surf., 116, F02009, doi:10.1029/2010JF001891, 2011. Hanna, E., Huybrechts, P., Janssens, I., Cappelen, J., Steffen, K.,
Haq, B. U., Hardenbol, J., and Vail, P. R.: Chronology of Fluctuating Sea Levels Since the Triassic, Science, 235, 1156–1167, 1987. Hossam, H. E., Ragaa, E. S., Atef, A. Q., and Ahmad, M. N.:
Deter-mining groundwater protection zones for the Quaternary aquifer of northeastern Nile Delta using GIS-based vulnerability map-ping, Environ. Earth Sci., 68, 313–331, 2013.
IPCC: Climate Change 2014: Impacts, Adaptation, and Vulnera-bility, in: Part A: Global and Sectoral Aspects, Contribution of Working Group II to the Fifth Assessment Report of the Inter-governmental Panel on Climate Change, edited by: Field, C. B., Barros, V. R., Dokken, D. J., Mach, K. J., Mastrandrea, M. D., Bilir, T. E., Chatterjee, M., Ebi, K. L., Estrada, Y. O., Genova, R. C., Girma, B., Kissel, E. S., Levy, A. N., MacCracken, S., Mas-trandrea, P. R., and White, L. L., Cambridge University Press, Cambridge, UK and New York, NY, USA, 1132 pp., 2014. Kleman, J., Hattestrand, C., Borgstrom, I., and Stroeven, A.:
Fennoscandian palaeoglaciology reconstructed using a glacial geological inverstion model, J. Glaciol., 43, 283–299, 1997. Koetse, M. J. and Rietveld, P.: The impact of climate change and
weather on transport: An overview of empirical findings, Trans-port. Res. Pt. B, 14, 205–221, 2009.
Kont, A., Jaagus, J., and Aunap, R.: Climate change scenarios and the effect of sea-level rise for Estonia, Global Planet. Change, 36, 1–15, 2003.
Lång, L.-O., Olofsson, B., Mellqvist, E., Ojala, L., Maxe, L., and Thorsbrink, M.: Miljömålsuppföljning av grundvatten i kus-tområden – statusbeskrivning och diskussionsunderlag, SGU-rapport 2006:24, SGU, 44 pp., 2006.
Lange, E.: Saltvattenpåverkan i Gotlands dricksvattenbrunnar vid stigande havsnivåer, Undergraduate thesis in hydrology and hy-drogeologi, HG11, Stockholm University, Stockholm, 2013. Lantmäteriet (Swedish National Land Survey): Product
descrip-tion: GSD-Elevation data, Grid 2x, available at: https://www. lantmateriet.se/globalassets/kartor-och-geografisk-information/
hojddata/produktbeskrivningar/eng/e_grid2_plus.pdf (last
access: 23 Febuary 2016), 2015.
Lewsey, C., Cid, G., and Kruse, E.: Assessing climate change im-pacts on coastal infrastructure in the Eastern Caribbean, Mar. Policy, 28, 393–409, 2004.
Libkovska, U. and Zilniece, I: Environment and health manage-ment in the Baltic Sea coastal municipalities: Resort develop-ment opportunities, 15th International Multidisciplinary Scien-tific GeoConference Surveying Geology and Mining Ecology Management, 18–24 June 2015, SGEM, Albena, Bulgaria, 235– 242, 2015.
Lindberg, J., Olofsson, B., Gumbricht,T.: Risk mapping of ground-water salinization using Geographical Information Systems, 14th Salt Water Intrusion Meeting (SWIM), SGU Rapporter och Meddelanden no. 87, 16–21 June 1996, Malmö, Sweden, 188– 197, 1996.
Luoma, S. and Okkonen, J.: Impacts of Future Climate Change and Baltic Sea Level Rise on Groundwater Recharge, Groundwater Levels, and Surface Leakage in the Hanko Aquifer in Southern Finland, Water, 6, 3671–3700, 2014.
Mazi, K., Koussis, A. D., and Destouni, G.: Tipping points for sea-water intrusion in coastal aquifers under rising sea level, Environ. Res. Lett., 8, 014001, doi:10.1088/1748-9326/8/1/014001, 2013. Meier, M., Dyurgerov, M., Rick, U., O’Neel, S., Pfeffer, W., An-derson, R., AnAn-derson, S., and Glazovsky, A.: Glaciers dominate
eustatic sea-level rise in the 21st century, Science, 317, 1064– 1067, 2007.
Neumann, B., Vafeidis, A. T., Zimmermann, J., and Nicholls, R. J.: Future Coastal Population Growth and Exposure to Sea-Level Rise and Coastal Flooding – A Global Assessment, PLoS ONE, 10, e0118571, doi:10.1371/journal.pone.0118571, 2015. Nicholls, R. J., Marinova, N., Lowe, J. A., Brown, S., Vellinga,
P., de Gusmão, D., Hinkel, J., and Tol, R. S. J.: Sea-Level Rise
and its Possible Impacts Given a “Beyond 4◦C World” in the
Twenty-First Century, Philos. T. Roy. Soc. A, 369, 161–181, 2011.
Olsson R., i samarbete med HagmarksMistras forskare: Hävd av strandängar, Mångfaldsmarker: Naturbetesmarker – en värdefull resurs, Alfaprint, Centrum för Biologisk Mångfald, Solna, 135– 147 2008.
Persson, K., Jarsjö, J., and Destouni, G.: Diffuse hydrological mass transport through catchments: scenario analysis of coupled phys-ical and biogeochemphys-ical uncertainty effects, Hydrol. Earth Syst. Sci., 15, 3195–3206, doi:10.5194/hess-15-3195-2011, 2011. Rasmussen, P., Sonnenborg, T. O., Goncear, G., and Hinsby, K.:
As-sessing impacts of climate change, sea level rise, and drainage canals on saltwater intrusion to coastal aquifer, Hydrol. Earth Syst. Sci., 17, 421–443, doi:10.5194/hess-17-421-2013, 2013. Raymond, C. M., Fazey, I., Reed, M. S., Stringer, L. C., Robinson,
G. M., and Evely, A. C.: Integrating local and scientific knowl-edge for environmental management, J. Environ. Manage., 91, 1766–1777, 2010.
Renn, O., Klinke, A., and van Asselt, M.: Coping with complexity, uncertainty and ambiguity in risk governance: a synthesis, Am-bio, 40, 231–246, 2011.
Pradhan, B.: Use of GIS-based fuzzy logic relations and its cross application to produce landslide susceptibility maps in three test areas in Malaysia, Environ. Earth Sci., 63, 329–349, 2010. Region Gotland: Gotland i Siffror, available at: http://www.gotland.
se/64224, last access: 29 October 2014.
Sales, R. F. M.: Vulnerability and adaptation of coastal communities to climate variability and sea-level rise: Their implications for in-tegrated coastal management in Cavite City, Philippines, Ocean Coast. Manage., 52, 395–404, 2009.
Sazvar, P.: Metodik för beräkning och utvärdering av vattentillgång i kustnära områden. KTH Land and water resource engeneer-ing, TRITA-LWR Degree Project, Royal Institute of Technology, Stockholm, Sweden, 2010.
Sharma, L. P., Patel, N., Ghose, M. K., and Debnath, P.: Synergistic application of fuzzy logic and geo-informatics for landslide vul-nerability zonation – a case study in Sikkim Himalayas, India, GEM – Int. J. Geomath., 5, 271–284, 2013.
Sherif, M. M. and Singh, V. P.: Effect of climate change on sea water intrusion in coastal aquifers, Hydrol. Process., 13, 1277– 1287, 1999.
Small, C. and Nicholls, R. J.: A global analysis of human settlement in coastal zones, J. Coast. Res., 19, 584–599, 2003.
Stroeve, J., Holland, M., Meier, W., Scambos, T., and Serreze, M.: Arctic sea ice decline: faster than forecast, Geophys. Res. Lett., 34, L09501, doi:10.1029/2007GL029703, 2007.
Torresan, S., Critto, A., Rizzi, J., and Marcomini, A.: Assessment of coastal vulnerability to climate change hazards at the regional scale: the case study of the North Adriatic Sea, Nat. Hazards Earth Syst. Sci., 12, 2347–2368, doi:10.5194/nhess-12-2347-2012, 2012.
Vias, J., Andrea, B., Perles, M., and Carrasco, F.: A comparative study of four schemes for groundwater vulnerability mapping in a diffuse flow carbonate aquifer under Mediterranean climatic conditions, Environ. Geol., 47, 586–595, 2005.