Image decomposition as a tool for validating stress analysis
models
Amol Patki1, Weizhuo Wang2, John Mottershead2, Eann Patterson1a 1
Composite Vehicle Research Center, Michigan State University, East Lansing, MI, USA 2
School of Engineering, University of Liverpool, Liverpool, UK
Abstract. It is good practice to validate analytical and numerical models used in stress analysis for engineering design by comparison with measurements obtained from real components either in-service or in the laboratory. In reality, this critical step is often neglected or reduced to placing a single strain gage at the predicted hot-spot of stress. Modern techniques of optical analysis allow full-field maps of displacement, strain and, or stress to be obtained from real components with relative ease and at modest cost. However, validations continued to be performed only at predicted and, or observed hot-spots and most of the wealth of data is ignored. It is proposed that image decomposition methods, commonly employed in techniques such as fingerprinting and iris recognition, can be employed to validate stress analysis models by comparing all of the key features in the data from the experiment and the model. Image decomposition techniques such as Zernike moments and Fourier transforms have been used to decompose full-field distributions for strain generated from optical techniques such as digital image correlation and thermoelastic stress analysis as well as from analytical and numerical models by treating the strain distributions as images. The result of the decomposition is 101 to 102 image descriptors instead of the 105 or 106 pixels in the original data. As a consequence, it is relatively easy to make a statistical comparison of the image descriptors from the experiment and from the analytical/numerical model and to provide a quantitative assessment of the stress analysis.
1 Introduction
In modern engineering, computational modelling dominates as the principal tool for assessing the structural integrity of load bearing components and structures. This is particularly true in the design process where computational models allow engineers to explore many design iterations at a
a
email: [email protected]
© Owned by the authors, published by EDP Sciences, 2010 DOI:10.1051/epjconf/20100646005
relatively low cost per iteration. The reliability and accuracy of such models is therefore of paramount importance in ensuring the components and structures designed using this approach are fit for purpose and safe. Guidelines have been established for the verification and validation of computational models in solid mechanics [1] though they do not describe procedures. In this context, verification implies the checking of computer algorithms for errors and the assessment of errors derived from the assumptions in the model and from discretization processes used to create the model. Validation is the process of evaluating the extent to which the model is a good representation of the real world. This evaluation requires a comparison to be made between data obtained from the model and measurements made in the real world. Ideally, experiments should be designed for the specific purpose of making such a comparison [1].
It is common practice to identify the locations of high stress in a component using the computational model and to affix a strain gauge at this location on a prototype. Then data from the strain gauge is used to validate the computational model. This approach is better than not conducting a validation; however it is inadequate since it relies on the computational model accurately identifying the area of maximum stress. It is possible to obtain excellent correlation between the data from experiment and computational model at the location of maximum stress identified by the computational model and for the model to be wrong; either because the maximum stress in the real-world is at another location not identified by the model, or because the stress distribution in other, less heavily loaded locations is inaccurately represented. The latter case can be problematic when later design iterations involve the removal of material at less heavily loaded locations in order to save weight.
Various techniques in experimental mechanics have been advanced in recent years to the stage where detailed maps of deformation, strain and stress can be obtained from experiments. Techniques such as digital image correlation, electronic speckle pattern interferometry and thermoelasticity can be used to provide maps of stress components over a large field of view for prototypes or engineering components subject to service loads. The spatial and temporal resolution of this data can be very high and presents both an opportunity and a challenge for validating computational models. The scale and extent of the data from these techniques presents an opportunity for detailed validation of a computational model across the whole geometry of a component for a wide range of loading cases. The challenge is making a meaningful comparison between enormous datasets that could contain stress data at millions of locations.
In this paper it is proposed that image decomposition is used to extract the essential features from maps of stress obtained from both experiments and computational models; and that the comparison for the purpose of validation is performed using these features, commonly known as shape descriptors. The potential advantage of such an approach is that it is based on the entire dataset (maybe 105 or 106 pixels) and yet the comparison is conducted using only a relatively small number of shape descriptors (perhaps 101 or 102) that completely described the datasets.
2 Stress analysis details
2.1 Experiments
A coupon was machined from an Aluminum plate of thickness 3mm. The coupon was of length 140mm and width 50mm with a central hole of diameter 25mm. The surface of the plate was spray-painted using black and white paint to obtain a speckle pattern for digital image correlation. The coupon was held in the servo-hydraulic test machine using a set of hydraulic grips over a central 25.4mm at each end of the coupon applying a maximum static load of 8000N which was reached in steps of 500N. Images of the speckled surface were captured at every load step with a CCD camera aligned with the CCD parallel to the specimen surface which was illuminated by a ring light located concentrically on the camera lens. The images were used to perform 2D digital image correlation using the Istra4D software (Dantec Dynamics GmbH, Ulm, Germany) to obtain full-field displacement and strain maps of the specimen. Prior to the test a calibration for digital image correlation was performed using an 8mm calibration target.
2.2 Computational model
A two-dimensional finite element model of the coupon was produced using the ANSYS finite element package. The elements were linear quadrilateral and were arranged in a structured mesh. A mesh convergence study demonstrated that 4,000 elements were required to provide a reliable result. The material properties of Aluminum 2024T6 were employed and no plastic deformation was permitted. The boundary conditions in the model consisted of fixed zero displacement along the loading direction over a centred length of 25.4mm at one end and a uniform pressure over a centred length of 25.4mm at the opposite end.
3 Image decomposition
3.1 Zernike moments
Fig. 1. Contours of maximum principal stress obtained by experiment for the tensile coupon with a central hole (left) and the Zernike moments describing the contours generated using a maximum of order, n=20 (right).
3.2 Discrete Fourier Transform
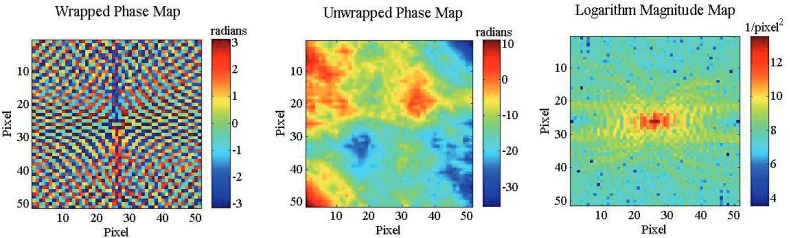
A DFT was applied to the experimental data and the results are shown in figure 2. The dynamic range of the Fourier coefficients is too large to be properly represented using a conventional linear grey-scale so a logarithmic scale has been used. The data is a form of shape or contour descriptor since the plot of the Fourier coefficients indicates the magnitudes of the frequency components with lower frequencies at the center; and phase map shows the phase of each corresponding frequency component. Often the phase data does not give very much additional insight about the structure of the contour in the spatial domain; however it does contain information that is essential to the reconstruction process. In terms of its potential for use in comparing data from experiment and computational modelling the DFT is of limited value on its own since it does not achieve any reduction in the quantity of data; indeed there is an increase since there is a magnitude and phase map for each stress contour map. However, the results from the DFT are invariant to rotation, scaling and transformation in the spatial domain which renders them suitable as shape descriptors [6].
Fig. 2. Wrapped phase (left), unwrapped phase (center) and logarithm magnitude (right) of the frequency components of the experimental data in Fig. 1, obtained using a Discrete Fourier Transform (DFT).
3.3 Fourier-Zernike Moments
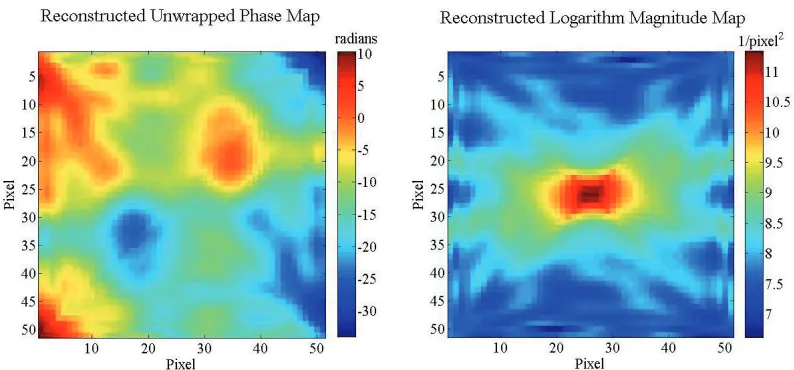
components obtained from the DFT. Examples of the results obtained from this process are shown in figure 3. In this case the logarithm of the magnitude of the frequency components was used in order to reduce the dynamic range that needs to be represented by the Zernike polynomials; and the phase map was unwrapped to generate a continuous shape. As before the order of the polynomials wasn=20; however they yield a good representation of the DFT results (Fig. 4) and hence a good representation of the original contour map of principal stress.
Fig. 3. Zernike moments obtained from polynomials of order, n=20 fitted to the unwrapped phase (left) and logarithm magnitude (right) of the frequency components in Fig. 2 for the experimental data in Fig.1; the inset
graphs have the lower order moments removed to reveal the detail for the higher order moments.
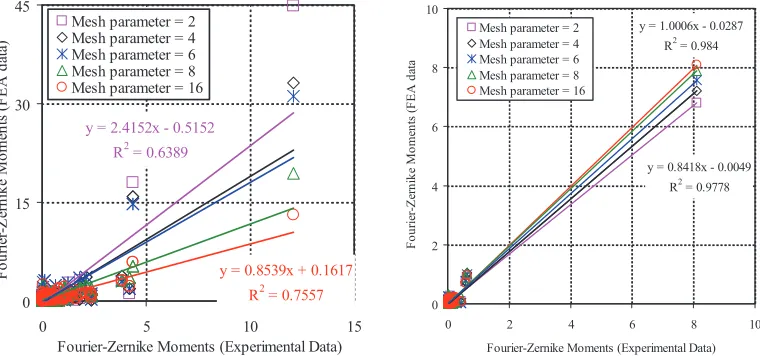
In order to make the comparison necessary for validation of the computational model, the contour map of the maximum principal stress obtained from the finite element model was processed using the DFT to obtain the magnitude and phase of its frequency components. As for the experimental data, Zernike polynomials were fitted to the logarithm of the magnitude and to the unwrapped phase of the frequency components in order to compute a set of Zernike moments. A simple linear correlation of these moments and the corresponding set from the experimental data was performed as shown in Fig. 5 for a range of mesh density in the numerical simulation.
3 Discussion and Conclusions
The aim of the study described in outline above was to investigate image decomposition as a means of reducing the quantity of data that needs to be handled in comparing full-field, high resolution maps of stress obtained by experimentation and computational simulations. This is a practical requirement of conducting comprehensive validations of detailed computational models using data obtained over a wide field of view using sophisticated techniques of experimental stress analysis. The straightforward application of Zernike moments, which are widely used in other applications due to their robustness to noise, proved unsuccessful as a result of the geometrical discontinuity in the strain map. A number of strategies for resolving this issue were consider that were specific to this geometry; however, since such discontinuities in strain maps are common for engineering components, a more generic approach was adopted. The Discrete Fourier Transform was applied to the original data and two continuous maps were created by using the logarithm of the magnitude of the frequency components and by unwrapping the phase of the components. Zernike polynomials of order, n =20 were fitted to these continuous maps in order to generate a set of Zernike moments. Thus, data compression has been achieved from values for stress at thousands of pixels or points to a few hundred moments that accurately represent the shape of the stress contours in the component. In addition, since the DFT and Zernike moments are rotation, scaling and translation invariant, the issues of alignment, scale, and pitch differences in the data from experimentation and simulation are effectively side-stepped.
At the moment a simple correlation of the resultant Zernike moments has been performed and the regression coefficient was found as function of mesh density. For the convergent solution of the mesh (mesh parameter = 16) the regression coefficient on the logarithm of the magnitude was found to be 0.984, suggesting an excellent agreement between the data from the experiment and simulation. More research is required to develop more sophisticated means of correlating sets of Zernike moments and to allow interpretation of the correlation in the context of validation of the computational model; however the work presented here represents an important first step.
y = 1.0006x - 0.0287 R2 = 0.984
y = 0.8418x - 0.0049 R2 = 0.9778
0 2 4 6 8 10
0 2 4 6 8 10
Fourier-Zernike Moments (Experimental Data)
Fo ur ie r-Ze rn ik e M o m ent s ( F EA da ta
Mesh parameter = 2 Mesh parameter = 4 Mesh parameter = 6 Mesh parameter = 8 Mesh parameter = 16
Fig. 5. Zernike moments describing the contours of maximum principal stress from the experiment and the computational model plotted as functions of one another to illustrate the degree of correlation. The Zernike
moments describe the unwrapped phase (left) and logarithm magnitude (right) of the spatial frequency components obtained from the DFT of each original dataset.
y = 0.8539x + 0.1617 R2 = 0.7557
y = 2.4152x - 0.5152 R2 = 0.6389
0 15 30 45
0 5 10 15
Fourier-Zernike Moments (Experimental Data)
Fo ur ie r-Ze rn ik e M o m ent s (F EA da ta )
Mesh parameter = 2
Acknowledgements
Some of the work described here was performed as part of the ADVISE project which is a Seventh Framework Programme Collaborative Project within Theme 7: Transportation including Aeronautics (Grant Agreement no. SCP7-GA-2008-218595).
References
1. L.E. Schwer, Engineering with Computers, 23:245-252 (2007) 2. M.K. Hu, IRE Trans. Inf. Theory, IT-8:179-187 (1962) 3. M.R. Teague, Optical Society of America, 70:920-930 (1980)
4. R.G. Cosgriff, Report no. 820-11 of the Ohio State University Research Foundation (1960) 5. C-W Chong, P. Raveendran, R. Mukundan, Pattern Rocognition, 36:1765-1773 (2003)
6. W. Wang, J. Mottershead, C. Mares, Mechanical Systems and Signal Processing, 23:2088-2112 (2009).
7. V.N. Mahajan, J.Opt. Soc. Am., 71:75-85 (1981).