2 8 0 7 7 1 394X
E X P R E SSIO N , C H A R A C T E R ISA T IO N & ST R U C T U R A L A N A L Y SIS
O F TH E PUTATIVE SLOW V O L T A G E -D E PE N D E N T
PO T A SSIU M C H A N N E L m inK
By
Eric Alexander John Mercer B.Sc. (Hons)
Department o f Biochemistry & Molecular Biology,
Royal Free School o f Medicine,
Rowland Hill Street,
London NW3 2PF.
A thesis submitted in fiilfilment o f the requirements for the degree o f
ProQuest Number: U544247
All rights reserved
INFORMATION TO ALL USERS
The quality of this reproduction is dependent upon the quality of the copy submitted. In the unlikely event that the author did not send a complete manuscript and there are missing pages, these will be noted. Also, if material had to be removed,
a note will indicate the deletion.
uest.
ProQuest U544247
Published by ProQuest LLC(2016). Copyright of the Dissertation is held by the Author. All rights reserved.
This work is protected against unauthorized copying under Title 17, United States Code. Microform Edition © ProQuest LLC.
ProQuest LLC
789 East Eisenhower Parkway P.O. Box 1346
A cknow ledgem ents
I would firstly like to thank my supervisor Dr. Surjit Kaila Singh Srai for his continual support, encouragement and friendship throughout the course o f my Ph.D.
I am indebted to Dr. Bala Ramesh for synthesising peptides, Dr. Alistair Mathie for performing the electrophysiology experiments, and Dr. Richard Brydges for his assistance with the baculovirus expression system.
I would also like to express my thanks to members o f the department who have helped on both the technical side o f my work and from a social aspect, in particular G eoff Abbott, Stephen Brazier, Richard Brydges, Jonathan Hadden and o f course Suijit Kaila Singh Srai.
Abstract
Minimal potassium channel (minK) protein induces very slowly activating voltage-dependent
currents in oocytes. Mutagenesis studies indicated that minK protein is the integral part o f the minK
channel, however, recent studies identified an additional protein required for functional channel activity.
MinK protein consists o f 130 amino acids with one putative transmembrane region and extra- and
intracellular amino and carboxyl domains, respectively. Investigations so far have predominantly been
concerned with the electrophysiological, pharmacological and regulatory aspects o f minK channel,
however, the molecular mechanism o f K^ conduction is only likely to emerge once the structure o f the
channel protein is resolved.
To study the structure o f minK, synthetic peptides and recombinant proteins corresponding to the
functional domains o f minK and complete minK protein were synthesised for structural analysis in both
aqueous and phospholipid environments, using Fourier-transform infrared and Circular Dichroism
spectroscopy. Recombinant proteins corresponding to the carboxyl terminal domain and complete minK
protein were expressed in E. coli and baculovirus/insect cell expression systems. Spectroscopic analysis,
in combination with previous results, indicated that the amino terminal domain adopts predominantly
random structures with its amino teminus inserted in the membrane in an a-helical conformation.
Contrary to previous findings, synthetic peptide corresponding to the transmembrane domain took up a
predominantly a-helical structure in membrane environments. Recombinant carboxyl terminal domain
(62 residues) and synthetic peptide corresponding to the terminal region o f the domain (44 residues)
were insoluble in aqueous buffer, but adopted structures with similar secondary structure content in
micelle environments, consisting o f predominantly a-helical and p-sheet structures, with an additional
minor random element for the synthetic peptide.
Purification o f recombinant minK protein, expressed using both E. coli and baculovirus/insect cell
expression systems, from endogenous host cell proteins proved unsuccessful.
In addition to structural studies, immunohistochemical techniques were applied to both infected insect
cells expressing recombinant minK protein, and small intestinal tissues. In infected insect cells, minK
protein was located in the plasma membrane; however, attempts to record minK channel activity proved
unsuccessful, suggesting that minK protein, in accordance with the literature, requires an additional
protein for functional channel activity. Furthermore, in both infected and control cells, a previously
unreported minK-like, but pharmacologically distinct, channel activity was observed. In jejunum and
ileum, minK protein was shown to be confined to the apical membrane o f epithelial cells, a finding
consistent with the distribution o f the protein in the morphologically and functionally related renal and
Table o f Contents
Acknowledgements...2
Abstract... 3
Table o f C ontents... 4
List o f Figures...13
List o f Tables...24
Abbreviations...25
GENERAL INTRODUCTION...2 9 1 .1 Pr o t e i nc o m p o s i t i o n a n d s t r u c t u r e...31
1.1.1 Proteins... 31
1.1.2 Protein composition... 31
1.1.2.1 Amino acids...32
1.1.2.2 Classification of amino acids... 36
1.1.3 Non-covalent interactions that determine protein conformation... 38
1.1.3 .1 Short-range repulsions... 38
1.1.3.2 Electrostatic interactions...38
1.1.3.3 Hydrogen bonding...39
1.1.3.4 Van der Waal’s interactions... 39
1.1.3.5 The biologically important properties o f water... 40
1.1.3.6 Hydrophobic interactions... 40
1.1.4 Protein structure...41
1.1.4 .1 The structure of the peptide bond... 41
1.1.4.2 Torsion and dihedral angles... 42
1.1.5 The four levels o f protein structure...43
1.1.5 .1 Protein primary structure... 43
1.1.5 .2 Protein secondary structure... 43
1.1.5.3 Supersecondary structure... 47
1.1.5.4 Protein tertiary structure...48
1 .2 Bi o p h y s i c a l t e c h n i q u e s u s e d inp r o t e i n s t r u c t u r ed e t e r m i n a t i o n...4 9
1.2.1 Fourier transfomi-infrared spectroscopy...49
1.2.1.1 The theory underlying infrared spectroscopy... 49
1.2.1.2 Types of normal vibration... 50
1.2.1.3 a-helical structure...52
1.2.1.4 Random structure...52
1.2.1.5 p-sheet structure...53
1.2.1.7 Turns structures... 53
1.2.1.8 3'° helix... 53
1.2.1.9 The advantages of % 0 over H2O for FT-IR spectroscopy... 54
1.2.1.10 Instrumentation... 54
1.2.1.11 Fourier transform infrared spectrometer... 54
1.2.1.12 Buffer subtraction and resolution enhancement...56
1.2.2 Circular Dichroism spectroscopy... 56
1.2.2.1 Parameters and units... 59
1.2.3 Advantages and limitations o f FT-IR and CD spectroscopy...60
1.3 Ex p r e s s i o n Sy s t e m s...61
1.3.1 E. coli expression systems... 61
1.3.2 Yeast expression systems... 64
1.3.3 Baculovirus/insect cell expression system...65
1 .4 Po t a s s i u m c h a n n e l s...6 7 1.4.1 Cloning & characterisation of Shaker potassium channels... 69
1.4.2 Structural diversity of voltage-dependent (Kv) channels in Drosophila... 70
1.4.3 Structural diversity of Ky channels in mammals...70
1.4.4 Classification o f Ky channels...70
1.4.5 Molecular basis of Ky channels... 71
1.4.5.1 The H5 region and its involvement as part of the Ky channel pore...73
1.4.5.2 The S4 voltage sensor... 74
1.4.5.3 Inactivation... 74
1.4.6 Other Ky channels...77
1.4.7 Location o f Ky channels in mammalian cells... 78
1.4.8 Modulation of Ky chamiel activity by intracellular signals... 78
1.5 Min i m a lp o t a s s i u m c h a n n e l...80
1.5.1 Site-directed mutagenesis studies on minK protein... 82
1.5.2 Location of minK... 84
1.5.3 Species variations in the minK protein sequence... 84
1.5.4 Effects o f species-specific sequence variations on minK function...85
1.5.5 Regulation of minK... 86
1.5.6 MinK channel function...88
1.5.6.1 Kidney... 88
1.5.6.2 Uterus... 90
1.5.6.3 Heart...90
1.5.7 Molecular basis of minK regulation by oxidation and chelation (Figure 1.32)...92
1.5.8 Subunit composition of minK channel... 95
1.5.9 MinK protein as an ion channel activator...98
1.5.10 Secondary structure information on minK protein... 98
1.6 Ai m s...100
STRUCTURAL ANALYSIS OF A SYNTHETIC PEPTIDE CORRESPONDING TO THE PUTATIVE TRANSMEMBRANE DOM AIN OF minK PROTEIN...103
2.1 In t r o d u c t i o n...103
2.2.1 Materials... 106
2.2.2 Peptide Synthesis...106
2.2.3.1 Dialysis Method... 107
2.2.3 2 Film Method...107
2.2.4 FT-IR Spectroscopy... 107
2.2.5 CD spectroscopy... 108
2.3 Re s u l t s...109
2.3 .1 FT-IR spectra... 109
2.3.1.1 Peptide in aqueous buffer...109
2.3.1.2 Peptide in phospholipid membranes reconstituted by the Dialysis Method...111
2.3 .1.3 Peptide in phospholipid membranes reconstituted by the Film Method... 111
2.3.2 CD Spectra... 113
STRUCTURAL ANALYSIS OF A SYNTHETIC PEPTIDE CORRESPONDING TO
THE AMINO TERMINAL DOMAIN OF minK PR O T E IN ... 119
3.1 In t r o d u c t i o n...119
3 .2 Ma t e r i a l s & Me t h o d s... 123
3.2.1 Peptide synthesis... 123
3.2.2 Sample preparation for FT-IR spectroscopy...123
3.2.3 FT-IR spectroscopy...123
3.2.4 Sample preparation for CD spectroscopy... 123
3.2.5 CD spectroscopy... 124
3 .3 Re s u l t s...125
3.3.1 FT-IR spectra...125
3.3.1.1 Peptide in aqueous buffer... 125
3.3.1.2 Peptide in membrane environments... 125
3.3.2 CD spectra... 127
3 .4 Di s c u s s i o n... 1 2 9 STRUCTURAL ANALYSIS OF A SYNTHETIC PEPTIDE CORRESPONDING TO THE CARBOXYL TERMINAL REGION OF minK PROTEIN... 133
4 .1 In t r o d u c t i o n...133
4.2 Materials & Methods...136
4.2.1 Peptide synthesis... 136
4.2.2 Sample preparation for FT-IR spectroscopy...136
4.2.3 FT-IR spectroscopy...136
4.2.4 Sample preparation for CD spectroscopy... 137
4.2.5 CD spectroscopy... 137
4 .3 Re s u l t s... 138
4.3.1 FT-IR spectra...138
4.3.1.1 Peptide in aqueous buffer... 138
4.3.1.2 Peptide in SDS micelles... 138
4.3.1.3 Peptide in phospholipid environments... 138
4.3.2 CD Spectroscopy... 140
EXPRESSION, PURIFICATION AND STRUCTURAL ANALYSIS OF
RECOMBINANT PROTEIN CORRESPONDING TO THE CARBOXYL TERMINAL
DOMAIN OF minK PROTEIN... 145
5.1 In t r o d u c t i o n...145
5 .2 Ma t e r i a l s & Me t h o d s... 14 9 5.2.1 Production of antiserum “antiCTR” ... 149
5.2.1.1 Preparation of peptide-conjugate...149
5.2.1.2 Immunisation o f rabbits with peptide-conjugate... 150
5.2.1.3 Isolation, treatment and storage of serum... 150
5.2.1.4 Enzyme-linked Immunosorbent Assay (ELISA)... 150
5.2.1.5 Results & Conclusions on the production of antiCTR in rabbits... 151
5.2.2 Isolation of total RNA... 153
5.2.3 Quantification of RNA... 153
5.2.4 Purification of RNA...154
5.2.4.1 Phenol:chloroform:isoamylalcohol extraction...154
5.2.4.2 Ethanol or Isopropanol precipitation... 155
5.2.5 Agarose gel electrophoresis... 155
5.2.6 Electrophoresis of RNA...155
5.2.7 cDNA synthesis and amplification of minK gene...156
5.2.7.1 Designing of the primers...156
5.2.7.2 cDNA synthesis... 157
5 .1 1 3 Polymerase Chain Reaction (PCR)... 157
5.2.8 Electrophoresis o f DNA...158
5.2.9 Purification of minK cDNA from agarose gels... 159
5.2.10 “Filling in” of 5’ overhang of PCR product using DNA Polymerase 1 (Klenow fragment)... 159
5.2.11 Purification of DNA following enzymic reaction...160
5.2.12 Phosphorylation of DNA using T4 Polynucleotide Kinase... 160
5.2.13 Vectors... 160
5.2.14 Preparation of pUC 19 vector D N A ...161
5.2.15 Cutting o f pUC 19 DNA with the endonuclease Sma 1 ...161
5.2.16 Dephosphorylation o f pUC 19 using Calf Intestine Alkaline Phosphatase (C.I.P.)...162
5.2.17 Ligation of PCR product {minK gene) into pUC 19 using T4 DNA Ligase 162 5.2.18 Escherichia coli... 162
5.2.19 Storage and growth of bacterial cultures... 163
5.2.21 Preparation of competent cells... 164
5.2.22 Transformation of E. coli with recombinant vector D N A ... 164
5.2.23 Isolation of vector DNA ...165
5.2.24 Endonuclease analysis of recombinant vector DNA... 166
5.2.25 DNA Sequencing...166
5.2.26 Subcloning of cDNA corresponding to the CTDminK into pGEX 2T ... 168
5.2.27 Expression of GST/CTDminK fusion protein for SDS PAGE and Western blot analysis... 169
5.2.28 SDS PAGE with coomassie blue staining...170
5.2.29 Western Blot analysis... 170
5.2.30 Expression of GST/CTDminK fusion protein for CDNB Assay...171
5.2.31 l-chloro-2,4-dinitrobenzene (CDNB) A ssay... 171
5.2.32 Large scale expression of GST/CTDminK fusion protein... 172
5.2.33 Extraction of GST/CTDminK fusion protein... 173
5.2.34 Purification of GST/CTDminK fusion protein using glutathione Sepharose 173 5.2.35 Thrombin cleavage of GST/CTDminK fusion protein...174
5.2.36 FPLC...174
5.2.37 Reverse phase HPLC... 174
5.2.38 Sample preparation for spectroscopic analysis... 175
5.2.39 CD spectroscopy... 176
5.3 Re s u l t s... 177
5.3.1 RNA isolation...177
5.3.2 cDNA synthesis & PCR...177
5.3.3 Analysis of cDNA ligated into pUC 19... 177
5.3.4 Subcloning of CTDminK cDNA into pGEX 2T... 181
5.3.5 Expression of GST/CTDminK fusion protein... 183
5.3.6 Purification of the CTDminK... 187
5.3.7 FPLC... 190
5.3.8 Reverse phase HPLC... 190
5.3.9 CD spectroscopy... 195
5.4 Di s c u s s i o n...197
EXPRESSION & PURIFICATION OF minK PR O T E IN ...201
6.1 In t r o d u c t i o n...201
6.2 Ma t e r i a l a n d Me t h o d s... 203
6.2.2 Expression, extraction, detection, purification and analysis of recombinant minK
protein using the pGEX Gene Fusion System... 203
6.2.3 Tlirombin cleavage of GST/minK fusion protein while bound to the glutathione Sepharose...204
6.2.4 Expression o f minK protein using the pTrcHis expression system...204
6.2.5 Expression of histag/minK fusion protein for SDS PAGE and Western blot analysis... 205
6.2.6 Large scale expression and extraction of histag/minK fusion protein... 205
6.2.7 Purification of histag/minK fusion protein using ProBond™ resin...205
6.2.8 Concentration o f fusion protein... 206
6.2.9 Enterokinase cleavage of histag/minK fusion protein...206
6 .3 Re s u l t s... 2 0 8 6.3.1 Subcloning of minK cDNA into pGEX 2T and pTrcHis A ...208
6.3.2 Expression of GST/minK fusion protein...208
6.3.3 Purification of GST/minK... 212
6.3.4 Expression of histag/minK fusion protein...212
6.3.5 Purification of histag/minK fusion protein...214
6.3.6 Enterokinase cleavage o f histag/minK fusion protein...214
6 .4 Di s c u s s i o n... 2 1 7 EXPRESSION OF minK PROTEIN IN S f l \ INSECT CELLS USING THE BACULOVIRUS EXPRESSION SYSTEM: PURIFICATION & ELECTROPHYSIOLOGICAL ST U D IE S... 221
7 .1 In t r o d u c t i o n... 2 2 1 7.1.1 The baculovirus/insect cell expression system...221
7.1.2 Aims...222
7 .2 Ma t e r i a l s & m e t h o d s... 2 2 3 7.2.1 The baculovirus/insect cell expression system... 223
7.2.2 Clontech BacPAK™ system... 223
7.2.3 Subcloning of minK cDNA into the vector pBacPAK 8 ... 224
7.2.4 Insect cell culture...226
7.2.4.1 Establishing the 1 cell line...226
7.2.4.2 Subculture of 1 monolayers...226
7.2.4.3 Storage of insect cells in liquid nitrogen... 227
7.2.4.4 Thawing o f insect cells... 227
7.2.5.1 Generating a recombinant virus... 227
1.2.52 Isolation of recombinant viruses... 228
7.2.6 Virus propagation and evaluation...229
7.2.6.1 Preparation of Passage One virus stock... 229
1.2.6.2 Evaluation of recombinant viruses... 230
7.2.7 Storage and amplification of recombinant viruses... 230
7.2.7.1 Storage... 230
7.2.7.2 Amplification of recombinant viruses... 230
7.2.8 Determination o f titre of Passage Two virus stock... 231
7.2.9 Large-scale minK protein production... 231
7.2.11 Preparation of cells for Western blot analysis...231
7.2.12 Immunocytochemistry...232
7.2.13 Electrophysiology... 232
7.2.13.1 Recording solutions... 232
7.2.13.2 Electrophysicalogical recordings and analysis...233
7.2.14 Preparation of membranes from infected . ^ 1 insect cells...233
7.2.15 Deglycosylation o f .^ 1 insect cell membranes...234
7.2.16 Large scale purification of recombinant minK protein... 234
7.2.17 Preparation of AfFi-Gel Hz immunoafFinity column...235
7.2.17.1 Immunoprécipitation of IgGs from rabbit antiserum...235
7.2.17.2 Oxidation of IgG with sodium periodate...235
7.2.17.3 Coupling o f oxidised IgG to Affi-Gel Hz (hydrazide) resin...235
7.2.18 Binding of recombinant minK protein to Affi-Gel Hz (hydrazide) resin... 236
7.2 .19 Elution of minK from Affi-Gel Hz (hydrazide) resin... 236
7.2.20 Western blot analysis... 237
7 .3 R e s u l t s ...2 3 8 7.3.1 Subcloning of the minK gene into the pBacPAK 8 vector... 238
7.3.2 Western blot analysis of cells infected with recombinant virus and non- infected insect cells...238
7.3.3 Analysis o f glycosylation states of recombinant minK protein... 238
7.3.4 Cellular location of minK protein in infected insect cells... 241
7.3.5 Electrophysiology...243
7.3.6 Purification of minK protein... 248
7.3.6.1 Extraction and binding... 248
IMMUNOHISTOCHEMICAL LOCALISATION OF minK PROTEIN IN SMALL
INTESTINAL T IS SU E S ... 255
8.1 In t r o d u c t i o n... 255
8.2 Ma t e r i a l s & Me t h o d s... 257
8.2.1 Production of antisera...257
8.2.2 Immunohistochemistry...257
8.2.2.1 Preparation o f tissue sections...257
8.2.2.2 Immunoaffinity reactions... 257
8.2.2.3 Visualisation... 258
8.2.2.4 Immunohistochemical preparation of sections for confocal microscopy 258 8.2.2.5 Controls... 258
8.3 Re s u l t s... 259
8.4 Di s c u s s i o n... 265
CONCLUSIONS & FUTURE WORK... 268
R eferences... 271
List o f Figures
Figure 1.1: The general formula o f an amino acid...31
Figure 1.2: The structure o f the glycine side chain... 32
Figure 1.3: The structures o f alanine, valine, leucine and isoleucine sidechains... 32
Figure 1.4: The structure o f the proline sidechain...33
Figure 1.5: The structures o f serine and threonine sidechains...33
Figure 1.6: The structures o f the aspartic acid and glutamic acid sidechains... 33
Figure 1.7: The structures o f the asparagine and glutamate sidechains... 34
Figure 1.8: The structures o f the lysine and arginine sidechains...34
Figure 1.9: The structure o f the histidine sidechain...35
Figure 1.10: The structures o f the phenylalanine, tryptophan and tyrosine sidechains. . 35
Figure 1.11: The structures o f the methionine and cysteine sidechains...36
Figure 1.12: The charge distribution on a water molecule...40
Figure 1.13: The dimensions o f the peptide bond... 41
Figure 1.14: The partial double bond character o f the peptide bond...42
Figure 1.15: The cis or trans conformations o f the peptide bond... 42
Figure 1.16: Structure o f an a-helix...43
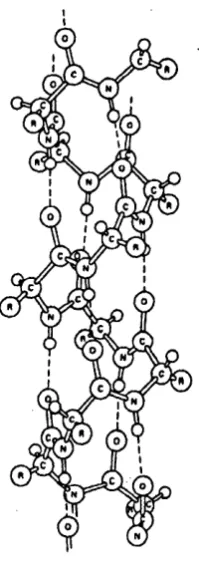
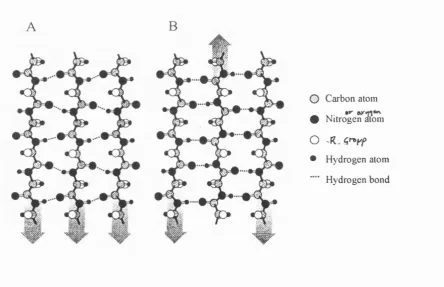
Figure 1.17: (A) Parallel p-sheet and (B) Antiparallel P-sheet... 46
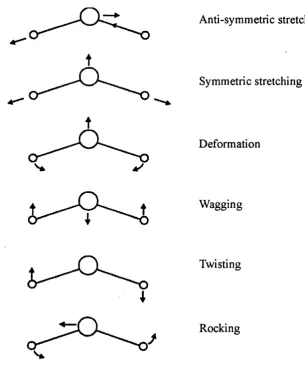
Figure 1.19: The predominant vibrations that give rise to the amide I & amide II
bands... 51
Figure 1.20: An idealised Michelson interferometer... 55
Figure 1.21: Illustration o f monochromatic, linearly polarised light at constant time. ...57
Figure 1.22: Diagrammatic representation o f right polarised light...57
Figure 1.23: Far-UV CD spectra for polypeptides in different secondary structure conformations... 59
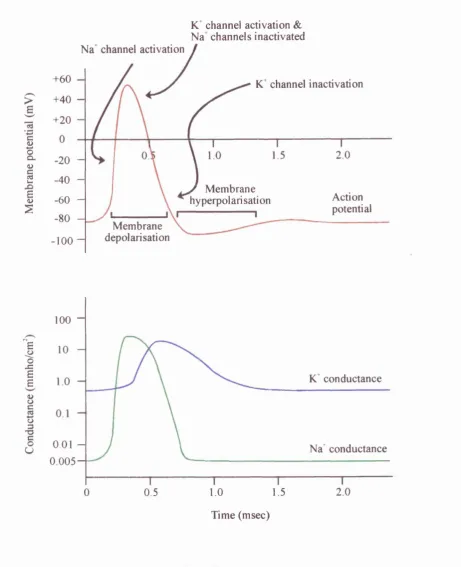
Figure 1.24: Representation o f a typical action potential, and the corresponding Na^ and conductance changes during the action potential course... 68
Figure 1.25: Schematic model o f a voltage-dependent potassium channel subunit...72
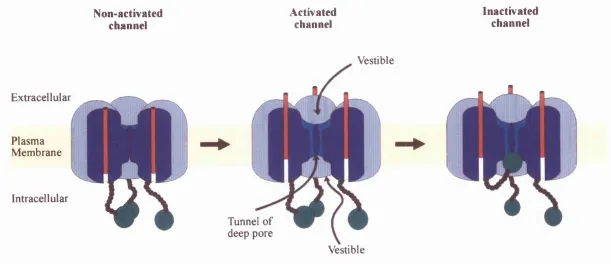
Figure 1.26: Schematic model o f activation and N-type inactivation o f voltage-dependent channels.
The most anterior o f the channel tetramer has been removed to reveal the pore, its tunnel and inner and outer vestibules. The S4 helical voltage sensor is represented by a red cylinder and the amino terminal inactivation structure is shown as a green ball... 76
Figure 1.27: Schematic model o f minK protein based on hydropathy plot analysis...81
Figure 1.28: Schematic diagram showing the position o f point mutations in the putative transmembrane domain o f minK protein and their effect on minK channel properties. ...83
Figure 1.29: Amino acid sequences o f the cloned minK proteins...85
Figure 1.30: A model o f minK channel function in proximal tubule epithelial cells...89
Figure 1.31: Proposed action o f Hg^^ and peroxides on minK... 94
Figure 2.2: Absorbance (left) and second derivative (right) spectra o f synthetic peptide corresponding to the transmembrane domain o f minK in ^H20 PBS pH 7.4 (AB),
PBS pH 7.4 / LPC micelles prepared using the D ialysis M eth od (CD), and ^H20 PBS pH 7.4 / DMPC vesicles prepared using the D ialysis M eth od (EF)...110
Figure 2.3: Absorbance (left) and second derivative (right) spectra o f synthetic peptide corresponding to the transmembrane domain o f minK in ^H20 PBS pH 7.4 / LPC micelles prepared using the Film M eth od (AB), and ^H20 PBS pH 7.4 / DMPC vesicles prepared using the Film M eth od (C D )...112
Figure 2.4: Far-UV CD spectra o f synthetic peptide corresponding to the
transmembrane domain o f minK protein in phosphate buffer (80mM N a2HP0 4, 20mM NaH2P0 4, pH 7.4) / LPC micelles prepared using both the D ialysis and Film M ethods. 114
Figure 3.1: Model o f minK protein based on hydropathy plot analysis, showing the amino acid sequence to be synthesised corresponding to the amino terminal domain, and its potential glycosylation and Hg^^ interacting sites...123
Figure 3.2: Absorbance (left) and second derivative (right) spectra o f synthetic minK amino terminal domain in ^H20 PBS pH 7.4 (AB), ^H20 PBS pH 7.4 containing either LPC micelles (CD) or DMPC vesicles (EF)... 126
Figure 3.3: Far-UV CD spectra o f synthetic minK amino terminal domain in methanol, phosphate buffer (80mM Na2HP0 4, 20mM NaH2P0 4, pH 7.4), or phosphate buffer containing either LPC or SDS micelles...128
Figure 4.1: Model o f minK protein based on hydropathy plot analysis, showing the amino acid sequence to be synthesised corresponding to the carboxyl terminal region (blue, green & red)... 135
Figure 4.2: Absorbance (left) and second derivative (right) spectra o f synthetic minK carboxyl terminal region in ^H20 PBS pH 7.4 (AB), ^H20 PBS pH 7.4 containing SDS micelles (C D )... 139
Figure 4.3: Far-UV CD spectra o f synthetic minK amino terminal domain in methanol or phosphate buffer (80mM Na2HP0 4, 20mM NaH2P0 4, pH 7.4) containing either LPC or SDS micelles...141
Figure 4.4: The sequence o f the carboxyl terminal domain o f minK protein showing the amino acid class o f each residue based on the ionic properties its side chain at
Figure 5.1: Model o f minK protein based on hydropathy plot analysis, showing the amino acid sequence to be synthesised corresponding to the carboxyl terminal domain o f minK protein (CTDminK)...145
Figure 5.2: Overview o f the procedure for cloning the m inK gene into the cloning vector pUC 19... 147
Figure 5.3: Schematic representation o f the pGEX 2T expression vector... 148
Figure 5.4: Analysis o f pre-immune sera and anti-sera titres against synthetic peptide corresponding to the carboxyl terminal region o f minK protein by ELISA.
Serum was obtained from rabbits 363 & 364 pre- and post-immunisation. Plates were coated with peptide, blocked and incubated with both primary and secondary antibody, as outlined in Section 5.2.1.4. Bound antibody was detected by the addition o f p-nitrophenyl phosphate, which yielded yellow p-nitrophenol upon hydrolysis. The latter was quntified by its absorbance at 405nm ... 152
Figure 5.5: Denaturing agarose gel electrophoresis o f RNA purified from rat kidey. Lane 1) RNA standards. Lanes 2-4) lOpg purified R N A ... 178
Figure 5.6: Agarose gel electrophoresis o f minK cD N A amplified by Polymerase Chain Reaction (PCR).
Lane 1) PCR products using Primer 1. Lane 2) PCR products using Primer 2. Lane 3) pBR322/HaeIII/BAP D N A markers. Lanes 4-10) PCR products using Primer 1 & 2.. 178
Figure 5.7: Analysis o f the orientation o f minK cD N A in the Sma 1 site o f pUC 19... 179
Figure 5.8: Agarose gel electrophoresis o f endonuclease digestion analysis o f pUC 19/minK cDNA.
Lane 1) Kilobase marker DNA. Lane 2) Uncut pUC 19/minK cDNA. Lane 3) pUC 19/minK cD N A - H indlW . Lane 4) pUC 19/minK cD N A - Eco R l. Lane 5)
pUC 19/minK cD N A - H ind III & Eco R l ... 180
Figure 5.9: Agarose gel electrophoresis o f endonuclease digestion analysis o f minK cD N A excised from pUC 19/minK cD N A using H ind III & E co R l .
Figure 5.10: Agarose gel electrophoresis o f endonuclease digestion o f minK cD N A with Sau 3 A, generating a cD N A fragment corresponding to the carboxyl terminal domain o f minK.
Lane 1) Kilobase marker DNA. Lane 2) Uncut minK cDNA. Lane 3) Mink cD N A -S a u 3 K... 182
Figure 5.11: SDS PAGE analysis o f the sarkosyl soluble proteins o f E. coli, transformed with pGEX 2T/CTDminK DNA, pre- and post-induction with IPTG.
Lane 1) pre-induction. Lane 2) 1 hour post-induction. Lane 3) 2 hours post-induction. Lanes 4-9) 4-8 hours post-induction respectively...184
Figure 5.12: Western blot analysis o f the sarkosyl soluble proteins o ïE . coli, transformed with pGEX 2T/CTDminK DNA, pre- and post induction with IPTG. The primary antibody layer used was antiCTR at a 1:3000 dilution.
Lane 1) 3 hours post-induction. Lane 2) pre-induction...185
Figure 5.13: Analysis o f relative GST/CTDminK fusion protein expression levels in E. coli pre- and post- induction using the CDNB assay.
The sarkosyl soluble protein fraction o f E. coli, transformed with pGEX/CTDminK D N A and induced with IPTG, was prepared as outlined in Section 5.2.30, and from which fractions (3-lOpl) were added to the CDNB master mix. The absorbance o f the sample at 340nm was measured over 5 minutes and AAsWmin/ml calculated using the equation described in Section 5.2.31. AAsWmin/ml was plotted against induction time.
186
Figure 5.14: SDS PAGE analysis o f partially purified GST/CTDminK fusion protein before and after treatment with the protease thrombin.
Lane 1) after treatment with thrombin (lOU thrombin/mg protein). Lane 2) before
treatment with thrombin... 188
Figure 5.15: Western blot analysis o f partially purified GST/CTDminK fusion protein. A) AntiCTR was used as the primary antibody layer at a 1:3000 dilution.
B) Antibodies specific for GST were used as the primary antibody layer at a 1:1000 dilution... 189
Figure 5.16: Western blot analysis o f partially purified GST/CTDminK fusion protein before and after treatment with the protease thrombin.
AntiCTRwas used as the primary antibody layer at a 1:3000 dilution.
Lane 1) after treatment with thrombin (lOU thrombin/mg protein). Lane 2) before
Figure 5.17: Representative FPLC trace o f GST/CTDminK following cleavage o f the protein with thrombin.
Conditions; A Superdex G75 preparative grade column was used with guanidinium HCl pH 7.4 as the eluent... 191
Figure 5.18: Representative reverse phase HPLC trace o f GST/minK following cleavage with thrombin.
Conditions: An analytical VYDAC 208TP54 C8 column used used; eluent A was 0.1% aqueous trifluroacetic acid; eluent B was 90% acetonitrile, 10% A.
Each peak indicated by corresponds to a lane with an equivalent number shown on SDS PAGE (Figure 5.19)...192
Figure 5.19: SDS PAGE analysis o f semi-purified recombinant CTDminK protein partially separated from protein impurities using reverse phase HPLC.
Lanes 1-5 correspond to the protein eluted in peaks 1-5 respectively.
Figure 5.20: SDS PAGE analysis o f the second reverse phase FIPLC protein fraction (Peak 2, Figure 5.19) corresponding to partially purified recombinant CTDminK protein. The protein fraction was eluted in three 1ml subfractions corresponding to Lane 1) subfraction 1. Lane 2) subfraction 3. Lane 3) subfraction 2 ...194
Figure 5.21: Far-UV CD spectrum o f recombinant CTDminK protein in phosphate buffer (80mM Na2HP0 4, 20mM NaH2P0 4, pH 7.4) containing SDS micelles...196
Figure 6.1: Agarose gel electrophoresis o f endonuclease digestion analysis o f pGEX 2T/minK cDNA.
Lane 1) Kilobase marker DNA. Lane 2) Uncut pGEX 2T/minK cDNA. Lane 3) pGEX 2T/minK cD N A - Bam H I . Lane 4) pGEX 2T/minK cD N A - Eco R l . Lane 5) pGEX 2T/minK cD N A - Bam HI & E co R l ... 209
Figure 6.2: Agarose gel electrophoresis o f endonuclease digestion analysis o f pTrcHis A/minK cDNA.
Lane 1) Kilobase marker DNA. Lane 2) Uncut pTrcHis A/minK cDNA. Lane 3)
pTrcHis A 2T/minK cD N A - Bam H I. Lane 4) pTrcHis A/minK cD N A - E co RL Lane 5) pTrcHis A/minK cD N A - Bam HI & E co R l ...209
Figure 6.3: SDS PAGE analysis o f the sarkosyl soluble proteins o ïE . coli, transformed with pGEX 2T/minK D NA, pre- and post-induction with IPTG.
Figure 6.4A: Western blot analysis o f the sarkosyl soluble proteins o f E. coli, transformed with pGEX 2T/minK DNA, pre- and post induction with IPTG.
Lane 1) 3 hours post-induction. Lane 2) pre-induction... 210
Figure 6.4B: Western blot analysis o f purified GST/minK fusion protein before and after treatment with the protease thrombin.
Lane 1) after treatment with thrombin (lOU thrombin/mg protein). Lane 2) before
treatment with thrombin... 210
Figure 6.5: Analysis o f relative GST/minK fusion protein expression levels in E. coli pre- and post- induction using the CDNB assay.
The sarkosyl soluble protein fraction o f E. coli, transformed with pGEX/minK D N A and induced with IPTG, was prepared as outlined in Section 5.2.30, and from which fractions (20-50pl) were added to the CDNB master mix. The absorbance o f the sample at 340nm was measured over 5 minutes and AA34o/min/ml calculated using the equation described in Section 5.2.31. AAsWmin/ml was plotted against induction time...211
Figure 6.6: SDS PAGE analysis o f the protein profile o f E. coli, transformed with pTrcHis A/minK DNA, pre- and post-induction with IPTG.
Lane 1) pre-induction. Lane 2) 1 hour post-induction. Lane3) 2 hours post-induction. Lane 4) 3 hours post-induction. Lane 5) 4 hours post-induction. Lane 6) 5 hours post induction... 213
Figure 6.7: Western blot analysis o f protein profile o f E.coli, transformed with pTrcHis A/minK DNA, pre-and post-induction with IPTG
Lane 1) pre-induction. Lane 2) 2 hours post-induction. Lane 3) 4 hours post-induction. Lane 4) 6 hours post-induction...213
Figure 6.8: SDS PAGE analysis o f the proteins which had been bound to a ProBond™ resin column and subsequently eluted from it with imidazole.
Imidazole was applied at tw o concentrations, 60mM and 160mM, in 20mM Tris-HCl, 500mM NaCl, lOmM CHAPS, pH 7.9 buffer. 4 x 7.5ml fractions (A -D ) o f the lower imidazole concentration solution were used to elute the proteins with low affinity for the resin, and 4 x 1ml fractions (E-H) were used to elute the proteins with high affinity. Lane 1) Fraction A. Lane 2) Fraction B. Lane 3) Fraction C. Lane 4) Fraction D.
Lane 5) Fraction E. Lane 6) Fraction F. Lane 7) Fraction G. Lane 8) FractionH... 215
Figure 6.9: Western blot analysis o f the proteins which had been bound to a ProBond™ resin column and subsequently eluted from with 160mM imidazole in 20mM Tris-HCl, 500mM NaCl, lOmM CHAPS, pH 7.9, buffer.
The proteins were eluted in 4 x 1ml fractions and correspond to Fraction E and Fraction F in Figure 6.6 above.
Figure 6.10: SDS PAGE analysis o f the effect o f the protease, enterokinase, on partially purified histag/minK fusion protein.
Histag/minK fusion protein corresponds to the band with an apparent molecular mass o f approximately 17kDa.
Lane 1) Protein mixture prior to treatment with enterokinase. Lane 2) Treatment o f protein mixture (20pg) with 50 units o f enterokinase. Lane 3) Treatment o f protein mixture (20pg) with 100 units o f enterokinase...216
Figure 7.1: Transfer o f the target gene to the baculovirus expression vector by forced recombination between the transfer vector and the novel BacPAK6 viral D N A ...225
Figure 7.2: Agarose gel electrophoresis o f endonuclease digestion analysis o f pBacPAK 8/minK cDNA.
Lane 1) Kilobase marker DNA. Lane 2) Uncut pBacPAK 8/minK cDNA.
Lane 3) pBacPAK 8/minK cDNA - Bam H I. Lane 4) pBacPAK 8/minK cD N A
-E co R l. Lane 5) pBacPAK 8/minK cDNA - Bam HI & E co R l ... 239
Figure 7.3: Western blot analysis o f control
S fl\
cells andS fl\
insect cells 48 hours post-infection expressing recombinant minK protein.The primary antibody layer was antiCTR at a dilution o f 1:3000.
Lane 1) Control
S fl\
insect cells. Lane 2)S fl\
insect cell 48 hours post-infectionrecombinant virus...239
Figure 7.4: Western blot analysis o f the glycosylation status o f recombinant minK protein expressed in
S fl\
insect cells 48 hours post-infection.The primary antibody layer was antiCTR at a dilution o f 1:3000.
Lane 1) Untreated
Sfl.\
membranes. Lane 2)S fl\
membranes incubated indeglycosylation buffers but in the absence o f enzymes. Lane 3) iSy21 membranes treated with neuraminidase. Lane 4)
S fl\
membranes treated with endoglycosidase F &A-glycosidase F. Lane 5)
S fl\
membranes treated with neuraminidase andendoglycosidase F & A-glycosidase F...240
Figure 7.5: Confocal microscopy o f 48 hour post-infected
S fl\
insect cells and control insect cells following immunofluoroscent labelling.The primary antibody layer was antiCTR (1:200). The secondary antibody was swine anti-rabbit IgG conjugated to FITC (1:80).
A) Control
Sfl
1 cells - secondary antibody layer onlyB ) Control
Sfl
1 cells - primary and secondary antibody layers C) InfectedS fl\
cells - secondary antibody layer onlyFigure 7.6: An example o f a minK-iike current in infected S f i \ insect cells. The current was evoked by steppng to a test potential o f +50m V for 15 seconds following a prepulse for 3 seconds to -80mV from a holding potential o f -70mV. The “time-dependent” current was defined as the difference between the current measured
14.8 seconds aAer the test step “2” and that 0.8 seconds after the test step “ 1”. The dashed line is the zero current level...244
Figure 7.7: A family o f minK-like currents in infected S f l \ cells.
The top records show a family o f currents evoked by the same voltage protocol as Figure 7.6 except that the test potential was changed from -30 to +80mV in lOmV increments. Currents were evoked once every 85seconds. The time-dependent current was measured as for Figure 7.6. The dashed line is the zero current level. The lower graph shows the current-voltage relationship for the time-dependent currents in the upper panel...245
Figure 7.8: MinK-like currents in control and infected S f l\ cells.
The top half o f this figure shows the proportion o f the control and infected cells showing minK-like current at +50m V following stimulation o f the cells with the voltage-protocol shown in Figure 7.6. The lower half shows the amplitude o f the time-dependent current at +50m V in control and infected cells where the current is present... 246
Figure 7.9: MinK-like current is not blocked by clofilium.
Currents were evoked by the voltage protocol shown in Figure 7.6 in a control cell in the absence and presence o f 50p.M clofilium.
The dashed line shows the zero-current level...247
Figure 7.10: Western blot analysis o f the preparative fractions o f infected i^21 cells containing minK protein pre- and post-binding to the immunoaffinity resion.
Lane 3 ) 4 8 hour post-infected S f l \ cells homogenised in buffer containing 2%
Triton X -100 (Fraction 1). Lane 2) Supernatent o f Fraction 1 spun at 100,000 x g for 1 hour at 4®C (Fraction 2). Lane 1) Fraction 2 following incubation with the
Figure 7.11: Western blot analysis o f the proteins eluted from the immunoaffinity resin under different conditions subsequent to the binding o f minK protein.
Following the blocking reaction the blot was incubated first with goat anti-rabbit IgG conjugated to biotin (1:500). The blot was subsequently incubated with antiCTR
(1:3000) and goat anti-rabbit IgG conjugated to alkaline phosphatase (1:1000) followed by the alkaline phosphatase reaction to identify eluted minK protein. The blot was then incubated with Vectastain Reagents specific for biotin and conjugated to hydrogen peroxide followed by hydrogen peroxide developing reagents to identify leached antibody.
Lane 1) 0. IM glycine pH 2.5. Lane 2) 0 .IM acetic acid pH 2.8. Lane3) 0 .15M acetic acid, 0. IM NaCl pH 2.8. Lane 4) 5M KI. Lane 5) 3M M gCb Lane 6) NH4OH. Lane 7) 0.02 M diethanolamine, 0.5% Tween 20 pH 11. Lane 8) IM N a thiocyanate pH 7.6.
... 250
Figure 8.1: Immunohistochemical analysis o f minK protein in rat kidney cortex and heart tissues using either antiCTR or preimmune serum as the primary antibody layer.
A) Kidney cortex - antiCTR
B) Kidney cortex - pre-immune serum C) Heart - antiCTR
D) Heart - pre-immune serum...260
Figure 8.2: Immunohistochemical analysis o f minK protein in rat jejunum and ileum using either antiCTR or preimmune serum as the primary antibody layer.
A) Jejunum - antiCTR
B) Jejunum - pre-immune serum C) Ileum - antiCTR
D) Ileum - pre-immune serum... 261
Figure 8.3: Immunohistochemical analysis o f minK protein in rat jejunum using antiCTR as the primary antibody layer and observed using a confocal microscope.
A) Jejunum - antiCTR B) Jejunum - antiCTR C) Jejunum - antiCTR
D ) Jejunum - secondary antibody layer only...262
Figure 8.4: Immunohistochemical analysis o f minK protein in rat jejunum using antiCTR as the primary antibody layer and observed using a confocal microscope... 263
Figure 8.5: Immunohistochemical analysis o f minK protein in diabetic rat jejunum and ileum using either antiCTR or preimmune serum as the primary antibody layer.
A) Jejunum - antiCTR
List o f Tables
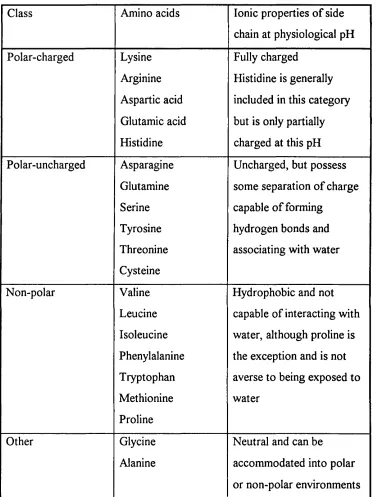
Table 1.1: Classification o f the amino acids... 37
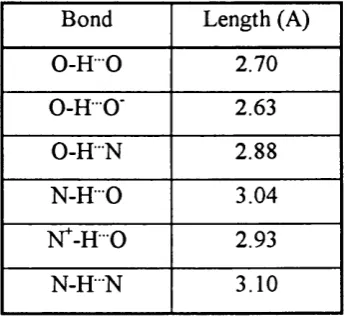
Table 1.2: Different types o f hydrogen bonds and their bond lengths (Schults &
Schirmer, 1979)...39
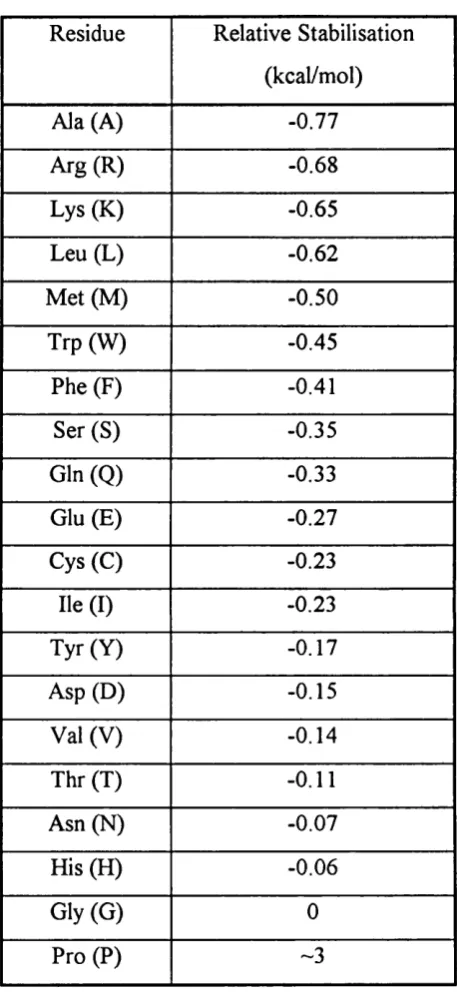
Table 1.3: Relative helical tendencies o f the amino acids...45
A bbreviations
Ac Autographa californica
antiCTR antiserum specific to synthetic peptide corresponding to the carboxyl terminal region o f minK protein
ATP adenosine triphosphate
BAPTA 1,2-bis(2-aminophenoxy)ethane-N,N,N’,N ’-tetraacetic acid
bp base pairs
[Ca^1i intracellular Ca^^ concentration C.I.P. calf intestinal alkaline phosphatase cAMP cyclic adenosine monophosphate
CD Circular Dichroism
cD N A complementary DNA
CDNB 1 -chloro-2,4-dinitrobenzene CHIP channel inducing factor CMC critical micellar concentration
CTDminK carboxyl terminal domain o f minK protein
DAG diacylglycerol
dATP deoxyribonucleoside adenine triphosphate dCTP deoxyribonucleoside cytosine triphosphate dOTP deoxyribonucleoside guanidine triphosphate di-dNTPs di- deoxyribonucleoside triphosphates DMPC dimyristoyl L-a-phosphatidylcholine
DMSO dimethyl sulphoxide
D N A deoxyribonucleic acid
dNTPs deoxyribonucleoside triphosphates DTNP 5,5'-dithiobis(2-nitrobenzoic acid) DTSSP dithio-bis(sulphosuccinimidyl)
DTT dithiothreitol
dTTP deoxyribonucleoside thymidine triphosphate
E. Coli Escherichia coli
R ag Ether-a-go-go
EDTA ethylenediaminaetetraacetic acid, disodium salt ELISA Enzyme-linked Immunosorbent Assay
PCS foetal calf serum
FT-IR Fourier-transform infrared
Gmax maximal conductance
GST glutathione ^'-transferase
HEK human embryo kidney
HEPES (N-[2-hydoxyethyl]piperazine-N’-[2-ethanesulphonic acid]) HPLC High Pressure Liquid Chromatography
HPLC high pressure liquid chromatography
IgG immunoglobulin G
IMS industrial methylated spirits
IP3 inositol triphosphate
IPTG isopropyl P-D-thiogalactoside Kca Calcium activated K^ channel
Kc n g cyclic GMP K^ channel
KIR inwardly rectifying potassium channel KV voltage-dependent potassium channel
LB Luria Bertani
LPC lyso-phosphatidylchloine
M.O.I. multiplicity o f infection MinK Minimal potassium channel
M NPV multiple nuclear polyhedrosis virus MOPS buffer 3-(N-morpholino) propane sulphonic acid
Mr relative molecular mass
mRNA messenger RNA
M TSEA methanethiosulphonate ethylamine M IS E S methanethiosulphonate ethylsulphonate
NaAc sodium acetate
NEM A-ethylmaleimide
NMR nuclear magnetic resonance
CD optical density
PAGE polyacrylamide gel electrophoresis
PB phosphate buffer
PBS phosphate buffered saline
PBSA-T PBS containing sodium cyanide and Tween 20
PCR polymerase chain reaction
p f u plaque forming units
PGP P-glycoprotein
PKC protein kinase C
RNA ribonucleic acid
S. cerevisiae Saccharomyces cerevisiae
SDS sodium docesyl sulphate
S f Spodoptera frvg ip erd a
Slo Slowpoke
STE sodium tris EDTA
sulpho-MBS maleimidobenzoyl-A-hydroxysulphosuccinimide ester
TBE tris borate EDTA
TEA tetraethylammonium
TEMED NNN'N'-tetramethyllenediamide TEA trifluroacetic acid
TM-minK synthetic peptide corresponding to the transmembrane region o f minK protein
TNE tris sodium EDTA
TPBS PBS containing Tween 20
U V ultra-violet
V i/2 half maximal conductance
C H A PT E R ONE
General Introduction
Minimal potassium channel (minK) protein induces a very slowly activating voltage-dependent current (I), Isk, in oocytes (Takumi et al., 1988). MinK protein consists o f
130 amino acids with one putative transmembrane region and extra- and intracellular amino and carboxyl domains respectively. Investigations so far have concentrated on the electrophysiological, pharmacological and regulatory aspects o f minK channel. However, the molecular mechanism o f K^ conduction is only likely to emerge once the structure o f the channel protein is resolved. Consequently, the overall aim o f the project is to determine the secondary structure o f minK protein.
To this end, minK protein has been conceptually divided into its amino terminal, carboxyl terminal and transmembrane domains, and synthetic peptides corresponding these domains are to be synthesised for structural analysis by Fourier transform-infrared (FT-IR) and Circular Dichroism (CD) spectroscopy. Peptide synthesis is constrained by the number o f amino acid residues that can be accurately incorporated into its linear chain. As a result, the peptide corresponding to the carboxyl terminal domain is to consist o f the last 44 amino acids o f the 63 residue carboxyl terminal chain.
To gain structural information on the whole carboxyl terminal region and minK protein in its entirety, the minK gene is to be cloned and recombinant proteins corresponding to the carboxyl terminal region and minK protein are to be synthesised using expression systems for structural analysis by FT-IR and CD analysis.
Before describing the results o f these studies and how they relate to what is known about the function o f potassium channels, one needs to understand how protein composition determines secondary and tertiary structure and how biophysical techniques can be applied to analyse their structure. Furthermore, for the expression o f the recombinant proteins, it is o f importance to understand the abilities and characteristics o f the various expression systems. I have therefore divided the introductory chapter into six parts: 1. Protein composition and structure
4. Potassium channels
5. MinK
General Introduction - Protein Composition & Structure
1.1 Protein com position and structure
1.1.1 P roteins
Proteins are the most versatile group o f biological macromolecules, playing crucial roles in virtually all biological processes. Their remarkable scope o f function included catalysis o f chemical reactions, transport and storage o f small molecules, and the forming o f a large part o f the structural framework o f cells and tissues. Some proteins control the passage o f molecules across biological membranes, and as hormones, proteins transmit the flow o f information between cells and organs. Furthermore, proteins function in the immune system and are involved in the regulation o f gene expression.
1.1.2 Protein com position
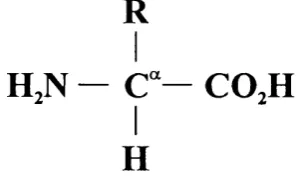
All proteins are polymers, comprising amino acid monomers. O f the 20 amino acids usually found in proteins, 19 have a general structure.
R
HjN — C“— COjH
H
Figure 1.1: The general formula o f an amino acid.
The side chain R is the only alteration in chemical structure between the amino acids. The 20th amino acid is proline, which differs in that its side chain is bonded back to the nitrogen atom. Amino acids are linked to form a protein via the formation o f peptide
General Introduction - Protein Composition & Structure
1.1.2.1 Aniino acids
The 20 amino acid side chains are individually distinct in both their structure and chemical properties. The structure and the corresponding chemical features o f each amino acid side chain are briefly discussed below.
Glycine side chain
Glycine possesses the simplest o f the amino acid side chains, consisting o f a single hydrogen atom. This allows greater conformational flexibility o f the polypeptide backbone than at other residues.^
GLY
Figure 1.2: The structure o f the glycine side chain.
Aliphatic side chains
Alanine, valine, leucine and isoleucine have aliphatic side chains. Their side chains comprise o f inert methylene (CH2) and methyl (CH3) groups. These groups are hydrophobic, tending to act more favourably with each other than with water.
3
ALA VAL
^
LEU ILEFigure 1.3: The structures o f alanine, valine, leucine and isoleucine sidechains.
Proline side chain
General Introduction - Protein Composition & Structure
H2C -C H2 ;cH NH H2C PRO
Figure 1.4: The structure o f the proline sidechain.
H ydroxyl side chains
The side chains o f serine and threonine are small and aliphatic. The presence o f a hydroxyl group on each however, gives them a generally more hydrophilic nature than the structurally similar side chains o f alanine and valine.
Ç H2 0 H
SE R
CHo
H - C - O H
THR Figure 1.5: The structures o f serine and threonine sidechains.
A cidic side chains
Aspartic acid and glutamic acid are the only amino acids possessing side chains that are negatively charged at pH 7. The side chains differ only in that aspartic acid possesses one methylene group while glutamic acid has two, however, the chemical properties o f the residues are not similar. The slight difference in side chain length causes them to differ in their interaction with the polypeptide backbone. Consequently, the two residues have very different effects on the conformation o f the backbone.
COO" COO"
CHo
ASP GLU
General Introduction - Protein C om position & Structure
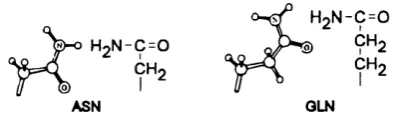
Amide side chains
Asparagine and glutam '»vc are the amide forms o f aspartic and glutamic acid. The amide side chains do not ionise, but are polar and act as hydrogen bond acceptors as well as donors.
H2N-C=0
H o N - C = 0 '
CH-2
ASN OLN
CHo 9^2
Figure 1.7: The structures o f the asparagine and glutammc sidechains.
B asic side chains
Lysine and arginine carry basic groups in their side chains which are positively charged at physiological pH. These amino acids are strongly polar rendering them highly hydrophilic.
t NHo
^"3 C=NH2
I -Wl
LYS ARO
Figure 1.8: The structures o f the lysine and arginine sidechains.
H istidine side chain
General Introduction - Protein Com position & Structure
H C -N H
Figure 1.9: The structure o f the histidine sidechain.
A rom atic side chains
The aromatic side chains o f phenylalanine, tryptophan and tyrosine are responsible for the ultraviolet absorbance and fluorescence properties o f proteins.
Phenylalanine contains a phenyl ring attached to a methylene group. It is highly hydrophobic, nonpolar and unreactive under physiological conditions.
Tryptophan contains an indole ring attached to a methylene group. Similarly to phenylalanine, it is also hydrophobic. Tryptophan is the most infrequent o f the amino acids.
Tyrosine differs from phenylalanine only in the hydroxyl group on its phenolic ring, resulting in a less hydrophobic amino acid than that o f phenylalanine.
NH
TRP PHE TYR
Figure 1.10: The structures o f the phenylalanine, tryptophan and tyrosine sidechains.
Snlphnr-containing side chains
The methionine side chain contains a sulphur atom in a thioe#>er linkage. The sulphur atom is nucleophilic in nature, but cannot be protonated. As a consequence, it is the most potent o f the nucleophiles in proteins at acidic pH.
General Introduction - Protein Composition & Structure
affected by alterations in pH and salt concentration. Hence, disulphide bonds play a significant role in protein stabilisation.
SH 0 5
Y
CH, 1® CHgCHj
CYS
MET '
Figure 1.11: The structures o f the methionine and cysteine sidechains.
M o d ified side chains
In addition to the 20 amino acids that are incorporated directly into proteins, certain amino acid side chains are post-translationally modified. These include 4-hydroxyproline, 5-hydroxylysine and y-carboxyglutamic acid.
1.1.2.2 Classification o f amino acids
General Introduction - Protein Composition & Structure
Class Amino acids Ionic properties o f side
chain at physiological pH
Polar-charged Lysine Arginine Aspartic acid Glutamic acid Histidine Fully charged
Histidine is generally included in this category but is only partially charged at this pH Polar-uncharged Asparagine Glutamine Serine Tyrosine Threonine Cysteine
Uncharged, but possess some separation o f charge capable o f forming
hydrogen bonds and associating with water
Non-polar Valine Leucine Isoleucine Phenylalanine Tryptophan Methionine Proline
Hydrophobic and not capable o f interacting with water, although proline is the exception and is not averse to being exposed to water
Other Glycine
Alanine
Neutral and can be accommodated into polar or non-polar environments
General Introduction - Protein Composition & Structure
1.1.3 N on-covalent interactions that determ ine protein conform ation
Protein size varies enormously from around 50 to 2000 amino acids, with the average comprising approximately 250 residues. The large size o f a protein enables the polypeptide chain to fold back on itself allowing interactions to occur among different parts o f the molecule. The complex three dimensional structures adopted by proteins are also as a consequence o f their interactions with their local environment. Interactions occur with water, salts, membranes, other proteins, nucleic acids, and a range o f other molecules found in living systems. These interactions are non-covalent and are o f primary importance as the driving force behind protein folding.
1.1.3.1 Short-range repulsions
These interactions are a consequence o f the repulsion between the electrical orbitals o f neighbouring atoms. As orbitals approach one another and begin to overlap so the repulsive force between the electrons rises steeply. The repulsive force increases so dramatically that at shorter distances it acts as a wall, effectively barring further approach o f the atoms relative to one another. The minimum distance between tw o neighbouring atoms defines the effective distance for closest molecular packing and the Van der Waals radii o f each atoms.
1.1.3.2 E lectrostatic interactions
All intermolecular forces are thought to be essentially electrostatic in origin. Charged molecules or charged groups on molecules attract oppositely charged molecules or groups. The force o f attraction is given by Coulomb’s law:
F = qiq2 / r^D
General Introduction - Protein Composition & Structure
1.1.3.3 Hydrogen bonding
The hydrogen bond is formed between a covalently bonded hydrogen atom on a donor group (D) and a pair o f non-bonding electrons on an acceptor group (A). The main component o f the hydrogen bond is an electrostatic interaction between the positive hydrogen atom pole o f the covalent bond dipole, and a partial negative charge o f the other electronegative acceptor atom.
^ A
-The hydrogen atom is able to interact strongly with an electronegative atom while still being covalently bonded to another. It can achieve this due to its small size and substantial charge. The most energetically favourable state for hydrogen bonds is in co-linear fashion. In biological systems only O and N atom have the appropriate electronegativities to serve as donors. Typical hydrogen bond lengths are given in Table
1.2.
Bond Length (A)
0 -H 0 2.70
0 -H O' 2.63
0 -H N 2.88
N -H 0 3.04
N^-H 0 2.93
N -R -N 3.10
T able 1.2: Different types o f hydrogen bonds and their bond lengths (Schul^ & Schirmer, 1979).
1.1.3.4 Van der W aal's interactions
General Introduction - Protein Com position & Structure
induce a similar transient dipole in a neighbouring atom. This results in an electrostatic attraction between the two atoms, and is referred to as a Van der Waal interaction. The attraction between the atoms increases as they move closer until the repulsive forces described in Section 1.1.3.1 come into play.
1.1.3.5 The biologically important p ro perties o f w ater
Water has two properties that profoundly influence all molecular interactions in biological systems.
Figure 1.12: The charge distribution on a water molecule.
1. Water is a polar molecule. Its molecular shape is triangular with an asymmetrical distribution o f charge.
2. As a consequence o f its polarity, the positively charged region o f water tends to orientate itself towards a negatively charged region o f a neighboring water molecule. In its liquid state, each molecule is hydrogen bonded (on average) to 3.4 o f its neighbours. The polarity and hydrogen bonding capabilities o f water enable it to be a highly interacting molecule in biological systems. Water can weaken electrostatic interactions and hydrogen bonding between polar molecules by competing for their attractions. This makes it an excellent solvent for polar molecules.
1.1.3.6 H ydrophobic interactions
General Introduction - Protein C om position & Structure
energetically favourable. The preference o f non-polar groups to interact with one another in an aqueous environment is referred to as the hydrophobic interaction. It is important to note, that the basis o f the hydrophobic interaction is not driven by the affinity non polar groups have for one another, but rather the high affinity that water molecules have for one another.
1.1.4 Protein structure
As stated in Section 1.1.2, proteins are a chain o f amino acids linked together by a succession o f peptide bonds. Each individual peptide bond involves the a-carboxyl group o f one amino acid condensing with the a-amino group o f the other. It is the succession o f the peptide bonds that forms the polypeptide backbone from which the amino acid side chains project.
1.1.4.1 The structure o f the p ep tid e hand
The dimensions o f the peptide bond are given in Figure 1.13, as derived from crystal structure analyses o f small peptides (Ramachandran et al., 1974).
I.23Â
C “
I.OÂ
Figure 1.13: The dimensions o f the peptide bond.
General Introduction - Protein Com position & Structure
length o f this bond is 1.33 Â, compared with that o f the 1.43 Â o f a single C-N bond and
1.25 Â o f the C=N double bond.
C - N ^ ^
c«
H
C«
H
Figure 1.14: The partial double bond character o f the peptide bond.
Although planar, the group o f atoms about the bond can exist in tw o possible conformations. One in which the C“ atoms are trans, and the other in which they are cis.
C - N
c - N ^
C* H C* C*
Figure 1.15: The cis or trans conformations o f the peptide bond.
The trans form is generally the more energetically favoured, for in the cis conformation the bulky R groups (amino acid side chains) on the adjacent a-carbons can interfere. The exception to this rule is if the next amino acid in the sequence is proline. Its side chain diminishes the repulsion between atoms and the stability o f the cis form is comparable to that o f the trans (Creighton, 1993).
1.1.4.2 Torsion an d dihedral angles
Rotation about bonds are described as torsion or dihedral angles. Since the peptide bond
is effectively rigid, the only rotational freedom that can occur is about the C“ atoms.
Rotation about the N -C “ bond is denoted by the torsion angle (|), and rotation about the C“-C ’ is denoted by the torsion angle \\i. As these are the only degrees o f freedom, the conformation o f the whole polypeptide backbone is completely determined by the (|> and