Limits to biofuels
S. Johansson
Global Energy Systems, Uppsala University - Uppsala, Sweden
Summary.— Biofuel production is dependent upon agriculture and forestry sys-tems, and the expectations of future biofuel potential are high. A study of the global food production and biofuel production from edible crops implies that biofuel pro-duced from edible parts of crops lead to a global deficit of food. This is rather well known, which is why there is a strong urge to develop biofuel systems that make use of residues or products from forest to eliminate competition with food production. However, biofuel from agro-residues still depend upon the crop production system, and there are many parameters to deal with in order to investigate the sustainabil-ity of biofuel production. There is a theoretical limit to how much biofuel can be achieved globally from agro-residues and this amounts to approximately one third of todays’ use of fossil fuels in the transport sector. In reality this theoretical po-tential may be eliminated by the energy use in the biomass-conversion technologies and production systems, depending on what type of assessment method is used. By surveying existing studies on biofuel conversion the theoretical limit of biofuels from 2010 years’ agricultural production was found to be either non-existent due to energy consumption in the conversion process, or up to 2–6000 TWh (biogas from residues and waste and ethanol from woody biomass) in the more optimistic cases.
1. – Introduction
From a technological point of view biofuels are excellent for replacing fossil fuels, especially in the transport sector; most of the fuel types can be produced in liquid form and has energy densities close to its fossil fuels equivalents. We can thus use biofuels in our present infrastructure and this makes biofuels especially attractive for policy makers. C
Fig. 1. – Oil production and consumption in relation to biofuel production 1990-2011 [1].
The world is not as simple, unfortunately. Firstly, biofuels usually do not replace fossil fuels. Perhaps locally, but fossil fuel dependence, environmental degradation and altering the greenhouse gas balance of the atmosphere are global problems, and in the global context the use of fossil fuels is constantly increasing simultaneously with the use of biofuels [1]. Figure 1 shows the increasing production and consumption of oil, and the, in comparison, tiny biofuel production.
Biofuels has gone from 0.3% of the total transport fuel to 1.5% in 10 years, but the increase of biofuel production is currently slowing down [1]. Figure 2 is an enlargement of the biofuel production, showing an exponential increase the last 5 years, and how the production levels out in 2010-2011 at approximately 680 TWh per year.
Secondly, biofuels cannot be discussed under the same conditions as other technolog-ical breakthroughs since it is highly dependent on agriculture and forestry. This leads to
Fig. 3. – FAO Food Price Index [4] and Brent Crude Oil Spot Price [5].
intricate system concerns, where factors as competition among land use, erosion, biodi-versity loss, food production, power balances in society, naming just a few of all matters following in the traces of biofuel production.
Common for all renewable fuels on the other hand, is that technology cannot be decoupled from fossil fuels — the spinal cord of the modern society. Most present biofuels have agricultural origin, and the modern agriculture is dependent on extensive fossil energy inputs. Giampietroet al.[2] puts it in following way:
“Technological improvements achieved in the Green Revolution that increased yields per hectare induced, as a side effect, a dramatic reduction in the energy output-input ratio of crops (i.e.they decreased marginal return of input application). Such a solution has been accepted for food crop production by modern society because increasing supplies of food was seen as worth an increase in expenditures of fossil energy. However, such a tradeoff would be unacceptable for energy crop cultivation.”
Food prices have a high correlation with oil prices. One interpretation is that food production is energy intensive and as prices increase for various inputs (most of them fossil fuel based,e.g.fuel for machinery, fertilizers and pesticides). Another interpretation was made by FAO [3] among others in relation to the “food crisis” in 2008: that the increased biofuel production leads to competition between food and fuel, and hence the price of food rises. I may argue that it is a combination of both, as fossil fuel prices rise there is more incentive to expand biofuel production. Figure 3 plots the monthly FAO Food Price index [4] together with the monthly Brent oil spot price 1990-2012 [5].
33%
24% 30%
5%
6% 2%
Global Primary Energy consumpon distribuon
Oil Natural gas Coal Nuclear energy Hydro electricity Renew- ables
Fig. 4. – Global primary energy consumption 2011 [1].
These projections are quite optimistic considering that the global primary energy consumption at present is approximately 143 000 TWh [1]. Fossil fuels constitute to totally 87%, the renewable part (biomass, waste, solar power and wind) is only 2% as seen in fig. 4.
Another, quite widely cited, study was made by Ladani and Vinterb¨ack [7], who conclude that 5% of the global primary production of biomass, 225 EJ (62 500 TWh) is undoubtedly sustainable, and that the entire energy requirement in 2050, estimated to 1000 EJ (278 000 TWh) “. . . should be possible with sufficient political support”.
Beringer et al. [8] suggests 36 000–75 000 TWh in year 2050, Hoogwijk et al. [9] 9 000–315 000 TWh, Fischer and Schrattenholzer [10] approximately 42 000 TWh (15% of global primary energy in 2050), European Biomass Industry Association [11] 69 000– 125 000 TWh by 2050 (based on estimates from WEC, WEA and IPCC). Smeets et al. [12] suggests 60 000–353 000 TWh in 2050 by converting pastures to energy crops, residues will contribute to 16 000–20 000 TWh in 2050 depending on crop production and surplus forest growth will give 0–10 000 TWh.
One can immediately understand that the claims of studies of global bioenergy poten-tial are indeed very bold. Considering system-related constraints of biofuel production, it is questionable whether it is sustainable at all to produce such large quantities of biofuels.
2. – Objective
3. – Method
Previous work on the global biofuel production capacity was made in Johansson et al.[13]. Due to the range of figures on biofuel potential, we decided to relate biofuel to what is actually produced by agriculture at present. Not to produce any future prediction, but to give a theoretical limit to what can be produced by the agricultural system of today. The method includes calculating the energy content of the global crop production, estimates losses in storage and some upgrading, feed for livestock, inedible fraction, seed for reproduction as well as the amount of residues and scenarios on residue-availability.
The methodology of that work is used here as well, updated to recent data. The results are compared and put in relation with energy use in the conversion technologies. For the orientation of biofuel types and evaluation methods a literature survey was conducted. This is accounted in sect. 4, “Theory”, below, and the result of global bioenergy production with the method of Johansson et al. [13] is presented in sect. 5, “Results”.
4. – Theory
4.1.Overview of bioenergy systems and technology. – There are several ways for ob-taining biofuel from biomass. Figure 5 illustrates the main process of various types of fuels.
Corn
Grind
Cook
Liquify
Saccharify
Enzymes,
yeast S
Fermentaon
Disllaon
Centrifugaon
Disllers
Grains
F CO2
Ethanol
Evaporator
Disllers
solubles
Disllers grains
solubles Thin
sllage
Fig. 6. – The dry-grind ethanol process [15].
4.1.1. Biofuels of first generation
Ethanol
The simplest way of producing ethanol is by anaerobic yeast fermentation of glucose. Therefore crops with high sugar content are suitable and especially sugarcane contributes a substantial part of the global ethanol production. Starch is a polymer of glucose that, with aid of enzymes in a hydrolysis process, is relatively easy to split into simple sugars. Hence starch-rich crops such as maize and wheat are also common as raw material for ethanol production. Figure 6 shows the common conversion process of maize (corn). The main product is ethanol, and the co-product, Dried Distillers Grains Solubles (DDGS), can be used as animal feed. In the sugarcane process bagasse is a co-product.
The ethanol yield varies among different crops. Sugar cane yields approximately 75– 85 l/tonne, sugar beet 100–110 l/tonne, maize 370–420 l/tonne and other grains (wheat, rye, barley etc.) 340–385 l/tonne [16].
The sustainability of ethanol of 1st generation is to a large extent dependent on the production system of the crop. There is also a competition between food and fuel, since crops rich in starch and sugar contribute to a large part of the human diet worldwide.
Biodiesel
Transesterification is a process where an alcohol, typically methanol, is replacing glycerine in the vegetable oil, in the presence of a catalyst [17]. The result of the chem-ical reaction is a Fatty Acid Methyl Ester (FAME)–Biodiesel. The reaction gives two products: biodiesel (methyl ester) and glycerol, as seen in fig. 7.
Fig. 7. – Chemical reaction of FAME [18].
there is also an explicit competition between food and fuel when it comes to biodiesel. The most important crops for biodiesel production are oil palm, having a biodiesel yield of approximately 160 l/tonne, soybean with 210 l/tonne and rapeseed with 460 l/tonne [16].
Biogas
Biogas is produced when organic material is digested by anaerobic bacteria in an en-vironment deficient in oxygen. The digestion can be divided into 4 steps: i) hydrolysis (where complex molecules are broken down into water soluble compounds), ii) acid for-mation (CO2and H2-formation, further degradation of larger molecules into intermediate shorter chains), iii) acetate formation (intermediate products degraded into acetate) and iv) methane formation (acetic acid is digested by methanogenic bacteria and methane is formed) [19].
Biogas typically consists of 65% methane and 30% carbon dioxide, and the rest is approximately 3% ammonia and hydrogen sulphides [20]. The sulphides are corrosive and must be eliminated if the gas is to be used in an engine. The gas must also be cleaned from water. In order to raise the methane content in the fuel, carbon dioxide should also be separated from the gas. It may be possible to use un-upgraded biogas as fuel but this will require a large gas container or a short operation distance. Yet, upgrading can be expensive and requires large facilities in order to be efficient and biogas may be more effectively used for heating or as fuel for cooking.
4.1.2. Biofuels of second generation. Biofuels derived from lignocellulosic material is usually called 2nd generation biofuels. Even so, gasification of biomass is well-known and the Fischer-Tropsch process was used in Germany during the two world wars for con-verting coal into liquid fuel [21]. Below the technology for some different 2nd generation biofuels are described briefly. Firstly ethanol from cellulosic material and secondly fuels derived from synthetic gas (syngas) produced through gasification of biomass.
Ethanol
Ethanol from lignocellulosic biomass requires some additional pretreatment before the ordinary fermentation process is possible. In fig. 8 the main steps are illustrated.
lig-Cellulose Cellulose pretreatment Cellulose conversion; hydrolysis Lignocellulosic biomass: • Miscanthus • Switchgrass
• Municipal Solid Waste
• Forest residues
• Agricultural residues
• Weeds
Sugar Fermentaon Disllaon Drying Ethanol
Starch conversion Co-product recovery: Animal feed, chemicals Starch-based raw material (cereals) gar Ferme Cellulose ntaon Dis Starch conversion d raw reals) c Ferme
Fig. 8. – Ethanol production from cellulose, starch and sugarcane. Increased pretreatment required for cellulose compared to starch and sugar [22].
nocellulose and transform it into sugars with good enzymatic digestibility [23]. Zhu and Zhuang [23] describes and compares several technologies, namely: “Dilute acid pre-treatment, Catalyzed steam explosion, Sulfite pretreatment to overcome recalcitrance of lignocelluloses (SPORL), Solvent based pretreatment and Alkaline based pretreatment”. The performance of the methods depends largely on type of substrate (soft or hard wood) and most methods are still on laboratory scale.
A byproduct from the lignocellulosic ethanol process is lignin, which can be used as it is for heat generation through combustion or for phenol production by flash pyrolysis [24].
Syngas derivatives
Gasification is a process where material is being oxidized with the presence of oxygen at a regulated level (stoichiometric). The resulting syngas is a mixture of mainly CO and H2, but also CO2, CH4, C2H6 and C2H4 are present. A few corrosive by-products, namely H2S, NH3and HCl are also produced, and need removal before further processing of the gas [25]. Before gasification the material must be dried to 10% moisture.
Methanol
The chemical reaction of syngas to methanol:
CO + 2H2⇔CH3OH, ΔH298◦ =−90.6 kJ/mol,
CO + 3H2⇔CH3OH + H2O, ΔH298◦ =−49.5 kJ/mol.
200◦C and pressures at 77 bar. After a few circulations of the steam to increase the efficiency of the conversion, the steam is sent into a distillation column. The unconverted gas is normally used for combustion and generated electricity [25].
DME
Di-methyl-Ether, DME, is synthesized by the same process as methanol, but taken one step further over an acid catalyst:
2CH3OH⇒CH3OCH3+ H2O
Fischer-Tropsch diesel
The Fischer-Tropsch diesel process converts syngas into a range of hydrocarbons and waxes, and the products can be steered by temperature [26] and choice of catalyst, usually based on iron, cobalt and ruthenium [27]. The diesel fuel produced is of high quality free of sulfur. The by-products (e.g. naphta, kerosene and waxes) are useful for other applications as well, but the fuel fraction is smaller in the Fischer-Tropsch diesel than e.g.methanol synthesis because of the range of products.
4.2. Overview of evaluation methods. – Below is an orientation in a selection of methodologies that are commonly used to evaluate biofuels. I will highlight some special features and discuss limitations of the methods. To describe the theoretical fundaments for each method would require more space; hence I will instead refer to other publica-tions. The aim of the chapter is to shed some light over how results can differ to such large extent.
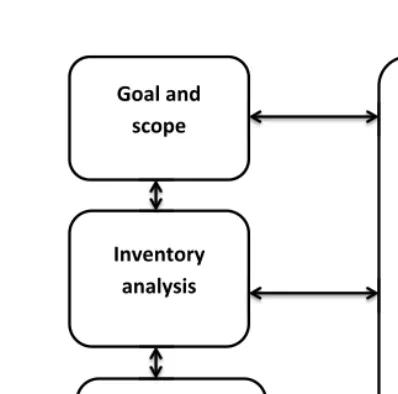
4.2.1. Life Cycle Assessment (LCA). The methodology of LCA is widely used and has been standardized according to ISO-14040 and ISO-14044. The standards include 4 parts, and the process is iterative, according to fig. 9.
LCA is the “Compilation and evaluation of the inputs and potential environmental impacts of a product system throughout its lifecycle” [28].
An LCA study starts by defining afunctional unit,e.g.a loaf of bread, 10 km with a car, 1 kWh electricity etc., which works as a reference unit in the assessment. The choice of functional unit is important for all other calculations in the analysis since all flows need to be normalized to the functional unit. It is a pedagogic way to track all flows down to a specific service that is wanted. Nevertheless, comparing a few alternatives also means that all other alternatives are excluded. It may seem as a car driven on biofuels is better (depending on the results of the calculations) than a car on petroleum, but this presupposes that the car-driven system is desirable.
“Life cycle thinking implies that everyone in the whole chain of a product’s life cycle, from cradle to grave, has a responsibility and a role to play, taking into account all relevant external effects” [29].
Goal and scope
Inventory analysis
Impact assessment
Inte
rpretaon
Fig. 9. – The four stages in LCA according to ISO-14040 and ISO-14044.
not. The second assertion lays an exceptional ground for subjective research, and the first assertion puts quite a limit to the usefulness of LCA to a certain type of products. The idea of a cradle will inevitably end up in a “hen-or-the-egg”-discussion.
To call something a “grave” of a product is a thermodynamic error since energy and matter always is conserved. The usefulness (for humans) of the product may be ended, but the material and energy released will be used in many steps by other organisms, oceans and weather systems. There are always competing utility of material and the use of the product during its life effect the Earth System. In the case of biofuels it can be assumed that it replaces fossil fuels, which is seldom the fact in reality: biofuel is, rather than replacing fossil fuels, contributing to the global increase of transportation fuels. The analysis fails to address the impact of increasing transports, since the most common choice of authors is to concentrate on a wishful scenario of replacing fossil fuels by renewable.
The choice of system borders is extremely important in LCA, as well as other evalu-ation methods. Ignorant choices may lead to large errors.
LCA claims to attend aholistic view and addresses environmental impact as well as energy return of the product system. This has led to,e.g., a raw simplification of climate to depend simply on emissions of greenhouse gases: Global warming potentialis a measure of the amount of greenhouse gas emissions by the system alternatives, and the assessment can with this measure argue about the sustainability of a certain product system. Other factors, e.g.erosion and depletion of soil organic matter, are often bypassed, yet these are very important players in the carbon cycle.
How-ever, all arrangement of matter into lower entropy products (higher-energy quality) is an effort of work. Thus the assessment must distinguish between “free energy” and de-liberate energy input by human systems. There are a lot of choices in every step from “cradle-to-grave” of what energy is regarded as free, what energy can be addressed to the main product and what should be divided, or allocated to the by-products or “waste”-products. When it comes to allocation one can choose about the importance of the by-products, do they have an economical value, a physical valuee.g.weight, energy content, etc. or no value at all (depending on the chosen system borders)?
The allocation process is one of the largest sources of error in LCA, and cannot be regarded as anywhere close to objectivity. Does economic value really measure usefulness of the by-product? E.g., straw can be regarded as a free product for biofuel production if all energy inputs are allocated on the main crop. But its usefulness as forage or straw bed for cattle, house material in tropical countries, fiber and recycling organic carbon to the soils as well as preventing soil erosion is not evaluated. The allocation principles reduce the complexity of reality, and in the worst case it can contribute to associating sustainability of a product that really contributes to a wasteful overall system.
Perhaps LCA can contribute to tracking emissions and unnecessary energy use in an industrial production chain, but for complex systems such as biofuel production the method is too simple to communicate the whole picture, and too complex to be trans-parent about all steps and directed choices of allocation.
4.2.2. Net Energy Analysis. The reasoning behind Net Energy Analysis (or Energy Analysis) is straightforward in the sense that only “measurable” energy is accounted. There is no consideration of energy quality and energy consumption is measured in energy units, as well as the product (which often confuses distinction between primary energy and energy carriers of various qualities):
“The ability of a biofuel system to support societal assets depends on how much energy it supplies to society after reinvesting part of the output in the production process as an alternative to fossil fuels” [30].
The key parameter is the Energy Ratio (ER), also called Net Energy Balance (NEB):
ER = Output Energy Input Energy
If ER≤1, the proposed alternative is unfeasible for thermodynamical reasons [30]. It can be economically viable to produce something that takes more energy to produce than it gives, but not for an energy carrier that aims to replace a primary energy source.
The results can be further analyzed: the inverse of ER, ER−1= Output EnergyInput Energy , show how large part of the output energy is put in to the process. When analyzing biofuels this is important since if the system could be considered renewable all energy used in the process must also be renewable.
Example:
is useful to society. This also means that approximately 4 times (1/0.27≈4) more fuel must be produced to be able to deliver 1 unit to society.
However, the simplicity of the method is also the largest drawback, especially in regard to biofuel systems. However, the simplicity makes the method transparent and it is easier to follow each figure and to estimate the reasonability of the results than e.g. LCA.
4.2.3. Energy Return on Investment (EROI). EROI is similar to net energy analysis. The methodology is not standardized, and there are some variations of the definition of EROI. Clevelandet al.[31] refers to EROI as a measure of “energy sustainability”, and that only human applied energy resources should be accounted. Their definition is:
EROI = Usable energy acquired from a particular energy resource Amount of energy expended to obtain that energy resource
The definition of Cherubini and Ulgiati [24] is instead:
EROI = Energy out Non-renewable energy in
Where the denominator is non-renewable energy required along the full life cycle, hence EROI integrates in LCA. This definition is useful for determining the “renewability” of the product, however, it says not much about the resource efficiency.
The EROI concept can also be used at several levels and on a multi-criteria basis. Mulder and Hagens [32] also points on the risks of standardizing, for it may lead to failure in addressing each special case adequately:
“Unlike LCAs, it is probably not desirable or possible that EROI be restricted to a single meaning or methodology. The different levels of analysis. . . are germane to different problems, contexts and investigators. The problem arises when the same term is used for methodologies with different assumptions and ultimately different goals.”
According to fig. 10, the first-order EROI is equivalent to what I called “net energy analysis” above. However as the complexity increases the method resembles LCA and encounter similar problems with,e.g., allocation.
4.2.4.Exergy analysis. According to the first law of thermodynamics energy cannot be created or destroyed. The second law of thermodynamics states that energy conversions go from low to high entropy (disorder), implying that the energy loose its ability to do work through all real processes. Exergy is a concept derived from the second law, as a relative measure of the energy quality in a given system:
The exergy of a system in a certain environment is the amount of mechanical work that can be maximally extracted from the system in this environment [33].
Fig. 10. – Framework of EROI methodologies. The side axis determines what to include (direct inputs, indirect inputs, and/or externalities). The top axis dictates how to include non-energy resources (ignore, convert to energy equivalents, or treat as irreducible.) Note that because simple EROI ignores nonenergy inputs, it does not have a third order form that accounts for externalities. Adapted from Mulder and Hagens [32]. For description of the equations Mulder and Hagens [32] is recommended. In short: EDin = energy in,
Ik = various inputs, EDout = produced energy (in one or more forms), Oj = co-products (non-energy),{yk}= set of coefficients for a given production process giving the per-unit en-ergy costs {Ik}, X = non-energy resource, ΠX,k = direct and indirect per-unit inputs of X intoIk.
The general equation for exergy of a system is
E=U−Ueq+p0(V −Veq)−T0(S−Seq) +
ni(μieq−μi0),
U,V,Sandni are the extensive parameters (dependent on size of the system); internal energy, volume, entropy and number of moles of component i. T0, p0 and μi0 are the intensive parameters (scale invariant) of the environment; temperature, pressure and chemical potential of the component in its standard state. Chemical or heat exergy can be derived from the general equation, for derivation and more definitions of the theoretical foundation of the exergy concept, see,e.g., [33, 39, 40].
The exergy factor is the ratio between exergy and energy:
By theoretically calculating the exergy of all processes in a system, exergy can substitute energy in,e.g., LCA or EROI and become LCEA — Life Cycle Exergy Analysis [41] and ExROI [42]. When exergy is used instead of energy, energy quality is “automatically” accounted according to the authors.
Exergy analysis can advantageously be used to locate and quantify losses of energy quality in processes to improve energy use efficiency [39], which is what the theory was initially developed to do [43]. Yet, for sustainability assessments Gaudreau et al. [43] highlight five serious points of vagueness in the theoretical foundation of exergy: 1) The incompatibility betweenexergy qualityandresource quality. 2) The inability of exergy to characterize non-work producing resources via the concentration exergy. 3) Constraints placed on the derivation of exergy. 4) Problems with the exergy reference environment. 5) Multiple perspectives applied to exergy analysis.
For understanding the arguments behind the critique to exergy I recommend Gau-dreauet al.[43]. Their general conclusion is that the theoretical framework is unsuitable for sustainability assessments and that exergy may be better used for its original purpose in engineering technology.
4.2.5.Emergy analysis. Emergy analysis was firstly developed by H.T. Odum, who op-posed to the view that exergy content relates to a resource’s value, and instead proop-posed that the resource value is connected to its embodied energy, or “emergy” [44].
“Emergy is the sum of all the direct and indirect solar energy used to make a service or a product” [45].
Unlike the other evaluation methods that are mentioned above, this method have a theoretical foundation that differs from the conventional theory, and have been highly criticized. It is too large of a subject to treat in this brief context, and the reader is advised to the literature (e.g., [45-48] to name a few).
A major idea is that systems are self-organizing, which is a profound experience in the study in ecological research [48], but not a common view in technological or economic studies. However, even thermodynamics is no more than statistical science, and the way the science describes the world is entirely dependent on our experience [49]. Odum suggests that the self-organization principle follows the law of Maximum Empower, which he even claims to have the status as the fourth thermodynamic law [46].
“In the competition among self-organizing processes, network designs that maximize empower will prevail” [45].
The emergy concept has been criticized for being teleological because of the view that systems can have goals or aims. However, the “aims” are also embedded in Thermody-namics (e.g., the goal to strive after equilibrium with the environment), Darwin’s Theory on the origin of species [48], and certainly there are many more examples. Humans tend to describe the world in metaphors that we can understand, or “models”. We know that our theories are only models, and that they are not complete, but we use them to understand important processes.
“All models are wrong, some are useful” [50].
by studying agro-ecosystems for, e.g., biofuel production; the emergy context may be useful. Nevertheless, as this is one of the more complex methods, the results and indices can be rather confusing, especially since they are used in many different ways.
There is a set of indices that, unfortunately, tend to be defined differently from author to author, making results difficult to compare, but one variant is given by Brown and Ulgiati [47]:
Define R as Renewable sources, SR as local Slowly Renewable sources and N as Non-renewable sources.
Renewable fraction: %Ren = R R+SR+N ,
%Ren indicates the renewability of the system or service. Only systems with high re-newability are sustainable in the long run.
Emergy Yield Ratio,EYR = R+SR+N
N ,
EYR is analogous to the EROI definition of energy in the product to the input of fossil fuels, but here in terms of emergy, and the non-renewable input is not only fossil fuels, but alsoe.g.loss of topsoil.
Environmental Load Ratio,ELR = N+SR
R ,
ELR is a measure of stress on the environment (non-renewability to renewability).
Emergy Sustainability Index,ESI =EYR ELR
ESI accounts for yield, renewability and environmental load. High yield and low load gives a larger ESI.
One cannot present emergy without discussingTransformity. For it is not possible to calculate the emergy indices without transforming all inputs to a common base, usually solar emergy Joules (seJ). The idea per se is not very controversial; it is the same as accounting all flows ine.g.terms of energy (Joules, kWh, oil equivalents etc.) or in terms of greenhouse gas emissions. However, firstly it can be discussed rather it is meaningful to transform all flows into sunlight energy, and secondly, why evaluate all flows with a single measure at all?
Fig. 11. – Biofuel production if all maize (corn), sugarcane, Soybeans or oil palm fruit was to be used for biofuel production, compared to the 2006 years biofuel consumption and overall fuel consumption in the transport sector. Adapted from Johanssonet al.[13].
and it addresses parameters that other methods fail to include. Used together withe.g. net energy analysis (e.g.[30]) the understanding of the system processes may be higher.
5. – Results
5.1.Energy indices. – In Appendix A, a summary of a literature review on some dif-ferent indices of energy return for various biofuels. The survey is not very comprehensive in the sense that all indices are represented by many studies. It is instead a brief review aiming to highlight large differences and incompatibility among the different indices.
As seen in tables I-III (Appendix A) there is no univocal answer to whether biofuels give a net return to society or if the production is sustainable. Seemingly, gasification methods have better performance than other biofuels, yet, only one reference is quoted, and that study had rather high values for all other fuels as well. From a few studies it is noted that there were a “best case” scenario and a more conservative scenario. This may indicate that the authors’ choices, and probably in some cases even steered by the personal attitude towards biofuels, decide what results are presented.
5.2. Biofuel from global agriculture. – Johansson et al. [13] argues that the use of edible crops for biofuel production may lead to a global deficit of food, and even stresses that the edible crops cannot contribute much anyway. Figure 11 shows how much ethanol could be produced if all maize or all sugarcane was to be used, biodiesel from all soybeans or all oil palm.
Fig. 12. – Gross energy content in crop production, losses and net energy content available as food. For calculations of losses and scenarios (high case and low case), see [13].
25% in four years. Sugar crop production increased with 14%, oil crops and fruit with 12%, pulses with 11% and cereals with 9%. The largest decrease was in forage crops that dropped by 22%. Also the fiber production dropped, by 3% and roots and tubers by 1%. This redistribution lead to a significant change of the results, that in the low case scenario there is a deficit with 123 TWh, provided that the global population of 6.89 billion capita needed 7300 TWh for food in 2010 (2500 kcal per capita and day). In the high case scenario there is a surplus of 2800 TWh, whereas in Johanssonet al.[13], data from 2006 implied that even in the low case there was a small surplus.
Although there may be a global deficit of food at present, the results indicate that if losses are reduced the population in 2050 (assumed to be 9 billion), can be fed. There is thus no need for increasing the food production simply for covering the food demand, it is more a matter of distribution and that much food is wasted, as seen in fig. 12. Especially in the livestock system where animals eat what humans can eat instead of converting grasses to edible products (but can agriculture produce the same yields in the future with limited availability of fossil fuels?).
Since it seems unwise to use edible crops for biofuel production we turn to the residues. According to methodology, assumptions and conversion factors from Johanssonet al.[13], the theoretical limit for biofuel production for 2010 as presented in fig. 13.
Fig. 13. – Assessment of theoretical limit for biofuel production from residues. Based on the methodology of Johanssonet al.[13].
to ethanol. The maximum potential is given when adding biogas from annual residues, waste and ethanol from woody biomass. One can argue that ethanol may not be the most efficient fuel to derive from woody biomass, but the order of magnitude should be the in this range even for gasification technologies since the main parameter is the availability of residues.
This calculation gives a very optimistic theoretical “potential” of biofuels to be able to replace 30% of the transport fuel. However, there are some considerations needed. The biogas is just referring to a theoretical conversion, and not as fuel quality, and all biofuel systems require energy for biomass conversion. The results in fig. 13 only show a theoretical limit to how much agriculture can produce without directly competing with food production and without being extremely unsustainable (i.e.some restrictions of the use of residues due to soil fertility were considered [13]). Put in the light of mentioned biofuel potential assessments mentioned in the introduction in this paper, the results are rather conservative. Yet they are more reasonable since they actually rely on real data of the agricultural production system.
for perennial residues. Note that the calculation does not account for any energy required previous to the biorefinery step, such as gathering the residues and transporting them.
A simple output/input ratio for the low case scenario of annual residues is equal to 1.51, which in extension means that 3 liters of fuel must be produced to deliver 1 liter to society (see sect.4.2.2 above). However, the amount of ethanol was estimated based on the theoretical limit for residues for second generation technology, and the 3 times extra amount of residues required to make the system self-sufficient are not available globally. For the perennial residues 2 liters must be produced in order to deliver 1 liter to society. Biorefineries, or all kind of conversion technologies for biofuels, lower the theoretical limit significantly.
According to Johanssonet al.[13], the potential for using residues for biogas is larger provided that the biogas residue is returned to the field. Such a claim is not completely valid since a lot of carbon is lost in the biogas process and hence the risk of lowering the soil fertility is present also in a biogas system.
Assume that Ahlgrenet al.[51] manages to cover most energy expenses in a biogas system, the net energy return for biogas at fuel quality should be 3.75 (see Appendix A). The global theoretical limit for biogas was approximately 7000 TWh, hence the energy required to obtain this is almost 1900 TWh. Since no more material is available for biogas this lowers the theoretical limit for biogas accordingly. However, P¨oschlet al.[71] lowest energy balance for biogas conversion was 1.6 and if we use that value instead of 3.75 [51], then approximately 4400 TWh will be needed for the process, which lowers the theo-retical limit to 2600 TWh instead of 7000 TWh. Rehl et al.[70], concludes that: “The comparison of different LCA approaches to the same biogas system. . . revealed that the calculated environmental performance is affected considerably by the methodology cho-sen”, and achieved a negative energy balance while using attributional LCA compared to an energy return of 5–10 times using consequencial LCA (see [70] for definitions). Hence it cannot be thoroughly understood from existing literature whether there will be an energy gain from converting residues and waste-products into biogas of second generation fuel.
Hence, the theoretical limit of biofuels from 2010 years’ agricultural system is either non-existent due to energy consumption in the conversion process, or up to 2–6000 TWh (biogas from residues and waste and ethanol from woody biomass) in the more optimistic cases.
6. – Discussion and conclusion
way to gather all manure. Held in pasture they fertilize the land and gather their food on their own, which is much more efficient from a resource point of view.
Additionally, food should not in an ideal case be wasted, because it takes a lot of energy and manpower to produce and distribute food. If food is damaged in storage by, e.g., mold, we want to strive for better storage, and actually, animals such as pigs and poultry could eat a lot of waste. Or as Michael Pollan formulates it in his book The Omnivores Dilemma: “In fact, when animals live on farms the very idea of waste ceases to exist; what you have instead is a closed ecological loop.” [52]. Used in the wrong way, large-scale biogas production may contribute to a wasteful food production system, which may not be possible in the future when fossil resources become scarce.
One of the main arguments for 2nd-generation biofuel production is that it does not compete with food production. In reality, all cultivation of energy crops indirectly competes with other land use, such as food production. Using straw as raw material require some extra caution because it is important for all soils not to be depleted on soil organic carbon, and straw contributes to a large part of the carbon recycling in the system [53, 16].
It can also be argued that the forestry can contribute to a large extent for 2nd-generation biofuels. Yet, wood is a useful material and there will be competition between biofuel, firewood, pulpwood and timber and boards for construction. As a matter of fact, several studies stresses the importance of wood as construction material as a mean for reducing greenhouse gas emissions [54-56].
In the scientific genre of “sustainability assessments” the philosophy of Sir Karl Popper becomes notably important, especially his theory ofObjective Knowledge [57], implying that all science is subjective. Biofuels are part of complex systems, where nature, ecology, thermodynamics, technology and economy are all important factors. A study on such a system will never come closer to the truth than the knowledge of the viewer. Therefore the results are highly subjective since they are steered by the choice of the scientist, of whom the knowledge of the system is inevitably restricted. Simply the fact that the result on net energy or environmental impact of a biofuel system varies significantly depending on which evaluation method is used and which scientist is behind the calculation, implies that we are far from the truth regarding feasibility of biofuels.
AppendixA.
Literature review on energy indices
The indices presented are: LCEB (Life Cycle Energy Balance), NEB (Net Energy Balance), EROI (Energy Return on Investment), ExROI (Exergy Return on Investment), Net Exergy, EYR (Emergy Yield Ratio). LCEB, NEB and EROI are essentially the same, but I write them out to indicate that different methodologies have been used to obtain the energy ratio.
TableI. –Energy indices for ethanol biofuel.
Crop/ Reference LCEB NEB EROI EYR Notes
biomass
Maize
Ulgiati, [30] 1.36 1.08 Credits for straw as fuel
(Corn) and DDGS
Ulgiati, [30] 0.59 No credits for by-products
Hillet al., [58] 1.25
Pimentel and Patzek, [59] 0.78
Shapouriet al., [60] 1.67
Wheat Ahlgrenet al., [51] 2.32
Cereals B¨orjesson, [61] 1.02-2.25 Survey of literature
Sugarbeet Ahlgrenet al., [51] 4.18
Straw Cherubini and Ulgiati, [24] 4.0 In a “Biorefinery”
Ahlgrenet al., [51] 3.35
Corn stover Cherubini and Ulgiati, [24] 5.2 In a “Biorefinery”
Switch-grass
Felix and Tilley, [62] 1.02/ 0.57/ Conservative, respectively 2.62 1.29 best case scenario
Pimentel and Patzek, [59] 0.67
Woody
Pimentel and Patzek, [59] 0.64 biomass
Ahlgrenet al., [51] 3.06/3.01 Willow tree/tops and
TableII. –Energy indices for biodiesel.
Crop Reference LCEB NEB EROI ExROI Net Exergy Notes
Oil palm Silva Loraet al., [63] 5.08
de Moraet al., [42] 5.31
Soybean
Hillet al., [58] 1.93
Venturi and Venturi, [64] 0.2 No allocation
of by-products
Pimentel and Patzek, [59] 0.79
Sunflower
Kallivruossiset al., [65] 4.5
de Moraet al., [42] 4.78
Pimentel and Patzek, [59] 0.05
Rapeseed
Hovelius and Hansson, [66] 2.4 3.0
de Moraet al., [42] 4.37
TableIII. –Energy indices for other fuels than ethanol and biodiesel.
Fuel Raw Reference LCEB NEB EROI Net EYR Notes
material Exergy
Heat Straw Nilsson, [39] 9 1.16 1.1
Biogas Silage Ahlgren 3.75 Biogas at
et al., [51] fuel quality
Manure Ahlgren 2.76 Biogas at
et al., [51] fuel quality
Hemp Prade 2.7/ Biogas through
et al.[68] 2.6 CHP/Biogas at fuel
quality, respectively
Manure Ciotola 2.93/ Raw biogas/biogas
et al.[69] 2.07 electricity
Manure Rehl Neg./ aLCA method
et al.[70] 5-10 gives negative
balance/cLCA method
gives significant
energy return
Mixed P¨oschl 1.6-9.5/ Single feedstock/
substrate et al.[71] 1.8-2.9 co-digestion
Gasification Straw Shie 2.23- 4.13- Straw is considered
technology et al., [67] 7.86 8.86 “free” energy, the
range is for different
gasification technology
Ahlgren 11.83/ FTD/Methanol/
et al., [51] 6.08/ DME
11.22
Willow Ahlgren 7.56/ FTD/Methanol/
tree et al., [51] 5.19/ DME
8.28
Tops and Ahlgren 16.89/ FTD/Methanol/
branches et al., [51] 7.62/ DME
REFERENCES
[1] BP,Statistical Review of World Energy 2012, Historical data 1965-2011. Available online at: http://www.bp.com/sectionbodycopy.do?categoryId=7500&contentId=7068481, Utilized 2012-07-13.
[2] Giampietro M., Ulgiati S.andPimentel D.,BioScience,47(1997) 587.
[3] FAO,How to Feed the World in 2050. (2009) Available online on: http://www.fao.org/
fileadmin/templates/wsfs/docs/expert paper/How to Feed the World in 2050.pdf. [4] FAO, Food Price Index, (2012) Available online at: http://www.fao.org/
worldfoodsituation/wfs-home/foodpricesindex/en/, Utilized 2012-07-19.
[5] US Department of Energy, Brent Crude Oil Spot Price (2012) Source: US Department of Energy viawikiposit.org, available online at: http://wikiposit.org/uid?DOE.RBRTE Update: http://wikiposit.org/w?action=dl&dltypes=comma%20separated&sp=monthly &uid=DOE.RBRTE.
[6] IEA, Potential contribution of Bioenergy to the World’s Future Demand. (2007) IEA Bioenergy: ExCo 2007:02. Available online at: http://www.idahoforests.org/img/pdf/ PotentialContribution.pdf.
[7] Ladani S. and Vinterb¨ack J., Global Potential for Sustainable Biomass for Energy, Department of Energy and Technology, Swedish University of Agricultural Sciences (SLU), Report 013 (2009). Available online at: http://pub.epsilon.slu.se/4523/1/ ladanai et al 100211.pdf.
[8] Beringer T., Lucht W.andSchapoff S.,GCB Bioenergy,3(2011) 299.
[9] Hoogwijk M., Faaij A., van den Broek R., Berndes G., Gielen D.andTurkenburg W.,Biomass Bioen.,25(2003) 119.
[10] Fischer G. andSchrattenholzer L.,Biomass Bioen.,20(2001) 151.
[11] European Biomass Industry Association, Biomass resources and production potential (2012) Available online at: http://www.eubia.org/215.0.html.
[12] Smeets E., Faaij A.andLewandowski I.,A Quickscan of Global Bioenergy Potentials to 2050 – An analysis of the regional availability of biomass resources for export in relation to the underlying factors. Report NWS-E-2004-109 (2004), FAIR Biotrade Project. Available online at: http://www.riaed.net/IMG/pdf/A quickscan of global bioenergy potentials to 2050.pdf.
[13] Johansson K., Liljequist K., Ohlander L.andAleklett K.,Ambio,39(2010) 91. [14] Muradov N. Z. andVeziroglu T. N.,Int. J. Hydrogen En.,33(2008) 6804.
[15] Butzen S.andHaefele D.,Dry-grind Ethanol Production from Corn(2012) Available at
https://www.pioneer.com/home/site/ca/template.CONTENT/products/end-use/htf/ guid.B6C03E1D-1585-429E-ABA8-104FB904EB63, utilized 2012-06-17.
[16] Johansson K.andLiljequist K.,Can agriculture provide us with both food and fuel? -A survey of present agricultural production (UPTEC ES 09 011, Uppsala) 2009.
[17] Bernesson S., Nilsson D.andHansson P.-A.,Biomass Bioen.,26(2004) 545. [18] Biofuel Express (2008). Available at: http://www.biofuel-express.com/biodiesel
production overview s, utilized 2012-06-17.
[19] Anker ThyØ K. and Wenzel H., Life cycle Assessment of Biogas from Maize silage and from Manure- for transport and for heat and power production under displacement of natural gas based heat works and marginal electricity in northern Germany, (2007). [20] Alvarez H.,Energiteknik, Vol.3(Studentlitteratur, Lund) 2006.
[21] H¨o¨ok M. and Aleklett K., Int. J. En. Res., 34 (2010) 848, http://dx.doi.org/
10.1002/er.1596.
[24] Cherubini F. andUlgiati S.,Appl. En.,87(2010) 47.
[25] Sues A., Juraˇsˇc´ık M. andPtasinski K.,Energy,35(2010) 996.
[26] Rahimpour M. R., Jokar S. M. andJamshidnejad Z.,Chem. Engin. Res. Design,90 (2012) 383.
[27] Ghasemi S., Sorhabi M.andRahmani M.,Chem. Engin. Res. Design,87(2009) 1582. [28] Guin´ee J. B., Gorr´ee M., Heijungs R., Huppes G., Kleijn R., Koning A. de, Oers L. van, Wegener Sleeswijk A., Suh S., Udo de Haes H. A., Bruijn H. de, Duin R.
vanandHuijbregts M. A. J.,Handbook on life cycle assessment. Operational guide to the ISO standards. I:LCA in perspective. IIa: Guide. IIb:Operational annex. III:Scientific background. (Kluwer Academic Publishers, Dordrecht) 2002, ISBN 1-4020-0228-9. [29] UNEP (United Nations Environment Programme). Evaluation of Environmental
Impacts in Life Cycle Assessment (United Nations Publication) 2003. ISBN: 92-807-2144-5. Available online at: http://www.unep.fr/shared/publications/pdf/3234-EvalLifeCycle.pdf.
[30] Ulgiati S.,Crit. Rev. Plant Sci.,20(2001) 71.
[31] Cleveland C. J., Constanza R., Hal C. A. S.andKaufman R.,Science,225(1984) 890.
[32] Mulder K.andHagens J. N.,Ambio,37(2008).
[33] Wall G.,Exergy – A useful concept within resource accounting (Institute of Theoretical Physics, G¨oteborg, Sweden) 1977.
[34] Wall G.,Res. En.,9(1987) 55. [35] Wall G.,Energy,15(1990) 435.
[36] Wall G., Sciubba E.andNaso V.,Energy,19(1994) 1267.
[37] Zaleta-Aguilar A., Ranz L.andValero A.,Energy conversion management,39(1998) 1911.
[38] Jorgensen S. E.andNielsen S. N.,Energy,32(2007) 673. [39] Nilsson D.,Biomass Bioen.,13(1997) 63.
[40] Bejan A.,Advanced Engineering Thermodynamics(Wiley-Interscience, New York) 1998. [41] Wall G., Life Cycle Exergy Analysis of wind power.in 2nd International Exergy, Life Cycle Assessment, and Sustainability Workshop & Symposium (ELCAS2) 19-21 June, 2011, Nisyros, Greece. Available online at: http://www.exergy.se/ftp/lceawp.pdf. [42] de Mora E. F., Torres C.andValero A.,Energy, (2012) 1.
[43] Gaudreau K., Roydon A. F. and Murphy S., Sustainability, 1 (2009) 1444; doi: 10.3390/su1041444
[44] Gaudreau K.,Exergy Analysis and Resource Accounting. Master thesis in Environment and Resource Science, University of Waterloo (2009).
[45] Odum H. T.,Environmental Accounting: EMERGY and environmental decision making (John Wiley, New York) 1996.
[46] Odum H. T., Environment, power, and society – For the twenty-first century: The hierarchy of energy (Columbia University Press, New York) 2007.
[47] Brown M.andUlgiati S.,Ambio,28(1999) 486.
[48] Bj¨orklund J., Emergy Analysis to Assess Ecological Sustainability. Doctoral thesis, Swedish University of Agricultural Sciences, Uppsala, 2000.
[49] Nørretranders T.,Mærk verden (Agraria 242) 1991, ISBN 10:91-0-057070-2.
[50] Box G. E. P., Robustness in the strategy of scientific model building. In Robustness in statistics, edited by Launer R. L. and Wilkinson G. N. (Academic Press, New York) 1979, pp. 201-236.
[52] Pollan M.,The Omnivore’s Dilemma – The search for a perfect meal in a fast-food world (Bloomsbury Publishing Plc, London) 2006, ISBN 978-1-4088-1218-1.
[53] Berneson S.andNilsson D.,Straw as an energy source – a review of existing knowledge, Rapport milj¨o och teknik 07 (2005), Uppsala.
[54] Sathre R., O’Connor J.,Environ. Sci. Pol.,13(2010) 104.
[55] Eriksson E., Gillespre A. R., Gustavsson L., Langvall M., Olsson M., Sahtre R. andStendal J.,Integrated carbon analysis of forest management practices and wood substitution.NRC Research Press Website.Can. J. For. Res.,37(2007) 671.
[56] Gustavsson L., Madlener R., Hoen H.-F., Jungmeier G., Karjalainen T., Kl ¨ohn S., Mahapatra K., Pohjola J., Solberg B. and Spelter H., Mitigation and Adaptation Strategies for Global Change,11(2006) 1097.
[57] Popper K.,Objective Knowledge, 2nd edition (Oxford University Press) 1979.
[58] Hill J., Nelson E., Tilman D., Polasky S.and Tiffany D.,Proc. Natl. Acad. Sci. U.S.A.,103(2006) 11206.
[59] Pimentel D.andPatzek T. W.,Nat. Resour. Res.,14(2005).
[60] Shapouri H., Duffield J., McAloon AandWang M.,The 2001 Net Energy Balance of Corn-Ethanol (preliminary)(US Department of Agriculture, Washington, DC) 2004. [61] B¨orjesson P.,Livscykelanalys av Salixproduktion. Lunds tekniska h¨ogskola. Institutionen
f¨or teknik och samh¨alle. Avd. f¨or milj¨o och energisystem. Rapport nr 60, Lund, 2006. [62] Felix E.andTilley D. R.,Energy,34(2009) 410.
[63] Silva Lora E. E., Escobar Palacio J. E., Rocha M. H., Grillo Ren´o M. L., Venturini O. J.andAlmaz´an del Olmo,Energy,36(2011) 2097.
[64] Venturi P. andVenturi G.,Biomass Bioen.,25(2003) 235.
[65] Kallivruossis L., Natsis A.andPapadakis G.,Biosys. Engin.,81(2002) 63. [66] Hovelius K.andHansson P.-A.,Biomass Bioen.,17(1999) 279.
[67] Shie J.-L., Chang C.-Y., Chen C.-S., Shaw D.-G., Chen Y.-H., Kuan W.-H. and Ma H.-K.,Bioresour. Technol.,102(2011) 6735.
![Fig. 1. – Oil production and consumption in relation to biofuel production 1990-2011 [1].](https://thumb-us.123doks.com/thumbv2/123dok_us/8644425.1434133/2.595.82.393.449.606/fig-oil-production-consumption-relation-biofuel-production.webp)
![Fig. 3. – FAO Food Price Index [4] and Brent Crude Oil Spot Price [5].](https://thumb-us.123doks.com/thumbv2/123dok_us/8644425.1434133/3.595.88.393.69.239/fig-food-price-index-brent-crude-spot-price.webp)
![Fig. 4. – Global primary energy consumption 2011 [1].](https://thumb-us.123doks.com/thumbv2/123dok_us/8644425.1434133/4.595.114.274.92.250/fig-global-primary-energy-consumption.webp)
![Fig. 5. – Different types of fuels obtainable from biomass [14].](https://thumb-us.123doks.com/thumbv2/123dok_us/8644425.1434133/5.595.66.415.360.593/fig-dierent-types-fuels-obtainable-biomass.webp)
![Fig. 6. – The dry-grind ethanol process [15].](https://thumb-us.123doks.com/thumbv2/123dok_us/8644425.1434133/6.595.97.382.72.260/fig-the-dry-grind-ethanol-process.webp)
![Fig. 7. – Chemical reaction of FAME [18].](https://thumb-us.123doks.com/thumbv2/123dok_us/8644425.1434133/7.595.77.411.72.163/fig-chemical-reaction-of-fame.webp)
![Fig. 8. – Ethanol production from cellulose, starch and sugarcane.Increased pretreatmentrequired for cellulose compared to starch and sugar [22].](https://thumb-us.123doks.com/thumbv2/123dok_us/8644425.1434133/8.595.75.415.67.285/ethanol-production-cellulose-sugarcane-increased-pretreatmentrequired-cellulose-compared.webp)
![Fig. 10. – Framework of EROI methodologies.The side axis determines what to includeintoIergy costs(non-energy),(direct inputs, indirect inputs, and/or externalities).The top axis dictates how to includenon-energy resources (ignore, convert to energy equivalents, or treat as irreducible.)Notethat because simple EROI ignores nonenergy inputs, it does not have a third order formthat accounts for externalities.Adapted from Mulder and Hagens [32].For descriptionof the equations Mulder and Hagens [32] is recommended.In short:EDin = energy in,k = various inputs, EDout = produced energy (in one or more forms), Oj = co-products {yk} = set of coefficients for a given production process giving the per-unit en- {Ik}, X = non-energy resource, ΠX,k = direct and indirect per-unit inputs of X Ik.](https://thumb-us.123doks.com/thumbv2/123dok_us/8644425.1434133/13.595.110.370.65.319/methodologies-includeintoiergy-externalities-equivalents-irreducible-externalities-descriptionof-coecients.webp)

