54 |
P a g e
ANALYSIS OF THE PROCESSING MODELS
OF COMPUTING
JOBY JOSEPH
1, C JOTHI VENKATESWARAN
2, A CLEMENTKING
31
Research Scholar, Bharath University, Chennai (India)
2Professor, Presidency College, Chennai (India)
3Associate Professor, King Khalid University (Saudi Arabia
)
ABSRACT
There are many computing models that are in use. Each model has its own advantages for its time. But as the
processing requirements grew exponentially, the need for faster processing computing models have been
evolving, supported by improved hardware support and novel architecture models. While most models have
brought about high degree of parallelism and scalability, some issues of bottleneck still need to be addressed.
The paper is an attempt to study these popular models and make a critical analysis of their performance,
scalability and parallelism.
Keywords: Distributed Computing, Cluster Computing, Grid Computing, Cloud Computing
I.
INTRODUCTION
This chapter takes up a detailed analysis of the various processing models explained in the previous chapter.
Beginning with the analysis of the initial single mode of processing, multi-processing, multi-programming models and
then proceeds to look at the advanced models of computing like client-server architecture, distributed architecture,
cluster computing, grid computing and the advanced model of cloud computing. The last part of the chapter is the
discussion in detail about the Cloud Architecture along with the performance analysis.
II.
VARIOUS COMPUTING MODELS
The earliest style of computing was the Single-Processor computing model that allowed
single-user-uni-programming computational environment. The single process computing environment allowed only limited CPU power
in keeping with the availability of the technology. The constraints that limited processing were from CPU power and
the computing environment [1]. In most the initial models of computing did not make an effective use of the related
resources of the computer. This was primarily due to the difference performance speed between the CPU and the
resources attached to the system [2]. This led to long idle time for CPU while waiting for slow peripherals.
An improvement to the uni-programming style was from the introduction of the batch stream operation. Here
multiple-jobs could be submitted and the system would handle each job executing each in sequence [2]. The processor
utilization was as in the case of single process systems as they were engaged totally while they reported a zero level
utilization between intervals of batch processes or while awaiting resource responses. The degree of parallelism
reported is nil as in single process systems. The complexity function for the processing is O(n), where n is the number
55 |
P a g e
addition to the efficiency and speed factor of processing. As the multi-processing uses more than single processor to
carry out a given job, it brought notable computing efficiency into the performance matrix with respect to time and
parallelism as compared to the preceding models [6].
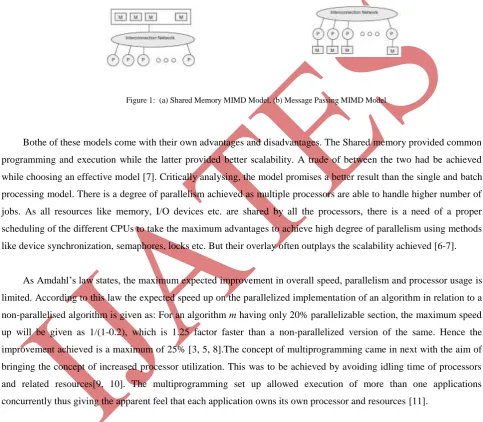
The most commonly used multi-processing style was the Multiple Instruction Stream Multiple Data Stream
(MIMD) model of computing as suggested by Flynn in 1966 [4]. As MIMD came into execution in computing systems,
they were realized in two styles as a shared memory model or as a message passing model. The architectural diagrams
are shown below:
Figure 1: (a) Shared Memory MIMD Model, (b) Message Passing MIMD Model
Bothe of these models come with their own advantages and disadvantages. The Shared memory provided common
programming and execution while the latter provided better scalability. A trade of between the two had be achieved
while choosing an effective model [7]. Critically analysing, the model promises a better result than the single and batch
processing model. There is a degree of parallelism achieved as multiple processors are able to handle higher number of
jobs. As all resources like memory, I/O devices etc. are shared by all the processors, there is a need of a proper
scheduling of the different CPUs to take the maximum advantages to achieve high degree of parallelism using methods
like device synchronization, semaphores, locks etc. But their overlay often outplays the scalability achieved [6-7].
As Amdahl’s law states, the maximum expected improvement in overall speed, parallelism and processor usage is
limited. According to this law the expected speed up on the parallelized implementation of an algorithm in relation to a
non-parallelised algorithm is given as: For an algorithm m having only 20% parallelizable section, the maximum speed
up will be given as 1/(1-0.2), which is 1.25 factor faster than a non-parallelized version of the same. Hence the
improvement achieved is a maximum of 25% [3, 5, 8].The concept of multiprogramming came in next with the aim of
bringing the concept of increased processor utilization. This was to be achieved by avoiding idling time of processors
and related resources[9, 10]. The multiprogramming set up allowed execution of more than one applications
concurrently thus giving the apparent feel that each application owns its own processor and resources [11].
The architecture is achieved through either time sharing the processor in an uniprocessor environment or
space-sharing the processor among the different programs in a multi-processor environment [12]. A number of studies have
calibrated the performance of both time sharing and space sharing models of architectures. Andrew Tuckerr et al [13]
has shown in the research results that in the case of time sharing, it degrades performance at the level of the processors,
cache and related resource. And study by Cathy McCann et al [14] was a comparative study of both the above policies
in performance. Their result showed that a better rating of space sharing policy over the time sharing model of multi
56 |
P a g e
III.
DISTRIBUTED COMPUTING
As computing world looked at better models of realizing scalability and processing speed distributed style of
computing become a promising mode. A performance analysis of this model is brought out in the coming section. The
aim of the distributed model is to keep the utilization index always at the optimum. The index should be below the
possible utilization bound [15]. In the Distributed Computing architecture the great gain was that jobs could be
switched and moved idle processors or workstations. Such task migration from overloaded workstations to idle
processors improves better processor utilization. According Ioana et al [3].The increase of processor number does not
necessarily provide guaranteed linear growth of performance through put[4].
The next analysis considered is with respect to processor idle time and parallelism. The chief goal of a distributed
architecture is to realize “economic efficiency” in the use resources, idle time thus bringing high degree of parallelism
[16]. According to performance results observed by Jinokim [11], the improvement on distributed models can be rated
to a factor of 63% as compared to normal systems in the same setup. The experiment was done with respect to a greedy
based parallel downloading that used 10 blocks of data each of 4 MB. The result reports that there is an increase in the
parallel dimension of the execution. The experiments of Kotsis [17] also notes a notable improvement in the parallelism
point of the system. The factor that left unattended is the idle time of the distributed system. An element of resource and
processor underutilization is reported side by side.
IV.
CLIENT-SERVER COMPUTING
In the pursuit of higher degree of parallelism and efficiency, the new model of Client-Server architecture of
processing came to the front. An analysis of this model of processing is done in this section. The C-S model of
information processing allowed the unique characteristic of co-operative computing facility that allows to physically
split the processing job into Client’s role and the Server’s role, but presenting to the user a unified model of data
processing [18 -19]. The performance matrix of C-S model can reveal lot of interesting results. There is no doubt
that it promises a higher degree of parallelism and distributed computation that occurs across the clients or the servers
allowing substantial increase in the efficiency of the processing model. However, the models did also throw up some
crunches when real data of results are viewed.
As indicated by the experiment of Barry, there is an overhead of 15 minutes time, used for data transfer when
the processing is done over the clients. Hence compared to the server execution of the same process, there will be an
additional overtime of 15 min, when the job is over the clients. This reported overhead is spent on the network traffic as
many clients get into the array of processing. The overlay of client delay time and idle time are high over the C-S
57 |
P a g e
V.
CLUSTER COMPUTING
Though the concept of cluster computing was an old concept as back in 1960, it gained the momentum in
1980s. The factors that added up to this are the release of high performance microprocessors, high speed network
devices and an environment standard which supported distributed computing. The concept of cluster computing has
brought to the IT arena even common PCs as cost effective processing modules giving the architecture a notable degree
of parallelism and computational power [22]. In the context of this promise, there is a need of analysing the
performance of the cluster model against set bench marks of processor and resource utilization, parallelism and idle
time in processing. In most recent cluster configurations use Symmetric Multiprocessors (SMPs) and high bandwidth
connections interconnecting these clusters nodes. These allow low latency and high bandwidth connection. Here is a
performance report of the CPU utilization index and related performance values.
The configuration that supports best results allotment and utilization is the SSI(Single System Image), where
the distributive and heterogeneous nature of the resources is apparently hidden from the user and it virtually presents
as a single entity- like a unified powerful single system. Though this configuration allows high degree of availability
and scalability of noes, there is often underutilization of processors and resources within the cluster [23]. Though there
is a saving and economy on configuration the overall processor utilization here is poor. According to the observed
results of Buyya et al [23], there is 70-90% idle time for a node for the node processors. According to other observed
results, under low end and high end cluster there is often the happening of cross migration of jobs across processors.
These are reported in Buyaa et al [23] and are due to heavy load on processors or availability of free processors within
the cluster [23,24].
According to the results of Henry [24], the cluster model exhibits a weak scalability and parallelism.
According to their observed results, a cluster shows an increased level of scalability at minimum value. The experiment
of Henry was done on a NCSA-1024 processors PIII/1 GHz Linux Cluster. The results reported a weak scalability
factor as shown in the table below:
S.No. Number of Processors Scalability
Index
1. 1 2
2. 2 2.5
3. 4 2.7
Table 1.1 Performance index of Cluster Computing
From the above table, it is clear that the growth of scalability is very minimal and there is still room for a
higher degree of parallelism and cluster scalability. Coming to the issue of parallelism and idle time, as observed by
Buyaa et al in their experiments [23], there is a maximum factor of 70-90% workstation and resource underutilization.
Most CPU cycles go wasted in the cluster configuration as reported by Baker et al in their experiment [25]. There is a
factor that can be introduced to take care of these idle time basing on the unused CPU cycles [ 23,24]. As the aim
58 |
P a g e
the number of processors in the cluster. The ideal according to Heny Neeman [26] is to achieve the linear speed up, but
very few cluster configurations attain this level of parallelism.
VI.
VIRTUALIZED GRID COMPUTING
The Grid computing model consists of the availability of resources and processing power over a virtualized
environment [27]. In the section that follows is a performance analysis of the Virtualized Grid system architecture with
respect to the processor and resource utilization, degree of parallelism and idle time management. As Grid computing is
a technology fully realized and executed in Virtualization, the performance evaluation will also take care of the factors
that affect virtualized computing. An accurate performance evaluation of the Grid model will involve many
parameters and considerations. There exits too many performance evaluation indices done over the efficiency of the
Grid structure. Various researches have rated the performance under various category. In keeping with the interest of
the research, the section studies the performance against the factors of concern. The study and result of Radu Prodan et
al [28] is more about the performance of the workflow and other various overheads involved in the grid. But basing on
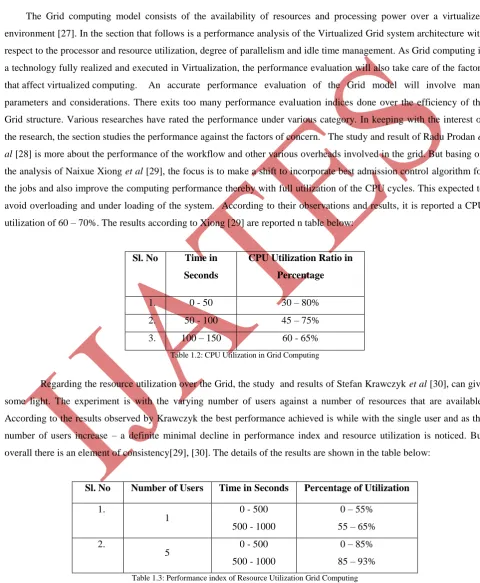
the analysis of Naixue Xiong et al [29], the focus is to make a shift to incorporate best admission control algorithm for
the jobs and also improve the computing performance thereby with full utilization of the CPU cycles. This expected to
avoid overloading and under loading of the system. According to their observations and results, it is reported a CPU
utilization of 60 – 70%. The results according to Xiong [29] are reported n table below:
Sl. No Time in
Seconds
CPU Utilization Ratio in
Percentage
1. 0 - 50 30 – 80%
2. 50 - 100 45 – 75%
3. 100 – 150 60 - 65%
Table 1.2: CPU Utilization in Grid Computing
Regarding the resource utilization over the Grid, the study and results of Stefan Krawczyk et al [30], can give
some light. The experiment is with the varying number of users against a number of resources that are available.
According to the results observed by Krawczyk the best performance achieved is while with the single user and as the
number of users increase – a definite minimal decline in performance index and resource utilization is noticed. But
overall there is an element of consistency[29], [30]. The details of the results are shown in the table below:
Sl. No Number of Users Time in Seconds Percentage of Utilization
1.
1 0 - 500
500 - 1000
0 – 55%
55 – 65%
2.
5 0 - 500
500 - 1000
0 – 85%
85 – 93%
59 |
P a g e
The next concern is the degree of parallelism and idle time in the virtualized grid configuration. According to
the experiments by Krawczyk [30], the waiting time reported is high. This could be because of the reason that the
policy of satisfying all requests. According to the best scheduler suggested by the experiments there is a reduction in the
amount of idle time, the queuing time depending up on the arrival scheme used for the jobs in the architecture. The
details are produced below in the table 1.4:
Sl. No Arrival Scheme Average Waiting Time in
Percentile
(Scale of 1 – 10)
1. Random Auction 3
2. Volunteer Schedule 6
3. Auction on Load 4
4. Waiting Auction 8.5
Table 1.4: Job Arrival schemes and their mean performance in Grid Architecture
In order to rate the parallelism of the Grid, the experiment and performance evaluation performed by Dario et
al [27] can be considered. According to their observed results , when the grid is highly loaded, the parallel performance
is reportedly good. If the job arrival rate reported is 0.0032 job/sec, the observed parallelism is commendable. As the
configuration gets saturated and jobs have an arrival rate of 0.0044/sec, then there is reportedly a drop in the parallel
performance of the system. Hence, the degree of parallelism can be boosted in the grid virtual environment. An
introduction of a novel processing style can bring this factor.
V. CLOUD COMPUTING
The Cloud Architecture is a commercial infrastructure set up that promises computing services at different
levels to the clients. It is a Service Oriented Architecture that is gaining wide coverage and acceptability in the world of
Information Technology [31]. In the Cloud Architecture of computing, there is the full realization of virtualization that
makes resources, platforms and infrastructure available as a service [31,32]. Though there are many Cloud Providers
available in the world, the real choice of one for the need of high end scientific researchers is a hard one to find. The
many available cloud providers need to be really analysed against their performance indices to rate and make a choice
of any for higher computing [31,3332]. In Cloud environment resources like files, programmes, data streams, platforms
and even the very hardware itself is made accessible to the clients [34]. The QoS has to be rated best since it is often a
pricing and service model.
As reported by Alexandru Ioasup [31] et al, the bottleneck problem of the Cloud Architecture is a real issue.
In most cases, it is a CPU, I/O Device or memory that stands on the way of higher level of efficiency and parallelism. In
the light of interest of the research, the focus is on the Cloud Architecture as one with a realm of infinite computing
possibilities. The performance indices available in two common cloud models are analysed to arrive at their actual
efficiency. In the sections that follow, a detailed study is done on Amazon EC2 and Google Cloud. In the case of
60 |
P a g e
substantial proof to this. In the Amazon EC set up, the user is allowed to stretch or shrink the infrastructure needed by
starting or ending a virtual service called the Instance. The set up allows a maximum of 20 such instances for a user
[79]. According to the observed results of Alexandru, the average CPU utilization is of very low index in the Amazon
set up. The EC2 system architecture does not even allocate additional free and unutilized CPU cycles to waiting
processes or users. In contrast, if there is a sanction of 100% of CPU power to a user, there exists no provision of giving
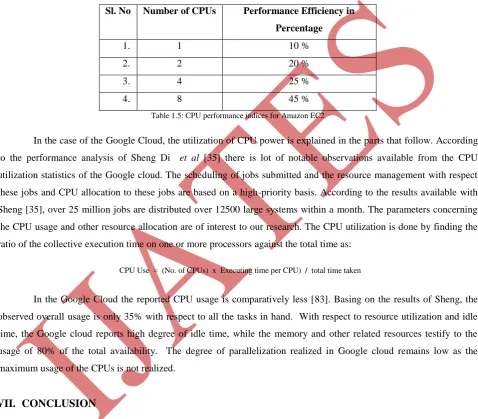
back the extra and unwanted the CPU control [31 - 32].The table 3.8 gives the performance indices of the Amazon EC2
cloud against CPU utilization [31].
Sl. No Number of CPUs Performance Efficiency in
Percentage
1. 1 10 %
2. 2 20 %
3. 4 25 %
4. 8 45 %
Table 1.5: CPU performance indices for Amazon EC2
In the case of the Google Cloud, the utilization of CPU power is explained in the parts that follow. According
to the performance analysis of Sheng Di et al [35] there is lot of notable observations available from the CPU
utilization statistics of the Google cloud. The scheduling of jobs submitted and the resource management with respect
these jobs and CPU allocation to these jobs are based on a high-priority basis. According to the results available with
Sheng [35], over 25 million jobs are distributed over 12500 large systems within a month. The parameters concerning
the CPU usage and other resource allocation are of interest to our research. The CPU utilization is done by finding the
ratio of the collective execution time on one or more processors against the total time as:
CPU Use = (No. of CPUs) x Executing time per CPU) / total time taken
In the Google Cloud the reported CPU usage is comparatively less [83]. Basing on the results of Sheng, the
observed overall usage is only 35% with respect to all the tasks in hand. With respect to resource utilization and idle
time, the Google cloud reports high degree of idle time, while the memory and other related resources testify to the
usage of 80% of the total availability. The degree of parallelization realized in Google cloud remains low as the
maximum usage of the CPUs is not realized.
VII.
CONCLUSION
The paper presented against each model of computing, its respective performance indices. The data reported are
basing on the existing research results. As there is an incremental growth in the processing achieved, there are
performance issues and efficiency that are often left out. In the light of the analysis of the various computing models,
the focus is to look into this factor of efficiency, so that while processing speed is achieved, the optimum performance
61 |
P a g e
REFERENCE
[1]. Joel M Crichlow, “An Introduction to Distributed and Parallel Computing”, 2nd Edn., Eastern Economy
Edition, New Delhi, 1997.
[2]. M. Sasikumar, Dinesh Shikhare and P. Ravi Prakash, “Introduction to Parallel Processing”, PHI, New Delhi,
2006.
[3]. Tilak Agerwala and Siddhartha Chatterjee, “Computer Architecture: Challenges and Opportunities for the
Next Decade”, pp. 58 – 69, 2005.
[4]. Julian Bui, Chenguang Xu and Sudhanva Gurumurthi, “Understanding Performance Issues on both Single
Core and Multi-core Architecture”.
[5]. Joel Emer, Mark D. Hill, Yale N. Patt, Joshua J. Yi, Derek Chiou and Resit Sendag, “Single-Threaded Vs
Multithreaded: Where Should We Focus ?”, pp. 14 – 24, 2007.
[6]. Netezza Performance Server, Data Warehouse Appliance: An Architectural Comparison” White Paper, 2006.
[7]. Timothy Roscoe, “Lecture 24: Multiprocessing Computer Architecture and Systems Programming,
Herbstsemester, 2011.
[8]. Gene M. Amdahl, “Validity of the Single Processor Approach to Achieving Large Scale Computing
Capabilities”, AFIPS Spring Joint Computer Conference, 1997.
[9]. Chee, Shong Wu, “Processor Scheduling in Multiprogrammed Shared Memory NUMA Multiprocessors”, pp.
1 – 75.
[10].Edsger W. Dijkstra, “The Structure of the “THE” Multiprogramming System”, in Communications of the
ACM Volume 11/ Number 5. pp. 341 – 346, May, 1968.
[11].Per Brinch Hansen, “The Nucleus of a Multiprogramming System”, in Communications of the ACM, Volume
13, No. 4, pp. 238 – 250, April 1970.
[12].Shikharesh Majumdar, Derek L Eager and Richard B Bunt, “Scheduling in Multiprogrammed Parallesl
Systems”, in Proc. of ACM SIGMENT-RIGS pp. 104 -113, May 1988.
[13].Andrew Tuckerr and Anoop Gupta, “Process Control and Scheduling Issues for Multiprogrammed Share
Memory Multiprocessors”, in Proc. of 12th
ACM SOSP, pp. 159-166. December. 1989.
[14].Cathy McCann, Raj Vaswani and John Zahorjan, “A Dynamic Processor Allocation Policy for
Multiprogrammed Shared-Memory Multiprocessors” in Journal of ACM Transactions on Computer Systems
(TOCS), Volume 11, Issue 2, pp., 146 – 178, May 1993.
[15].Chenyang Lu, “CPU Utilization Control in Distributed Real-Time Systems”, Introduction to control Theory,
Sigmetrics 2008.
[16].Alvin AuYoung, Brent N. Chun, Alex C. Snoeren, Amin Vahdat and UC San Diego, “Resource Allocation in
Federated Distributed Computing Infrastructures”.
[17].Gabriele Kotsis, “Performance Management in Parallel and Distributed Computing Systems”, December 1999.
[18].Barry R. Cohen, “Evaluation of Client/Server Configurations For Analytic Processing”.
[19].Matteo Bertocco, Franco Ferraris, Carlo Offelli, and Marco Parvis, “A Client–Server Architecture for
Distributed Measurement Systems”, in IEEE Transactions on Instrumentation and Measurement, Vol. 47, No.
62 |
P a g e
[20].Istabrak Abdul-Fatah and Shikharesh Majumdar, “Performance of CORBA-Based Client-Server
Architectures”, in IEEE Transactions on Parallel and Distributed Systems, Vol. 13, No. 2, pp. 111 – 127, Feb. 2002.
[21].Fernando Pianegiani, David Macii and Paolo Carbone, “An Open Distributed Measurement System Based on
an Abstract Client-Server Architecture”, in IEEE Transactions on Instrumentation and Measurement, Vol. 52,
No. 3, pp. 686 – 692, June 2003.
[22].Joseph J. Martinka, “Requirements for Client/Server Performance Modeling”, 2009.
[23].Charles H. Davis, David Arthurs, Erin Cassidy and David Wolfe, “What Indicators for Cluster Policiesin the
21st Century?”, Blue Sky II 2006, pp. 1 – 15, August 25, 2006.
[24].Mark Baker, Rajkumar Buyya, Hai Jin and Toni Cortes, “Cluster Computing”, in Future Generation Computer
Systems, Vol. 18, No. 8, 2002.
[25].Mark Baker, Amy Apon, Rajkumar Buyya and Hai Jin, “Cluster Computing and Applications”, Encyclopedia
of Computer Science and Technology, Vol.45, (Supplement 30), (A. Kent and J. Williams, Editors), pp.87-125,
Marcel Dekker, Inc., New York, USA, Jan. 2002.
[26].Henry Neeman, “Parallel & Cluster Computing”, SC08 Parallel & Cluster Computing: Parallelism Overview
University of Oklahoma, August 10-16 2008.
[27].Mark Baker, “Cluster Computing White Paper”, Version 2.0, December, 2000.
[28].Dario Bruneo, Marco Scarpa, and Antonio Puliafito, “Performance Evaluation of gLite Grids through GSPNs”,
in IEEE Transactions on Parallel and Distributed Systems, Vol. 21, No. 11, pp. 1611 – 1625, November 2010.
[29].Radu Prodan, and Thomas Fahringer, “Overhead Analysis of Scientific Workflows in Grid Environments”,
IEEE Transactions On Parallel And Distributed Systems, Vol. 19, No. 3, pp. 378 – 393, March 2008.
[30].Naixue Xiong, Xavier D´efago, Yanxiang He and Yan Yang, “A Resource-Based Server Performance Control
for Grid Computing Systems”, pp. 57 – 64.
[31].Stefan Krawczyk and Kris Bubendorfer, “Grid Resource Allocation: Allocation Mechanisms and Utilisation
Patterns”, 2007.
[32].Alexandru Iosup et al, “Performance Analysis of Cloud Computing Services for Many-Tasks Scientific Computing”, in IEEE Transactions on Parallel and Distributed Systems, Vol. 22, No. 6, pp. 931 – 945, June
2011.
[33].Michael Armbrust et al, “Above the Clouds: A Berkeley View of Cloud Computing”, Technical Report No:
UCB/EECS-2009-28, 2009.
[34].Hamzeh Khazaei, Jelena Misic and Vojislav B. Misic, “Performance Analysis of Cloud ComputingCenters
Using M-G-m-m-þ-r Queuing Systems”, in IEEE Transactions on Parallel and Distributed Systems, Vol. 23,
no. 5, pp. 936 – 943, May 2012.