Determinants Of School Performance
(Quantitative Approach To The Middle School
Performance Management In Salatiga City )
Muhammad Munadzir, Fakhrudin, AT Sugito, Heri Yanto.
Abstract: School performance has been a crucial process of managing resources to improve the quality of education in Indonesia. The output quality determined by a good performace managements. Purpose - Aim of this research to examine the impact of some variables whose relationship interaction each other. Methodologie -This research used quantitative survey method. The data obtained from questionnaires involving 658 teachers from the secondary in Salatiga City, Cetral Java, Indonesia , using proportionate stratified random sampling. The analysis used descriptive and inferential statistical technique. Results - It proved that managerial competence, interpersonal communication and leadership competence affected to school performance through quality culture.There is a positive and significant correlation influence of interpersonal communication on quality culture reaches 46 %. Managerial competence to quality culture by 40 %. Leadership competence to quality culture at 14 %. Managerial competence to school performance of 8% through quality culture. The impact of interpersonal communication on school performance reaches 46 %. The leadership competence to school performance by 24% . And quality culture to school performance is 40%..
Index Terms: Managerial Competence, Interpersonal Communication, Leadership Competence, Quality Cultuteand School Performance.
————————————————————
1
INTRODUCTION
The nation future will be determined by the human resourcesquality . Therefore education is the strategic way to prepare smart, character, independent and responsible generations. The role of school performance management is fundamental to the development and achievement of school achievements (Sarrico: 2012). The key element of school performance professionalism practicehow to provide and produce customers satisfaction (Wibowo: 2013). Each organization must be able to map workload analysis and competencies , so that it can formulate an appropriate and accurate programewith strong expectations to be able to carry out tasks with right techniques and target to increase performance productivity (Nahariah: 20). Several ways to compare of school performance can be measured through raw-input, added value, continuity regression design, progress curve analysis, multi-level models and comparative school type similarity (Robinson: 2010). The construct of school performance according to Government Regulation No. 19/2005 Article 2 paragraph (1) reflected in school leadership practicesdimentions, learning practices, environmental conditions,school academic culture and parenting participation in the education process in eight of the National Education Standards implicitly through the External Quality Assurance System. So that the achievement of educational and teaching objectives must be prioritized before considering integral school characteristicsapproach (Robinson: 2010). The school performance quality problems inherently from managerial influence and the culture of organizational quality.Culture is a whole system of thinking, values, morals, norms, and human beliefs as a product of human interaction with others and the
environment and then produces social systems, economics, knowledge, technology and art (Ministry of National Education: 2010). Quality includes excellent service to customers, high social responsibility, and customer satisfaction, especially students as the center of attention according to market needs (Usman: 2006). Culture of educational quality includes inputs, processes, and outputs and outcomes through active, innovative, creative, effective and enjoyable learning processes resulting in superior academic and non-academic achievement outputs. On the other side, competencies have a positive effect on competitive advantage. Capability has a significant effect on competitive advantage of company performance ( Mandala: 2017). Performance is also a manifestation of ability in the form of real work and job results achieved by employees carrying out of tasks and works come from the organization (Priansa: 2014). The role of schools in providing quality education services is largely determined by the leadership of school principals in providing quality education for students. Principals must be able to develop innovative programs and mobilizing for all teachers and staff to achieve their goals. The manager is principally responsible for the implementation and development of school culture, but actuality all school members must be responsible for the creation of school culture (Ancok : 2012 ). The school performance activation can’t self supportingbut influenced by supplementary factors starting from managerial competence, interpersonal communication , leadership competence and quality culture.
2 RESEARCH METHODS AND VARIABLES
2.1 Research Design
This method using quantitative positivistic through the second order Confirmatory Factor Analysis (CFA) model approach, where the model settled in previously through the theoretical discussion with characteristics one internal factor has several indicators. The design of correlational descriptive research to get information related to the phenomenon currently observed and explaining of the relationship existence based on variable sizes of the correlation coefficient. The impact analysis tools used from the pattern of linear interrelationships ___________________________
• Management Education Department, Universitas Negeri Semarang, Indonesia. E-mail: [email protected].
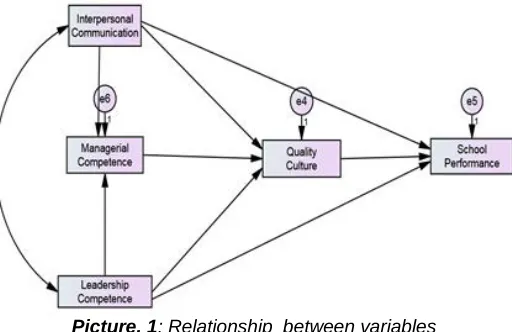
between variables known as the path analysis model. Because there is a mediating influence between the independent withdependent variable. As for the research variables include five variables.They areexogenous and endogenous. The exogenous are interpersonal communication (X.1), managerial competence (X.2), leadership competence (X.3), and quality cultute (Y.1)as an intervening. While the endogenous is school performance (Y.2).
Picture. 1: Relationship between variables
2.2 Population and Samples
The data obtained from questionnaires involving 658 teachers from the secondary in Salatiga City, Cetral Java, Indonesia , using proportionate stratified random sampling. The analysis used descriptive and inferential statistical technique.
3 RESULT AND DISCUSSION
3.1 Research Result
The results of data analysis with AMOS version 21 are discussed about the relationship of interpersonal communication, managerial competence and leadership competence to school performance through quality culture using the path analysis model. As for, theaim of using this path analysis model to determine the direct and indirect effects of interpersonal communication , managerial competence, leadership competence to school performance through quality culture. Hypothesis testing begins by testing the suitability of the model, by describing the relationships between variables in the form of a path diagram then estimating the results of data processing. Path Diagram serves to see the quantity of directly and indirectlyinfluences each variableto the school performance. Path model figure of 211 respondents as shown at fig. 2 , then processed using Amos programe version 21 with the output of Mahalonobis distance (a means of detecting observation scores with a centroid skort)and found out there were 2 respondents who hadfar values different from the centroid value (14,850) whichconsidered as an outlier. So it must be dropped from the analysis. Based on results of the mahalonobis distance respondents who qualified were 209 person only. From those, the analysis model had been described. After forming model based onthe theory, the path analysis model and diagram obtained and built. This , makes easier to see of the causality relationship to be examined. Meanwhile gotten the path diagram for the processed data through Amos 21 as follow :
Figure 2. Figure Path Diagram
Information :
School Performance_Tot : School Performance Managerial Competence_Tot : Managerial
Competence Interpersonal
Communication_Tot
: Interpersonal Communication LeadeshipCompetence_Tot : Ledearship
Competence Quality Culture_Tot : Quality Culture
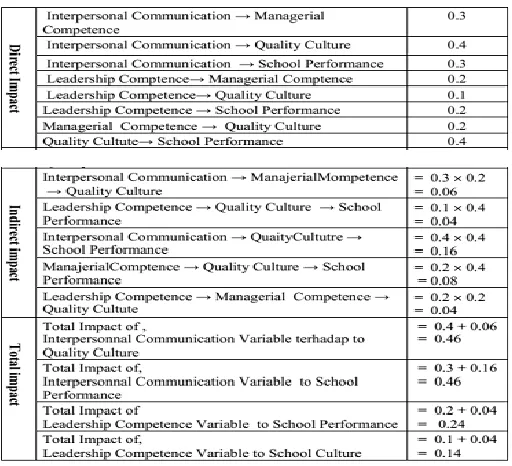
Based on the path diagram above, then formed there lationship between variabelstabel as below:
Table 1
Relationships Between Variables
Based on the path diagram processed by the AMOS version 21 program then examined by Goodness Of Fit test (model conformity) performed. The results of the goodness off fit test shown as table below:
Table
Results of the goodness off fit test
Standard Goodness of Fit
Goodness of Fit Acceptance
Limit Result
Chi Square The Smaller ,the better 1.776
RMSEA 0,05≤ RMSEA ≤ 0,08 0.061
TLI 0,80 ≤ GFI ≤1 0.973
CFI 0,80 ≤ GFI ≤ 1 0.997
NFI 0,80 ≤ GFI ≤ 1 0.994
magnitude of the overall effect, direct and indirect effect of one variable and each others.The basis for making the decision test of significance for regression weight is:
If the p-value < alpha 0.05, the hypothesis becomes zero (0) and H0 is rejected, meaning that there is an influence between the two variables statistically. If p-value > alpha 0.05, then the hypothesis becomes
zero (0) and H0 is accepted, meaning that there is no statistical influence between the two variables.
Here is a summary analysis of the path table:
Table 3
Regression Weight Results
Based on table 3 , the path coefficient has an estimated and CR value. From the results of processing with the AMOS program the regression weight values obtained as shown on table above. The estimated as the path coefficient value or the relationship of latent constructs. CR value is the value of a significant relation of each variable. This study uses a 95% confidence level or α = 0.05. If the CR value>1.96 , so it can be said that the relationship between each variables is significant. The following are outputs of the direct and indirect impact values from the path analysis results :
Table 4
Results for the direct impact and indirect impact values
From the results of tables3 and 4 can be interpreted as below:
(1) The effect of managerial competence to quality culture
From table 3, it can be seen that the p-value = 0,000 <5%, with the path coefficient of the managerial competency variable to the quality culture of 0.2. This proves that there is a significant influence between managerial competence to quality culture by 20%.So the managerial competency has a significant influence to quality culture in schools. In other words, it can be interpreted by the principals who have high managerial competence, will greatly affect for the progressiveness of the quality culture where he leads. By increasing managerial competence through various professional activities in sustainability, management training for the principals strengthening, learning leadership, resources and change management , will create increasing more quality of school culture.
(2) The influence of interpersonal communication toquality culture
From table 3, it can be seen that the p-value = 0,000 <5%, with the path coefficient of the interpersonal communication to a quality culture reaches 0.46. This proves that there is a significant influence between managerial competence to quality culture by 46%. So that interpersonal communication variables have a considerable influence toquality culture in schools. So that, from this result can be interpreted that the higher skill of interpersonal communication whose principal mastered in the school communities, the greater contribution realized to the quality of school culture. The magnitude of the influence of interpersonal communication can encourage a harmonious, dynamic and even competitive work atmosphere in an effort to improve quality. Reflection of interpersonal communication among school members stimulates the transparency of communication in managing problems. Finally, various obstacles are easily overcome in an effort to improve the quality of school performance.
(3) The influence of leadership competence toquality culture
From table 3 it can be seen that the p-value = 0,000 <5%. This means that there is a significant influence between leadership competence on quality culture. The quantity of the effect of leadership competence To quality culture can be seen in table 4, which is 14%. From these results it can be interpreted that principals who have high competence in leadership ,will improve the school quality culture. Therefore, various approaches of leadership application in managing organization need to be continuously improved. Besides upgrading leadership competencies can be expanded through multi-literation.
(4) Effect of managerial competence to school
performance.
when the principals’ managerial competency determines the quality culture progressiveness, the process will impact the school performance quality. . Therefore various aspects of principals’ managerial competence which includes personality and social, learning leadership, school development, resource management, change management, supervision and entrepreneurship need to be realized managing school institutions continuously.
(5) The effect of interpersonal communication toschool performance
Evidence of the table 3 above seen that p-value = 0,000 <5%. This means there is a significant influence between thre interpersonal communication To the school performance. The magnitude influence of interpersonal communication to school performance such as in table 4 reaches 0.46. From this value it can be interpreted that interpersonal communication variables have a significant influence on school performance by 46%. These results can be interpreted that the higher principal's interpersonal communication, the more school performance quality achieved .The partnership and membership building need to be sharperned and developed through various public relations activities both internally and externally.
(6) Effect of leadership ability to school performance From table 3 it can be seen that the p-value = 0,000 < 5%. This means thereis a significant influence between leadership competence on school performance. Magnitude of leadership competence on school performance such as in table 4 , whose 0.24. This means that the affectof leadership competence to school performance has been significant on by 24%. It can be understood, the principals who have high leadership competence, is very influential on the high quality of school performance. Various activities strengthening the principal's leadership need to be maintained managing school organizations to produce the school performance quality.
(7) The influence of quality culture to school performance
Acquisition of p-value = 0,000 < 5% from table 3 above meant that there is a significant influence between quality culture to school performance of 0.4. or 40%. This interpretation concuded ,the more quality of school culture advanced, the more progressiveness of school performance got. When the school culture quality has been running well , it will increase easier work ethic and public trust to realize dynamic school performance. Principals, teachers, employees and all school members working hard in maintaining and enhancing quality culture. So whoever leads the schools will be bound of the cultural quality ecosystem which become school's branding.
8) The influence of interpersonal communication to managerial competence.
While the influence relationship between interpersonal communication and managerial competence as shown in table 4 above is 0.3. This proves tthat the size of theirinfluence is so significant at 30%. So both vertically , horizontally and diagonally interpersonal communications interpreted that aspects giving a lot of contribution improving managerial competence of school principals. Therefore various approach to actualize communicative dialogue need to be prioritized in school organizations each others.
(9) Effect of leadership competence tomanagerial competence.
As seen in table 4 above, the leadership competence variable has a positive influence to managerial competence of 0.2. This is merely proof of positive influences of 20%. So it can be interpreted that leadership competence adds value to the principal's managerial competence. In other words, the principal's managerial skills enriched with extensive experience in applying of leadership approaches and leadership literations. Because the managerial problemskeep following the change fluctuation.
3.2. Discussion
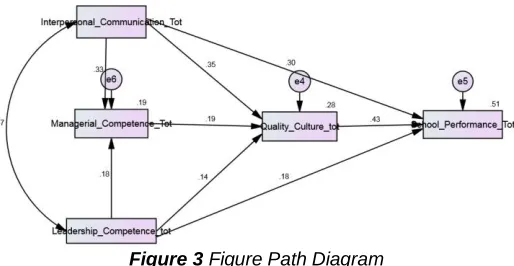
Based on summary of theinfluenceof all path coefficients results that have been analyzed, the results following described :
Figure 3 Figure Path Diagram
adhered to the interpersonal communication variables and leadership competencies. The relationship synergy between these variables then manifesting satisfactory of school performance. From these interpretations shown there is no directly affect of the managerial competency variables to school performance. However, managerial competence directly influences to quality culture implicitly and more dominant influences on school performance. So that ,quality culture has a central role improving the school performance. Substitution of principal, leadership change will not reduce personal work ethos caused the school culture quality running optimally.
IV. CONCLUSIONS
All exogenous showed a strongly positive affiliation on the impact correlation to endogenous school performance. The strength of reationship disappears at results for the direct impact and indirect impact values. Indeed research spanning two months and observing performance in many different educational settings provide strongs and consistent evidence and exactly related to school performance. Moreover concluded that the secondary school performance quality in Salatiga influenced by the existence of school culture quality, interpersonal communication, managerial competence and leadership competence of principals. Therefrom , strengthening , upgrading and management for capacity building should be increased to develop the six competence of principals , such as social personality, learning and teaching management, , management of change, entrerpreneurship and supervision and school development.
REFERENCES
[1]. Sarrico, Cláudia.S, RosaMaria and Manatos Maria, 2012,School Performance Management Practices and School Achievement. International Journal of Productivity and Performance Management, Vol. 61 Iss: 3 pp. 272- 289. Permanent link to this document: http://dx.doi.org/10.1108/ 1741040121 1205641 [2]. Robbins, Stephen P. & Judge, Timothy A.
2016.Organizational Behavior. Jakarta: SalembaEmpat
[3]. Regulation of the Minister of National Education Number Year 2016.Primary and Secondary Education Quality Assurance System. Jakarta
[4]. AndanaAchmadQrurtama, 2016.The influence of interpersonal , motivation and discipline on teacher performance in Jogjakarta High School.
[5]. Ardana, I.K, Ni Wayan M and I Wayan M.U. 2012.Human Resource Management. Yogyakarta: Graha Science.
[6]. Tri JokoRahardjo, YeniMurniasih, Djuniadi, 2016.The Effects of Academic Supervisives, Interpersonal Communication and Work Motivation on Teacher Performance in Jepara.Educational Management http://journal.unnes.ac.id/sju/index.php / eduman EM 5 (2 ) (2016)
[7]. Pickled, A.Z. 2012.Organizational Culture, Leadership Styles and Organizational Commitments in Turkish Logistics Industry.Procedia - Social and Behavioral Sciences, 58, 217-226. https://doi.org/10/1016 /j.sbspro. 2012.09.995
[8]. Ancok, Djamaludin. 2012. Psychology of Leadership and Innovation. Jakarta: Erlangga.
[9]. Al-Bourini, FA, GhaithM,Al-Abdallah, Azzam A. AbouMoghli. 2013. Organizational Culture af Total Quality Management. International Journal of Business andManagement.Vol. 8 No.November 24, 2013.
[10].Ministry of National Education, 2010.School Based Quality Management.Ministry of National Education Basic and Secondary Education Directorate of General Education.Ministry of National Education, 2010. Strategic Plan for the Ministry of National Education in 2010-2014.
[11].M. NgasbunEgarKisnadi, NgurahAyuNyoman 2012.The Effect of Principal Managerial Competence and School Culture on the Quality of Dabin 1 Elementary School Ki HajarDewantara in Pemalang Regency
[12].Priansa, DonniJuni. 2014.Human Resources Planning and Development. Bandung: Alfabeta
[13].R.S, Wenas, A.H.Kumajas, Lengkong, 2016.Influence of Organizational Culture, Discipline of EMBA Journal work. Vol.4 No.4September 2016, Pg. 1200 - 1208. [14].Surasni.2018.Effects of Managerial Skills,
Interpersonal Communication, and Quality Culture on Organizational Citizenship Behavior. Forkamma Management Scientific Journal.
[15].Situmorang, Benjamin. 2014.The Effect of Instructional Leadership Knowledge of Educational Management, Interpersonal Communication and Job Satisfaction on Organizations Commitment of the Senior High School Principals (A Case Study in Senior High Schools in Medan Municipality) International Jounal of Sciences: Basic and Applied Research (IJSBAR), 18 (01). pp. 234-253. ISSN 2307-4531
[16].Sugiyono 2013.Business Research Methods. Bandung: Alfabeta.
[17].TeguhRiyanta, 2016. Developing a School Quality Culture through Transformational Leadership, 2016 Journal of Education Management Vol.12. No. 2 [18].Y.Septiani: 2015.The Influence of Quality