DYNAMICS OF CHANGES IN MICROORGANISMS IN RHIZOSPHERE ZONE
OF LAWN GRASSES IN THE SECOND YEAR AFTER THE APPLICATION OF
SEWAGE SLUDGE
Elżbieta Wołejko1, Urszula Wydro1, Tadeusz Łoboda1, Jolanta Piekut2
1 Faculty of Civil and Environmental Engineering, Bialystok University of Technology, Wiejska St. 45D, 15-351
Białystok, Poland, e-mail: [email protected]
2 Department of Agrifood and Forestry Engineering, Bialystok University of Technology, Wiejska St. 45E, 15-351
Białystok, Poland
INTRODUCTION
Transportation and its risks cause that urban soil needs constant protection and reclamation treatments because of its progressive chemical degradation, which leads to permanent and pro-gressive deterioration of their properties [Greinert 2000a]. These soils are formed from construction waste, which results in their the compact struc-ture, low humus content and water content as well as a poor biological activity [Greinert 2000b].
In the view of the growing deficit of organic
matter in soils, it is necessary to look for other sources of organic matter and nutrients [Gondek and Filipek-Mazur 2005], which would be suitable
Volume 16, Issue 4, Oct. 2015, pages 126–132
DOI: 10.12911/22998993/59360 Research Article
ABSTRACT
The aim of the study was to present the dynamics of changes in the number of se-lected microorganisms in the rhizosphere zone of grasses two years after the applica-tion of sewage sludge. The study was conducted on four specially prepared research plots along the main roads in Bialystok. Three doses of sewage sludge were ap-plied: 0 (control), 7.5 and 15 kg/m2. Then the plots were seeded with two mixtures
of lawn grasses: Eko and Roadside. Samples of roots with soil were collected three times during the vegetation period of 2012 (April, July and October) and assayed for the total number of bacteria, the number of Gram-negative bacteria, the number of Pseudomonas fluorescens, the number of amylolytic and proteolytic bacteria. Mi-crobiological tests of the rhizosphere showed seasonal variations of all investigated microbiological parameters. The greatest average of the total number of bacteria, Gram-negative bacteria and proteolytic bacteria was observed on the plots in April, amylolytic bacteria in July while in the case of Pseudomonas fluorescens was ob-served on the plots in October. The time of measurement had the biggest impact on the number of microorganisms. An increased number of microorganisms was ob-served on all plots in April. Whereas, the fertilization with sewage sludge and grass mixtures did not affect the microbiological parameters.
Keywords: sewage sludge, grass mixtures, microorganisms, rhizosphere. Received: 2015.07.17
Accepted: 2015.08.31 Published: 2015.10.01
aspects is the use of sewage sludge in perennial crops on soils requiring remediation, where gradu-ally releasing nutrients ensure plant growth at a sat-isfactory level [Kalembasa and Malinowska 2010]. Sewage sludge has different properties, which de-pend on the quantity and quality of in a view of the
and quality of wastewater and the size of the load of pollutants flowing into the treatment plant. The quality of sludge is also influenced by the kind of
sewerage system, applied technological parame-ters, sludge age and the way, in which such deposits are processed, e.g. stabilization and hygienisation
[Bień et al 2011, Piekutin 2011].
Organic compounds and minerals including sewage sludge, introduced into the soil, have a
significant impact on the number of microorgan -isms and are transformed by means of enzymes [Sullivan et al 2005]. With regard to Polish
regula-tions [Directive of…2010.], sludge can be used in
agriculture and land reclamation for agricultural purposes, without bacteria from the genus Salmo -nella, and the number of viable eggs of intesti-nal parasites Ascaris sp., Trichuris sp., Toxocara sp. (ATT) in 1 kg organic dry matter is 0. In the
case of deposits for other purposes, ATT indicator
should not exceed 300 in 1 kg of dry sludge.
The rhizosphere zone is in the region of the most intense biological activity, characterized by
a rich bacterial flora and fungi, and it has a great influence on the root nutrients uptake [Jurkiewicz
et al. 2004]. Microbial activity plays a very im-portant role in the growth and development of the
plant. Plants form soil microflora and influence the microbial transformation constantly taking place in that environment [Wolińska 2010]. According to Głażewska-Maniewska et al. [2004], the microor -ganisms interact with plants from the germination of the seed until the plant reaches its full maturity, and it can be inert to the plants or to have a
ben-eficial or detrimental effect on their growth. Bien [2002] as well as Krzywy and Iżewska [2004] in
their studies also note that among the soil micro-organisms are both pathogenic ones, dangerous for humans and the saprophytic, indifferent from the sanitary point of view, but playing an important role in the degradation of pollutants.
The aim of the study was to present the dy-namics of changes in the number of selected mi-croorganisms in the rhizosphere zone of grass two years after the application of sewage sludge.
MATERIAL AND METHODS
The study was conducted at four experimen-tal plots located in the green belts along the main
roads in Bialystok (Hetmanska Str., Piastowska Str., Popieluszki Str. and Raginisa Str.), two years
after the application of sewage sludge. Each of
the test points with an area of 90 m2 was divided
into three blocks, which constitued further repeti -tions. Finally, the entire area surface was divided into 18 objects, each with an area of 5 m2 (2×2.5
m). The factors in the experiment were two doses
of sludge: 7.5 and 15 kg / m2 F.M. (approximately
14.5 and 29 t / ha of DM) and one without
(con-trol) as well as a mixture of two lawn grasses: Eko
from Nieznanice Plant Breeding Station, which contained 30% of Lolium perenne cv. Niga, 15% of Poa pratensis cv. Amason, 22.6% of Festuca rubra cv. Adio and 32.4% of Festuca rubra cv. Nimba, and grass mixture Roadside from Baren-brug, which contained 32% of Lolium perenne cv. Barmedia, 5% of Poa pratensis cv. Baron, 52% of Festuca rubrarubra cv. Barustic, 5% of Fes -tuca rubra commutata cv. Bardiva (BE) and 6% of Festuca rubracommutata cv. Bardiva (NL).
The rhizosphere soil samples for microbio-logical analyses were collected three times, in April, July and October 2012. The grass mixture
roots were taken with soil adhering to them from
each test plots. Then, a sample of 5 g of roots with the soil was suspended in 45 ml of sterile saline
solution (solution of 0.85% NaCl) and shaken for
10 min and then subjected to dispersion.
Subse-quently, another ten-fold dilutions (10-1–10-6) and
then soil samples were inoculated on the surface of Petri dishes in triplicate on:
• 10% TSA (Tryptic Soy Agar) medium for determining the total number of bacteria, the
bacteria were incubated at 28 °C for 72 h [Galimska-Stypa et al. 1999].
• 10% TSA (Tryptic Soy Agar) medium with crystal violet (solution of 0.1%) to deter-mine the number of Gram negative bacteria.
The bacteria were incubated at 28 °C for 72 h [Galimska-Stypa et al. 1999].
• King B medium with peptone for determin -ing the number of bacteria of the species
Pseudomonas fluorescent (the presence of magnesium sulphate in the medium promotes the formation of the characteristic pigmenta-tion by bacteria of the genus Pseudomonas),
the bacteria were incubated at 28 °C for 72 h [Galimska-Stypa et al. 1999]. The number of fluorescent bacteria Pseudomonas read in a
UV light transilluminator, where colonies ex
-hibiting fluorescence were counted.
• Frazier medium with gelatin for determining the number of proteolytic bacteria, which were
• Starch agar (solution of 20%) to detemine the number of amylolytic bacteria, which were
incubated at 27 °C for 96 h to 7 days [Rodina
1968].
The mean number of a colony was expressed
as cfu•g-1 of soil DM.
The statistics of the results was performed by using Statistica 10.0. The tree-way analysis of variance ANOVA analysis was performed to de-termine the relation between the experiment fac-tors and the number of microorganisms in the
rhi-zosphere zone. In the case of significant F-tests,
differences between group means were assessed
by the Tukey post hoc test at significance level at
p<0.05.
RESULTS AND
DISCUSSION
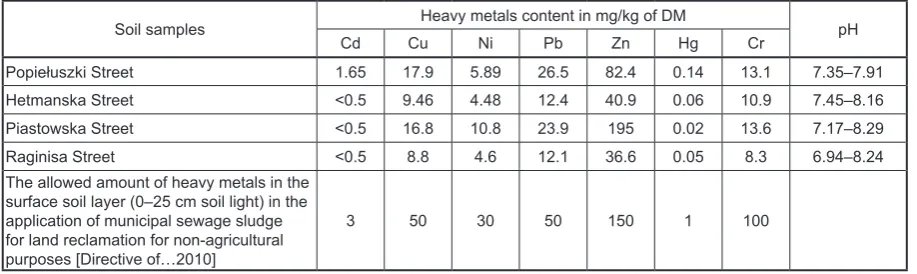
Before the establishment of the experiment both sewage sludge and soil from each combina-tion were analysed according to the Regulacombina-tion of the Ministry of Environment of July 13th, 2010 concerning municipal sewage sludge (Table 1). The obtained values of the studied parameters were compared with the values of the Regulation concerning non-agricultural land recultivation
[Directive of… 2010].
Sewage sludge used in experiment contained:
dry matter 19.3%, organic matter 584.0 g/kg DM, N – 40.0 g/kg DM, P – 27.0 g/kg DM, Mg – 7.0 g/kg DM, Pb – 2.5 mg/kg DM, Cd – <0,5 mg/kg DM, Cr – 58 mg/kg DM, Cu – 194 mg/kg DM, Ni – 22 mg/kg DM,, Zn – 1459 mg/kg DM and
its pH was 6.7.
Sewage for reclamation should be stabilized and follow the rules for sanitary and hygienic conditions [Baran 2005]. The addition of sewage sludge into the soil results in enhancement of soil microbial activity and intensive development of
the rhizosphere [Joniec and Furczak 2007]. The
results indicate that the applied sewage sludge fertilization affected the microbial activity in the rhizosphere zone of the used grass mixtures,
but the changes were not statistically significant (Table 2). Sampling time significantly affected
the total number of bacteria (at p<0.05). The larg-est total number of bacteria was found in April (107.53 1·107 cfu/g of soil DM), and in July and
October, the number of these microorganisms were similar (5.57 and 4.46 1·107 cfu/g of soil
DM respectively). At the beginning of the grow-ing season, in April, the average total number of bacteria in the rhizosphere was the highest when
the highest dose of sludge (15 kg/m2) was used
(176.1·107 cfu/g of soil DM) with a mixture of
Eco, and the lowest was observed from the plot without the use of sludge (2.7·107 cfu/g of soil
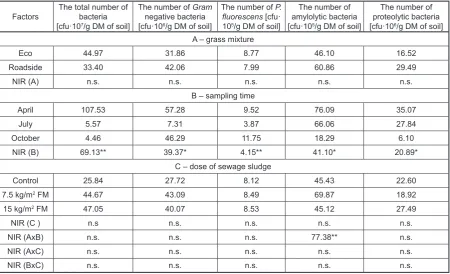
DM) with a mixture of Roadside. Generally, the increase in the total number of microorganisms followed increasing doses of sludge (Figure 1).
As has been shown in studies by Novák et al.
[2007], during the development of soil microor-ganisms soil nutrients are used, then the products of biochemical changes are collected, which may
influence changes in physico-chemical properties
of soils, thereby reducing the total number of bac-teria in the soil, which could be observed in the
present study. In addition, the number of microor -ganisms in the soil will depend on many factors, i.e. pH of the soil, air-water relationships, organic matter content, as well as the soil and air
tem-perature [Joniec and Furczak 2007]. According to Gondek [2012], the availability of nutrients from
sewage sludge is a function of prevailing climatic conditions during the growing season, the doses of used sludge and the value C: N ratio.
Based on the obtained results, one deter-mined a positive effect of doses of sewage sludge on the growth of Gram-negative bacteria in the
Table 1. Selected chemical indicators in the soil samples before the application of sludge
Soil samples Heavy metals content in mg/kg of DM pH
Cd Cu Ni Pb Zn Hg Cr
Popiełuszki Street 1.65 17.9 5.89 26.5 82.4 0.14 13.1 7.35–7.91
Hetmanska Street <0.5 9.46 4.48 12.4 40.9 0.06 10.9 7.45–8.16
Piastowska Street <0.5 16.8 10.8 23.9 195 0.02 13.6 7.17–8.29
Raginisa Street <0.5 8.8 4.6 12.1 36.6 0.05 8.3 6.94–8.24
The allowed amount of heavy metals in the surface soil layer (0–25 cm soil light) in the
application of municipal sewage sludge
rhizosphere zone, but this factor did not influ
-ence significantly the number of these bacteria (Table 2). In the course of various biochemical
processes microbes release metabolites into the
soil that modify the conditions and influence the
growth of microorganisms that inhabit the area [Durska 2010, Wong et al. 1998]. The average
highest number of Gram-negative bacteria in the samples was collected in April at the highest dose
of sludge 15.0 kg/m2 (10.5·106 cfu/g of soil DM)
with a mixture of Roadside, and the smallest
num-ber of bacteria was obtained for the samples taken
in July on the control plots (0.3·106 cfu/g DM of
soil) with a mixture of Eco (Figure 1). The factor
that significantly influenced the number of
Gram-negative bacteria was the time of sampling. There
were significant differences between the average number of these bacteria in samples taken in April
and July and October and July (Table 2).
Some of the most abundant groups of micro-organisms in nature include bacteria of the genus
Pseudomonas. These gram-negative bacilli are representatives of the so-called rhizobacteria, which are characterized by forming associations with the roots of plants. These bacteria degrade a variety of sugars, amino acids, alcohols. The representatives of this species can degrade high molecular compounds, e.g. humic acids or
pesti-cides [Krzywy and Iżewska 2004]. Figure 1 shows
the effect of the dose of sludge on the number of
Pseudomonas fluorescens depending upon the mixture of grasses. However, these factors did
not impact significantly of the number of these bacteria. It was found statistically significant dif -ferences in the average number of Pseudomonas fluorescens depending on time sampling (Table 2). On average, the biggest number of Pseudomo -nas fluoerscens was observed on the plots where
the soil was fertilized with a dose of 7.5 kg/m2
and a mixture of Eco and Roadside (12·105 cfu/g
DM of soil) and the lowest was collected in July on the control plots (respectively 7 and 6·105
cfu/g DM of soil). Mercado-Blanco et al.[2001] show that some bacteria of the genus Pseudo -monas produce diffuse, fluorescent compounds called siderophores that have a high affinity to
iron compounds. These species are used for bio-logical control of phytopathogens occurring in
the soil [Krzywy and Iżewska 2004]. In addition
to the protective function, they may enrich soil with nutrients, plant hormones and vitamins, and increase the bioavailability of these products for
plants [Wolińska 2010].
The average number of amylolytic bacteria
significantly influenced sampling time. Signifi -cant differences between the number of these bac-teria in samples collected in April and October, and in July and October were observed (Table 2). Table 2. Influence of experiment factors on the average number of selected microorganisms in the rhizosphere zone
Factors The total number of bacteria [cfu·107/g DM of soil]
The number of Gram negative bacteria [cfu·106/g DM of soil]
The number of P.
fluorescens [cfu·
105/g DM of soil]
The number of
amylolytic bacteria
[cfu·105/g DM of soil]
The number of
proteolytic bacteria
[cfu·106/g DM of soil]
A – grass mixture
Eco 44.97 31.86 8.77 46.10 16.52
Roadside 33.40 42.06 7.99 60.86 29.49
NIR (A) n.s. n.s. n.s. n.s. n.s.
B – sampling time
April 107.53 57.28 9.52 76.09 35.07
July 5.57 7.31 3.87 66.06 27.84
October 4.46 46.29 11.75 18.29 6.10
NIR (B) 69.13** 39.37* 4.15** 41.10* 20.89*
C – dose of sewage sludge
Control 25.84 27.72 8.12 45.43 22.60
7.5 kg/m2 FM 44.67 43.09 8.49 69.87 18.92
15 kg/m2 FM 47.05 40.07 8.53 45.12 27.49
NIR (C ) n.s n.s. n.s. n.s. n.s.
NIR (AxB) n.s. n.s. n.s. 77.38** n.s.
NIR (AxC) n.s. n.s. n.s. n.s. n.s.
NIR (BxC) n.s. n.s. n.s. n.s. n.s.
Figure 1. Influence of sewage sludge doses (0, 7.5 and 15 kg / m2) of the total number of bacteria [cfu·107 / g
DM of soil], the number of Gram negative bacteria [cfu·106 /g DM of soil], the number of P. fluorescens [cfu·105
In the second year of the experiment the number
of amylolytic bacteria ranged from 1.02·105 cfu/g
DM of soil (for the samples collected in October from the plots with a double dose of sediment and Roadside grass mixture) to 4.17·107 cfu/g DM of
soil (for the samples collected in July from the plots with a double dose of sediment and Road-side grass mixture). The average largest num-ber of proteolytic bacteria was obtained in July
for the samples taken from control plots with a
mixture of Roadside 2.15·108 cfu/g DM of soil,
and the smallest for the samples taken in Octo -ber from the plots with a double dose of sediment and Roadside grass mixture 5.21·105 cfu/g DM of
soil. The survey conducted by Joniec and Furczak
[2007] showed that the addition of sludge to soil
influence the growth of microorganisms as well as
the biochemical activity of the soil, in particular, in the second year after the application. However, it is not supported by our research, because in the
first year after the application of the sludge in the
soil microbial activity was more intensive than in the second year, which was shown by Wydro
et al. [2015]. There were significant differences
between the mean number of bacteria proteolytic October and April and July and October, as in the case of amylolytic bacteria (Table 2).
CONCLUSIONS
1. Microbiological tests of the rhizosphere in the second year after the application of sewage sludge from the Municipal Wastewater
Treat-ment Plants in Sokółka showed seasonal vari -ations of the total number of bacteria, Gram
negative bacteria, Pseudomonas fluorescens,
proteolytic bacteria and amylolytic bacteria. The used doses of sewage sludge as well as environmental factors may have resulted in changes in the number of the analyzed bacte-ria in the rhizosphere.
2. The largest number of Pseudomonas fluores -cens and Gram negative was observed in April and October, while the lowest number of bac-teria occurred in July, which could be due to the weather conditions.
3. The term of measurement had the biggest im-pact on the number of microorganisms. An increased number of microorganisms was ob-served in April on all plots. Whereas, the fertil-ization with sewage sludge and grass mixtures did not affect the microbiological parameters.
Acknowledgements
The research presented was supported finan
-cially by the project S/WBiIŚ/3/2015 and W/ WBiIŚ/14/2014.
REFERENCES
1. Baran S., 2005. Zasoby i gospodarka odpadami or
-ganicznymi w polsce. In: Kaniuczak J, Kostecka
J, Niemiec W. (Ed.). Wybrane aspekty zagospoda
-rowania odpadów organicznych a produkcja bio
-masy wierzby energetycznej. Rzeszów, Polskie Towarzystwo Inżynierii Ekologicznej, 1, 17-40.
2. Bień J., 2002. Osady ściekowe. teoria i praktyka. Wyd. Politechniki Częstochowskiej, Częstochowa
3. Bień J., Neczaj E., Worwąg M., Grosser A., Nowak
D. Milczarek M., Janik M., 2011. Kierunki zago
-spodarowania osadów w Polsce po roku 2013, Inżynieria i Ochrona Środowiska, 14(4), 375–384.
4. Durska G., 2010. Antagonistyczne interakcje
pomiędzy metylotrofami wyizolowanymi z gleby ryzosferowej i pozaryzosferowej jęczmienia oraz innymi mikroorganizmami glebowymi. Nauka
Przyroda Technologia, 4(6), 74.
5. Frąc M., Jezierska-Tys S. 2008. Zmiany aktywności mikrobiologicznej gleby brunatnej pod uprawą pszenicy ozimej w różnych latach oddziaływania osadu z oczyszczalni ścieków mleczarskich. An
-nales Universitatis Mariae Curie-Skłodowska, sec.
E, 13(1), 118–132.
6. Galimska-Stypa R., Małachowska-Jutsz A.,
Mro-zowska J., Zabłocka-Godlewska, E., 1999. Labo
-ratorium z mikrobiologii ogólnej i środowiskowej. Mrozowska J. (Ed.). Wydawnictwo Politechniki Śląskiej, Gliwice.
7. Głażewska-Maniewska R., Maciejewska A., Melech
A., 2004. Występowanie bakterii glebowych z rodza -ju Arthrobacter Spp. w uprawie żyta ozimego oraz ich enzymatyczne i antagonistyczne właściwości.
Acta Scientiarum Polonorum Seria Agricultura, 3(1), 129–137
8. Gondek K., 2012. Wpływ nawożenia nawozami
mineralnymi, obornikiem od trzody chlewnej i ko
-munalnymi osadami ściekowymi na plon i niektóre wskaźniki jakości ziarna pszenicy jarej (Triticum Aestivum L.). Acta Agrophysica, 19(2), 289–302.
9. Gondek K., Filipek-Mazur B., 2005. Agrochemiczna
ocena wartości nawozowej kompostów różnego po
-chodzenia. Acta Agrophysica, 5(2), 271–282.
10. Greinert A., 2000a. Ochrona i rekultywacja
terenów zurbanizowanych. Wyd. Politechniki Zielonogórskiej, Monografia, 97.
Wojewódzki Inspektorat Ochrony Środowiska, Zielona Góra, 107–117.
12. Joniec J., Furczak J., 2007. Liczebność wybranych grup drobnoustrojów w glebie bielicowej pod uprawą wierzby użyźnionej osadem ściekowym w drugim roku jego działania. Annales Univer
-sitatis Mariae Curie-Skłodowska, sec. E, 62 (1),
93–104.
13. Jurkiewicz A., Orłowska E., Anielska T., Godzik B., Turnau K., 2004. The influence of mycorrhiza and EDTA application on heavy metal uptake by differ -ent maize varieties. Acta Biologica Cracoviensia Se-ries Botanica, Ser. Bot. 46, 7–18,.
14. Kalembasa D., Malinowska E., 2010. Działanie osadu ściekowego na zawartość metali ciężkich w
biomasie trawy Miscanthus Sacchariflorus oraz w
glebie. Ochrona Środowiska i Zasobów Naturalnych,
42, 198–203.
15. Krzywy E., Iżewska A., 2004. Gospodarka ściekami i osadami ściekowymi. Wyd. Akademii Rolniczej w
Szczecinie. Szczecin
16. Mercado-Blanco J., Van Der Drift K.M., Olsson P.E., Thomas-Oates J.E., Van Loon L.C., Bak-Ker
P.A., 2001. Analysis of the pms ceab gene cluster involved in biosynthesis of salicylic acid and the siderophore pseudomonine in the biocontrol strain Pseudomonas Fluorescens WCS374. Journal of Bacteriology, 6, 1909–1920.
17. Novák J., Stankovièowá K.,Chlapík J., Labuda R.,
Jaworekowá S., 2007. Characteristic of eutrophic
soils in slovak national parks. Ekológia Trávneho Porastu VII – Medzinárodná Redecká
Konferen-cja, 72–77.
18. Piekutin J., 2011. Zanieczyszczenie wód produk
-tami naftowymi. Rocznik Ochrony Środowiska,
13, 2, 1905-1916.
19. Rodina A., 1968. Mikrobiologiczne metody bada
-nia wód. Państwowe Wydawnictwo Rolnicze i Leśne, Warszawa.
20. Rozporządzenie Ministra Środowiska z dnia 13 lipca 2010 r. w sprawie komunalnych osadów ściekowych (Dz.U. 2010 nr 137, poz. 924)
21. Sullivan T.S., Stromberger M.E., Paschke M.W., Ip
-polito J.A., 2005. Long-term impacts of infrequent
biosolids applications on chemical and microbial properties of semiarid rangeland soil. Biology and Fertility of Soils, 42(3), 258–266
22. Wolińska A., 2010, Aktywność dehydrogenazowa mikroorganizmów glebowych i dostępność tlenu w procesie reoksydacji wybranych mineralnych gleb polski. Acta Agrophysica. 180, Rozpr. Monogr. 3
23. Wong J.W.C., Lai K.M., Fang M., Ma K.K., 1998.
Effect of sewage sludge amendment on soil micro-bial activity and nutrient mineralization,
Environ-mental Internaltional, 24(8), 935–943
24. Wydro U., Wołejko E. Łoboda T., Matejczyk M.,
Butarewicz A., 2015. Influence of sewage sludge
![Figure 1. Influence of sewage sludge doses (0, 7.5 and 15 kg / m2) of the total number of bacteria [cfu·107 / g DM of soil], the number of Gram negative bacteria [cfu·106 /g DM of soil], the number of P](https://thumb-us.123doks.com/thumbv2/123dok_us/8369891.1674848/5.595.68.528.71.711/figure-influence-sewage-sludge-bacteria-negative-bacteria-number.webp)
