Enterprise Risk Management Implementation:
The Critical Success Factors For Vietnamese
Construction Companies
Tran Quang Phu
Economics and Transport Faculty, Ho Chi Minh City University of Transport Ho Chi Minh City, Vietnam
Email address: quangphu_ktxd@yahoo.com Huynh Thi Yen Thao
Email address: yenthao.ht@gmail.com
Abstract—Construction activities have been
faced significant complex and diverse risks, so it is necessary to develop and implement enterprise risk management (ERM) framework for construction organizations. To gain benefits from ERM, identifying the critical success factors of ERM plays an important role. This study aimed to identify critical success factors (CSFs) for implementing ERM in Vietnamese construction company (VCCs), and examine the contribution of CSFs to enterprise’ shareholder value. Using a survey, this research finds that commitment of board and senior management, ERM ownership, training programs, risk management culture, sufficient resources, risk identification, analysis and response and risk communication are define as the most important factors for the effective implementation of ERM in VCCs. Furthermore, by employing both explanatory factor analysis and multiple regression technique to examine the effect of CSFs on enterprises’ shareholder value, the finding reveals that execution and integration, communication and understanding, and leadership or involvement of senior management of ERM have a significantly positive influence on the shareholder value of VCCs.
Keywords—Critical success factors, Enterprise risk management, Shareholder value, Vietnamese construction companies
I. INTRODUCTION
The construction industry and construction companies are activities involved with architectural services, engineering services, integrated engineering services, urban planning, urban landscape architecture services and construction work [1]. It is widely acknowledged that construction company activities consist of significant complexity and diverse risks [2]. These characteristics increase the level of uncertainty regarding project outcomes, economic losses and liabilities of construction activities [3]. Therefore, it is necessary to develop and implement risk management systems for construction organizations to minimize negative consequences of risks and maximize positive results.
Most organizations manage risks at the project level, while implementing Enterprise Risk Management (ERM) is often ignored or does not receive sufficient consideration by company management [4]. This leads to a lack of transparency and strategies to achieve corporative objectives within an organization [5]. Focusing on managing risks of individual projects can lead to failure of other projects when there is disparity in risk management across different projects. Therefore, it is necessary to implement ERM in most construction companies to allow common risks be managed more efficiently and consistently across a company [4]. Furthermore, the authors of reference [2] assert that ERM is becoming the trend for risk management in the construction industry in most countries to limit problems caused by a focus on PRM in future decades.
In order to carry out ERM effectively and efficiently it is important for managers to identify critical success factors (CSFs). CSFs play an important role in determining success of an organization. Identifying appropriate CSFs can help organizations fulfill objectives, mission or strategies to maintain high performance for current operating activities and capture future opportunities [6]. Therefore, identifying appropriate CSFs for ERM can be seen as essential activity to which most organizations should pay more attention to ensure success in risk management and avoid failure caused by unexpected situations.
The main objective of this research is to present and discuss the key factors for ERM program implementation in VCCs by answering the question “What CSFs contribute to the success of ERM implementation in VCCs?”. Furthermore, this research also assesses whether there are the close relationship between CSFs and enterprise’s shareholder value.
programs developing country contexts causes delay and cost overrun, economic losses and liabilities in construction industries including Vietnamese construction activities [9, 10]. Thirdly, several previous papers examined the critical factors for ERM implementation with a focus on identifying the CSFs for ERM but do not address whether CSFs actually determine success of implementing ERM [2]. Therefore, this project will fill the knowledge gap by extending preceding research and examining direct relationship between CSFs and company shareholder value.
II. LITERATURE REVIEW
There are various definitions of risk. According to the Business dictionary, risks could be seen as “danger of damage or loss”. Risk defines as an event where the outcome is uncertain [11]. A broader definition is that risk is not only uncertainty but also losses, damages or consequences caused by this uncertainty [12]. On other words, risks can be illustrated by the equation: risk = uncertainty + damage. In general, risk related to the construction industry can be categorized into six categories including technical, logistical, management, environmental, financial and social-political risks [13]. Due to a large amount of potential risks in the construction industry, construction companies should engage with risk management which is defined as a group process referring to the principles, framework and process of managing risk effectively [14]. The general purpose of risk management is to reduce the volatility of firm value and eliminate lower-tail outcomes [15].
There are two basic approaches to risk management: Traditional Risk Management (TRM) also known as project risk management and Enterprise Risk Management (ERM). According to [16], the TRM approach began in the early 1950s and was limited in scope to minimization of loss exposure. By following TRM, organizations often manage risks individually. In other words, traditional risk management is segmented and carried out in individual business units, department or group within an organization. The recent strategy of most organizations is moving from traditional risk management approach to an integrated approach, known as enterprise risk management (ERM). EMR is defined as [17]:
“a process, effected by an entity’s board of directors, management and other personnel, applied in strategy setting and across the enterprise, designed Enterprise risk management and bank performance to identify potential events that may affect the entity, and manage risk to be within its risk appetite, to provide reasonable assurance regarding the achievement of entity objectives”. In general, ERM offers a solution to the problems of traditional risk management. This approach deals with risks in a coordinated way where risks are considered together in a portfolio where residual risk is hedged. Additionally, by considering all
potential risks in a portfolio, it is possible to understand interdependencies among risks, which leads to better comprehension of risks.
Even though the traditional risk management approach and ERM share similar risk management process to deal with risks or minimize losses caused by risks [17]. Additionally, there is no consensus or contradiction between traditional risk management and ERM [18]. However, TRM and ERM have different objectives and goals as each focuses on different levels of risk. ERM deals with risks at all levels within an organization, focusing on strategic, operations, reporting and compliance objectives of a firm [18]. In contrast, TRM deals with risks at the project level and pays more attention to specific project objectives such as schedule, budget, material resources, quality and safety requirements. The authors of reference [19] assert that traditional risk management approach manages each risk in a separate ‘silo’ or class can create inefficiencies because of a lack of coordination between various risk management departments. In addition, TRM does not allow senior managers and boards of directors have an overall view of risks that their organizations face at specific time [2]. Moreover, traditional risk managers may fail to consider shareholder value and responsibilities to investors in risk management decisions. Therefore, TRM should be viewed as an integral part of ERM and implemented at the project unit level because project risks are also included in the entire risk profile of a construction company. ERM provides a new approach to improve the effectiveness and efficiencies of TRM in construction companies because ERM implementation involves improved communication of project risk information [20]. This helps high level management make better final decisions and address project risks more effectively and efficiently.
In order to gain significant benefits by efficiently implementing the ERM framework, it is important to identify critical factors (CSFs) for ERM and interrelationships among them. CSFs are defined by [21] as “the limited number of areas in which results, if they are satisfactory, will ensure successful competitive performance for the organization. They are the few key areas where things must go right for the business to flourish. If results in these areas are not adequate, the organization’s efforts for the periods will be less than desired”. [22] emphasizes that
identifying appropriate CSFs can help organizations fulfill their objectives, mission or strategies to maintain high performance across operational activities of organization, as well as capture opportunities in the future.
virtual roles of risk management and assessed processes designed to implement risk management successfully and effectively. In terms of implementing ERM in the energy industry, the top five driving forces for ERM adoption were explored [7], and identified as: (1) corporate governance, (2) leadership of chief executive, (3) good business practice, (4) initiative of board of directors and (5) internal audit recommendation. The CSFs for ERM implementation
were also analyzed and highlighted with total of 16 CSFs identified [2].
Based on literature reviewed, 16 CSFs, as indicated in Table 1 below, are considered as key activities that determine ERM success in VCCs and used for analysis in this research.
TABLE 1. THE CSFs USED IN THIS PAPER
Code CSFs for ERM as used in this study Previous studies
CSF01 Commitment and support of the board and senior management [25], [23], [26], [2]
CSF02 ERM ownership [27], [7], [2]
CSF03 Risk appetite and tolerance [26]
CSF04 Risk-aware culture [28], [23], [26]
CSF05 Sufficient resources [25]
CSF06 Risk identification, analysis and response [28], [26]
CSF07 Integrative and dynamic ERM process steps [27], [2]
CSF08 Leveraging risks as opportunities [7], [2]
CSF09 Risk management information system (RMIS) [28], [2]
CSF10 A common risk language [23], [2]
CSF11 Risk communication [23]
CSF12 Training programs [28], [26]
CSF13 Formalized key risk indicators (KRIs) [7], [2]
CSF14 Integration of ERM into business processes [28], [23]
CSF15 Objective setting [27], [2]
CSF16 Monitoring, reviewing and improvement of ERM framework [26] [27]
These 16 CSFs were explored through a
comprehensive literature review and are described in the following paragraphs.
CSF 01: Commitment of the board and senior management. Commitment of the board and senior management are considered as key success factor for implementing ERM in an organization [29]. Clear and accurate commitment from senior management can make employees perceive the value of ERM practice as a priority for leadership, aligning risk strategy with objectives and goals of an organization and incorporating a holistic risk management approach in the planning and strategy stages [29]. Additionally, ERM is an on-going process, thus commitment of senior management should not be interrupted by any changes in the ERM champion [18].
CSF 02: ERM ownership. The person has
responsibility for implementing ERM across all business units and departments, which is seen as an important signal for conveying the firm’s emphasis on risk management to stakeholders, including employees and investors [18, 25]. It is necessary to have a Chief Risk Officer (CRO) who plays a role of centralizing risk management and taking charge of risk oversight within an organization [30, 31].
CSF 03: Risk appetite and tolerance. Risk appetite is defined as “the amount of risk, on a broad level, an organization is willing to accept in pursuit of value. Each organization pursues various objectives to add value and should broadly understand the risk it is willing to undertake in doing so” [31]. Meanwhile, risk
variation relative to achievement of a specific objective, and often is best measured in the same units as those used to measure the related objective. The combination of objectives, risk appetite and risk tolerances can drive an organization’s actions [17]. CSF 04: Risk-aware culture. Risk-aware culture is the most crucial factor contributing to ERM implementation success in a company [18]. Risk-aware can be defined as a set of values, beliefs and knowledge shared by a corporate group with common goals and corporate mission [17, 18]. Reference [30] mentions that risk management culture requires the buy-in of individuals at all organizational levels and embedment into corporate culture. Furthermore, it is highlighted that risk awareness must be integrated into decision making processes including strategic decision-making processes [32].
CSF 05: Sufficient resources. Resources embody financial resources, human resources, such as qualified staff, knowledge and expertise, and time, materials or tools and techniques necessary to ensure success of ERM in construction companies. Reference [33] proposes that internal resources should be allocated consistently and efficiently to improve the risk management process.
CSF 06: Risk identification, analysis and responses. Identifying categories of potential risks from both internal and external sources determines the level of success in implementing ERM. Additionally, analyzing identified risks using quantitative and qualitative methods helps senior management recognize key risks that may cause economic loss or be seen as opportunities to business [6].
CSF 07: Iterative and dynamic ERM steps. ERM processes involve identifying, assessing, and monitoring emergent risk due to environment changes, so organizations are able to deal with risk proactively and efficiently [34].
CSF 08: Leveraging risk as opportunities. Reference [29] states that emphasizing potential opportunities is a key success factor for ERM programs. Therefore, rather than focusing on coping with negative impacts of risks, ERM also exploits the potential benefits of risks for competitive advantage and improvement of organizational performance [35-38].
CSF 09: Risk management information system (RMIS). Information and communication technology (ICT) plays an important role in guaranteeing the flow of information through an enterprise smoothly and reliably [36]. A RMIS is used as a platform or tools and techniques for risk communication and reporting. CSF 10: A common risk language. Common risk language is a common understanding of meaning and context of risk terminologies and methodologies in ERM processes across an organization. Having a common risk language is seen as a key indicator of the quality of an effective ERM program [39, 40].
CSF 11: Risk communication. Relevant and reliable information in terms of risk profile obtained from different sources must be shared and communicated transparently across all levels within an organization. Transparency of risk information can encourage staff to give comments and experts to provide their view or feedback during development of risk management strategies because people from various departments and levels have a deep understanding of risk [23, 40]. CSF12: Training program. Training is a crucial activity to ensure success in implementing ERM, as by involving staff, acceptance and adoption of ERM can be improved [40]. Training programs provided to staff at all levels can reduce misunderstanding and anxiety about ERM adoption and implementation.
CSF13: Formalized key risk indicators (KRIs). A KRI is a “measure to indicate the potential, presence, level or trend of risk” [41], and can be further defined as
“metrics used to provide early signal of increasing risk exposure in various areas of the organization” [42]. Identifying the threshold of each KRI helps senior management quickly adjust an organization’s strategies proactively to manage and treat risk effectively [42].
CSF14: Integration of ERM into business processes. Integration of ERM into business processes is a factor that determines level of success implementing ERM [17]. ERM should be integrated into all activities of management and business processes including decision making and strategic planning. Integration of ERM means that identified risks and emergent risks should be included in the risk profile which is considered in all decision-making processes.
CSF15: Objective setting. Objective setting is one of eight main components of ERM, as discussed by [17] in relation to the ERM framework. It is considered as a precondition in order to identify potential risk, assess risk or produce risk treatment plans. Therefore, organizational or corporate objectives must be identified clearly and have specific performance measurements by senior management.
III. RESEARCH METHODOLOGY AND DATA PRESENTATION
To identify the CSFs and test the hypothesis of whether CSFs affect on firm’s shareholder value, we intend to use both qualitative and quantitative methods. The analytical framework for this study is illustrated in figure 1.
As shown in the figure 1, the paper firstly use the qualitative method based on surveying a considerable number of the empirical studies in the literature to identify CSFs for ERM. The questionnaire then is designed to collect the primary data from VCCs and academy and in various positions. In the questionnaire, the responses are asked to rate the importance of each CSFs using the five-point scale (1 = none importance, 2 = minor importance, 3 = medium importance, 4 = moderate importance, and 5 = most importance). The collected data then is used to rank the relative importance of CSFs for ERM based on their mean score.
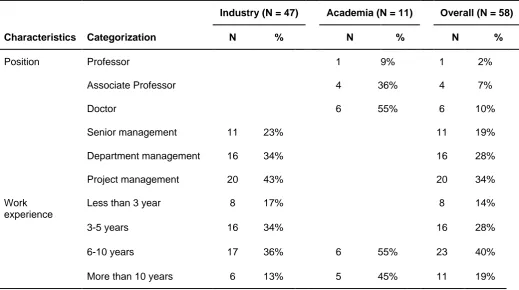
Table 2 describes the main profile of responses in our data. We first remark that to provide the reliability for the analysis, our sample is collected from multiple organizations, departments, and academics with in-depth knowledge and experience in risk management. More specifically, the responses of the industries are involved: (1) Project Management (43%), Department Management (28%), and Senior Management (19%). Related to the academics, the most of responses is from Doctor (55%) and Associate Professor (36%). In terms of the participant experience, the rate of responses, which has more than 6 years of the work experience in risk management, is approximately 59%.
Fig. 1.Research method
TABLE 2.PATICIPANT DEMOGRAPHICS
Industry (N = 47) Academia (N = 11) Overall (N = 58)
Characteristics Categorization N % N % N %
Position Professor 1 9% 1 2%
Associate Professor 4 36% 4 7%
Doctor 6 55% 6 10%
Senior management 11 23% 11 19%
Department management 16 34% 16 28%
Project management 20 43% 20 34%
Work experience
Less than 3 year 8 17% 8 14%
3-5 years 16 34% 16 28%
6-10 years 17 36% 6 55% 23 40%
More than 10 years 6 13% 5 45% 11 19%
Recommendation for success of ERM practice Literature
Reviews
Survey
Quantitative analysis
Identifying the CSFs for ERM
Survey questionnaire
Importance of the CSFs for ERM
Ranking relative importance of
CSFs
Identifying the function between CSFs &
The second aim of this paper is to examine whether CSFs contribute to obtain the objective of the organization. In other words, we intend to consider whether CSFs has the significant effect on firm’s shareholder value. To obtain this purpose, the multiple regression technique is employed. The regression is a statistical technique investigating the causality relationships between two or more variables of interest. This approach is used overwhelmingly in the literature. For example, the regression technique employed to investigate the effect of leadership factors (capability, accountability, commitment and support) of ERM framework and CSFs on enterprise’s shareholder value [43, 44].
Our empirical model is therefore formed as below:
0 1 1 2 2 ... 16 16
i i i i i i
shareholder CSF CSF CSF u (1) Where:
Shareholderi is the dependent variable measured by the shareholder value of firm i. The CSF1i,..., CSF16i are independent variables measured by the CSFs identified by firm i. The
u
i is the disturbance or error term. The
0,..,
16 are the parameters that need to be estimated.From the equation 1, the marginal effect of CSFi on the firm’s shareholder value is computed as:
i i
sharehoder CSF
(2)
As shown in the literature, the survey of a large number of the empirical studies has identified 16 CSFs for ERM. However, some CSFs may be interconnected together or simultaneously affect on the success of implementing ERM. Therefore, to provide the better picture of how CSFs contribute to the success of ERM, and thus influence on firm’s shareholder value, we propose to use Explanatory Factor Analysis (EFA) technique, which allow us to discover the hidden relationship among CSFs. The EFA is a multivariate statistical method used frequently to explore the underlying structure of a large number of variables. The main goal of the EFA technique is to identify the underlying relationships between measured variables. The EFA, therefore, enables not only the deep insight into of the data, but also validates of using the output in subsequent analyses [45]. The usage of the EFA in this paper can bring many benefits. Firstly, it allows us to uncover the hidden relationship of CSFs in ensuring the effectiveness of ERM framework. Secondly, it is able to avoid the multicollinearity among independent variables (CSFs) in the regression technique to obtain the pure marginal effect of each CSF on firm’s shareholder value. Based on the advanced statistical technique of exploratory factor analysis (EFA), 16 CSFs are rotated and classified into three groups. The first includes CSF4, CSF8, CSF9, CSF10, CSF11, CSF12 and is named as execution and integration (F1). The second is covered by CSF5, CSF5, CSF7,
CSF13, CSF14, CSF16 and is named as
communication and understanding (F2). The final group is represented by CSF1, CSF2, CSF3, CSF15 and is called leadership or involvement of senior management (F3). The more detail of the EFA method and its results used in the paper are presented in Appendix.
Based on the result of the EFA, the equation 1 describing the relationship between CSFs and firm’s shareholder value is rewritten as:
0 1 1 2 2 3 3
i i i i i i
shareholder F F F u (3) Where F1, F2, F3 are the mean score of three groups created by the EFA method.
The pure marginal effect of Fi on firm’s shareholder value is obtained as:
i i
sharehoder
F
(4)
IV. FINDING AND DISCUSSION
A. The ranking of the relative importance of CSFs for ERM
Before presenting the main result of the paper, the collected data is tested the reliability based on Cronbach’s alpha coefficient. The Cronbach’s alpha coefficient of our data are 0.808, which implies that our data is valid for the further inference and hypothesis testing [46]. Turning to the empirical result, the ranking of the relative importance of CSFs is depicted in Table 3. It is first remarkable that the mean score of CSFs ranges from 3.42 to 4.67, which is quite wide; this is that the relative importance of CSFs contributing to the success of ERM is somewhat distinctive. Secondly, the independent sample t-tests are imposed to test of whether the ranking of each CSF are different between academy and industry, and its result shows that the ranking of the importance of CSFs is high consistent in both academy and industry (P-value > 0.05). This therefore suggests that our ranking of the importance of CSFs for ERM is high reliable.
implementation. This finding is consistent with a number of previous studies in developed countries and developing countries [2, 27, 47]. The success level of ERM program implementation is highly dependent on the efficiency and effectiveness of management to set business strategies, vision, mission and objectives, as well as determining potential risks, establishing the risk management culture and internal policies, and monitoring
performance [44]. Furthermore, according to [48], ERM program implementation will not succeed without support, commitment, knowledge and capacities of the leadership which includes the governance level consisting of the board of directors (BOD) and the executive leadership or senior management level, the chief executive officer (CEO) and other C-suite officers. This was agreed upon by [28, 38, 40].
TABLE 3. THE RESULTS OF THE CSFs FOR ERM IN VCCs
Code CSFs
Academy Industry Overall
Mean Rank Mean Rank Mean Rank p-value
CSF1 Commitment and support
of senior management 4.36 1 4.47 1 4.45 1 0.673
CSF2 ERM ownership 4.18 4 4.43 2 4.38 2 0.45
CSF12 Training programs 4.27 3 4.34 3 4.33 3 0.771
CSF4 Risk-aware culture 4.36 1 4.23 4 4.26 4 0.626
CSF5 Sufficient resources 4.00 7 4.21 5 4.17 5 0.219
CSF6 Risk identification,
analysis and response 4.09 5 4.09 7 4.09 6 0.977
CSF11 Risk communication 3.82 10 4.11 6 4.05 7 0.23
CSF14 Integration of ERM into
business processes 4.09 5 3.96 9 3.98 8 0.567
CSF15 Objective setting 3.64 13 3.98 8 3.91 9 0.206
CSF16
Monitoring, reviewing and improvement of ERM framework
3.82 10 3.89 10 3.88 10 0.719
CSF10 A common risk language 4.00 7 3.81 12 3.84 11 0.416
CSF7 Integrative and dynamic
ERM process steps 3.55 15 3.85 11 3.79 12 0.175
CSF3 Risk appetite and
tolerance 3.64 13 3.79 13 3.76 13 0.436
CSF8 Leveraging risks as
opportunities 3.82 10 3.70 14 3.72 14 0.635
CSF9
Risk management information system (RMIS)
3.91 9 3.60 15 3.66 15 0.16
CSF13 Formalized key risk
indicators (KRIs) 3.55 15 3.51 16 3.52 16 0.88
ERM ownership was ranked in the second position with an importance mean score of 4.38. Furthermore, p-value was 0.45 which means that both academics
to take charge of risk oversight within a Vietnamese construction organization. In the case of most VCCs, chief executive officers and chief financial officers are often assigned to become the ERM owner who has responsibilities for implementing and controlling ERM throughout an organization or department. Particularly, they are accountable to the firm’s governing body for oversight of ERM and have sufficient authority, stature and resources for the effective execution of their responsibilities and are able to access to any parts of the business capable of having an impact on the firm’s risk profile. Results from the literature review drew similar findings as some studies point out that identifying an ERM owner is one important signal of corporate emphasis on risk management to all stakeholders of an organization [21, 27, 35, 49].
Training programsoccupied the third position. The importance mean score was 4.33 and the p-value was 0.771, pointing out both academics and practitioners agree that this CSF is a crucial activity to ensure success in implementing ERM in VCCs. Training programs help all people within an organization accept ERM adoption and become aware of the importance of ERM implementation [40]. Particularly, these programs are conducted regularly to provide risk management knowledge, skills and attitude that help employees become familiar with risk management concepts, use appropriate tools and techniques during risk management processes, and build a risk management culture in VCCs. Additionally, a large number of training course hosts come from outside the organization, such as risk management consultants from different countries are invited to share risk management knowledge to all people within an organization.
A sufficient resource was ranked fifth, which was 4.17 of the important mean score and 0.219 of p-value. Resources embody financial resources, human resources, such as qualified staff, knowledge, expertise, and time, materials or tools and techniques for ERM implementation. All of these resources are necessary to ensure success of ERM in VCCs from the professional and practitioner view. VCCs have paid significant consideration to develop qualified human resources with in-depth knowledge and understanding about risk management theory, as well as tools and techniques used for the ERM program. Additionally, allocating and distributing appropriate resources for risk response are seen as crucial element contributing to effective ERM implementation. This finding is consistent with the literature from developed countries and developing countries [2, 27]. Objective setting did not receive significant consideration from VCCs management with 3.91 of the importance mean score. The finding suggests that the vast majority of VCCs’ objectives generated consistent with the organizations’ risk appetite. They have established risk tolerances that are measurable to assess acceptable levels of variation relative to the achievement of objectives. However, some VCCs
have not set organizational objectives with consideration of risk appetite and risk tolerance within their organization. Findings of this study differ from previous research [27, 50] which recommend that clear identified objectives at all levels are significant important to ERM success. Therefore, it is suggested that VCCs should establish clear objectives and express identified objectives to their staff at all levels. Additionally, assessing deviations from plans against the objectives should be carried out regularly.
Monitoring, reviewing and improvement of ERM was considered as the less important factor contributing to ERM success, which was 3.88 of the mean score and 0.719 of p-value. However, it is worth discussing as there are some contradictory results mentioned in the literature. VCCs did not conduct monitoring, reviewing and improvement of ERM every day as nearly half of investigated VCCs do not have an organization wide risk dashboard to which they refer for daily monitoring of operations and activities. Additionally, evaluating and reflecting on ERM status are often conducted in formal meetings between the risk management department and the board rather than occurring as daily activities. Meanwhile, reference [17, 48, 51] report that monitoring and reviewing an ERM framework continuously are necessary to ensure an ERM program’s success. Therefore, VCCs should be aware of the vital roles of monitoring, reviewing and improving ERM. In particular, VCCs need to have an established specific risk management plan with identified key risk indicators, which are used to reflect and assess actual results of risk management within an organization. It is also suggested that VCCs should employ several tools and techniques that support monitoring, reviewing and improving ERM in their firms [52].
B. The role of CSFs in the explanation of firm’s shareholder value
TABLE 4. REGRESSION MODEL ON CSFs FOR IMPLEMENTING ERM AND SHAREHOLDER VALUE
Dependent Variables: Shareholder
Variables Coefficients
Constant -27.31**
F1 4.45**
F2 3.63**
F3 2.94*
R2 0.39
F-statistics 6.67***
Observations 35
Note: ***, **, and * represent statistically significance at the 1%, 5%, and 10% levels, respectively
It is worthy to note that our estimation is valid with R2=0.39. In other words, CSFs explain approximately 39% of the change in firm’s shareholder value. Additionally, the F-statatistics, testing the null hypothesis that CSFs do not simultaneously affect to firm’ shareholder value, is rejected at 1% level. These results, therefore, imply that our model is valid for further inference and hypothesis testing of interest.
The result of Table 6 shows that VCCs implementing ERM with consideration of 16 identified CSFs will increase shareholder value or return of equity holding. Improvement of ERM understanding and communication, execution and integration and the involvement of senior management in ERM significantly positively influence shareholder value. Particularly, ERM understanding and communication (F1) in implementing ERM has a positive effect on firm’s shareholder value, and report highly statistically significant at 5% level. More specifically, the one standard error improvement of ERM understanding and communication can increase organization’s shareholder value by 4.45%. According to reference [5], communication across construction organizations will provide accurate and reliable information related to potential risk, which help the authority execute ERM process effectively. Additionally, risk – aware culture closely related to ERM understanding and communication because it allows employees to speak up and then be listened to by senior managers and it also enables decision makers to understand the important role of risk identification, risk assessment across all business activities and the significant contribution of risk communication [53]. Furthermore, ERM understanding will be able to reduce the resistance to ERM practices resulting from misunderstanding [5]. Therefore, ERM understanding and communication will help ERM processes execute
effectively, contributing significantly to minimize losses caused by potential risks. This finding also consistent with the literature as several authors emphasize ERM understanding and communication can help an organization achieve objectives and create more value for shareholders. For example, organizational risk management culture, communication and reporting within an organization, risk management awareness, understanding risk management, and more involvement of staff in decision making process contribute positively to shareholder value [54]. Additionally, these authors also report that basic knowledge of staff in risk management, iterative and dynamic risk management processes, procedures, risk management policies and infrastructure or risk management facilities including tools and techniques are critical factors that increase shareholder value.
Similarly, the execution and integration (F2) allows enhancing the firm’s shareholder value at 3.63%, and this indicates statistically significant at 5% level. One possible explanation of this result is that if monitoring, review and improvement of ERM are conducted continuously during implementation of an ERM program, authorized people can measure progress against the risk management plan, risk appetite and risks tolerances to keep business activities on track as all risks are managed. Additionally, ERM execution also includes integration of ERM into business process which ensures that ERM program is integrated fully to all activities and management processes of the company, even though it is time consuming. Furthermore, the execution and integration also involve identification of formalized key risk indicators which is seen as a threshold that helps control and monitor risks while carrying out business activities. Formalized key risk indicators are also key driver that will trigger actions by management to adjust strategies effectively and actively to manage actual risks when they occur. Therefore, all activities related to ERM execution and integration (F2) can increase the VCCs shareholder value. This finding is similar with other previous studies. In particular, [5] believe that adopting a formalized ERM process can help organizations identify potential risk from internal and external sources, analyze them before being prioritized. This ensures that appropriate solutions are generated to deal with risk effectively to guarantee shareholder value. Furthermore, the integration of ERM into business processes improve decision making process and strategic planning within an organization to minimize losses and maximize gains [29].
risk-based approach in the planning and strategy stages. Additionally, the leadership also involves risk appetite and tolerance. Operating within risk tolerance provides management with greater assurance that the company is within the risk appetite, which produces a higher degree of comfort that organizational objectives will be achieved. This finding is also consensus with some previous research. For example, the crucial role of leadership factors including commitment and
support from senior management in ERM
implementation to shareholder value [44]. By using regression analysis, these authors illustrated that 28.9% of total shareholder value variation of Public Listed Companies (PLCs) was explained by leadership support and interaction of leadership commitment for ERM implementation.
Based on the findings of this study and previous literature, there is a strong relationship between an organizations’ shareholder value and CSFs of the ERM program. Therefore, VCCs should pay more attention to ERM by implementing the CSFs discussed above to improve shareholder value.
V. CONCLUSION AND RECOMMENDATION This paper investigates the importance of CSFs in implementing the effectiveness of ERM and examines the effect of identified CSFs on the shareholder value of VCCs. The empirical result shows that the commitment of board and senior management; the ERM ownership; the training programs; the risk management culture are the most important factors for ERM. However, the monitoring, reviewing and the improvement of ERM, the objective settings are found less important for ERM. This finding is somewhat different form previous results. Furthermore, using the data of 35 VCCs coupled with the regression technique, the paper finds that identified CSFs has a strong positive effect on organization’s shareholder value. Based on the empirical results, to ensure the success of implementing ERM, VCCs should pay significant consideration to three areas of ERM implementation including ERM understanding and communication, execution and integration, and leadership which contribute positively to shareholder value. Importantly, VCCs senior management should integrate ERM into all business activities and decision making processes, setting clear objectives. Additionally, building up risk management culture is worth to ensure success of ERM implementation.
REFERENCES
[1] Y. Ling, Pham, C, Hoang, P, "Strengths, weaknesses, opportunities, and threats for architectural, engineering, and construction firms: case study of Vietnam," Journal of Construction Engineering and Management, vol. 135, pp. 1105-1113, 2009.
[2] X. Zhao, B. G. Hwang, and S. P. Low, "Critical success factors for enterprise risk management in Chinese construction companies," Construction
Management and Economics, vol. 31, pp. 1199-1214, 2013.
[3] M. Loosemore, J. Raftery, and C. Reilly, Risk management in projects. US: Taylor & Francis, 2006.
[4] M. R. Hallowell, K. R. Molenaar, and B. R. Fortunato, "
Enterprise risk management strategies for state departments of transportation," Journal of Management in Engineering, vol. 29, pp. 114-21, 2003.
[5] X. Zhao, B. G. Hwang, and S. P. Low, " Implementing enterprise risk management in a Chinese construction firm based in Singapore, in Senaratne, S. and Sandanayake," presented at the Proceedings of World Construction Conference, Colombo, Sri Lanka, 2012.
[6] J. Fraser and B. J. Simkins, "How to prepare a risk profile," Enterprise Risk Management, pp. 171-188, 2010.
[7] K. Muralidhar, "Enterprise risk management in the Middle East oil industry: an empirical investigation across GCC countries," International Journal of Energy Sector Management, vol. 4, pp. 59-86, 2010.
[8] D. Wu and D. L. Olson, "Enterprise risk management: financial and accounting perspectives," in New Frontiers in Enterprise Risk Management. vol. 25–38, D. L. Olson and D. Wu, Eds., ed Heidelberg: Springer, 2008.
[9] N. D. Long, S. Ogunlana, T. Quang, and K. C. Lam, "Large construction projects in developing countries: a case study from Vietnam," International Journal of project management, vol. 22, pp. 553-561, 2004.
[10] V. T. Nguyen, S. Ogunlana, and P. K. Dey, "Risk management in oil and gas construction projects in Vietnam," International Journal of Energy Sector Management, vol. 1, pp. 175-194, 2007.
[11] E. A. Rosa, "Metatheoretical foundations for post-normal risk," Journal of Risk Research, vol. 1, pp. 15–44, 1988.
[12] S. Kaplan and B. Garrick, "On the quantitative definition of risk," Risk analysis, vol. 1, pp. 11-27, 1981.
[13] N. Ahsan, E. Mirza, M. Alam, and A. Ishaque. (2010, 10th Feb). Risk Management in construction
industry Available:
http://www.meeting.edu.cn/meeting/UploadPapers/12 82726331593.pdf
[14] R. Adrian, Malcolm, R & Julia, H, Triple Bottom Line Risk Management. Canada: John Wiley & Sons, Inc, 2001.
https://www.jkr.gov.my/prokom/images/stories/pdf/RM /kpmg.pdf
[16] N. A. Manab, I. Kassim, and M. R. Hussin, "Enterprise-Wide Risk Management (EWRM)
Practices: Between Corporate Governance
Compliance and Value Creation," International Review of Business Research Papers, vol. 6, pp. 239-252, 2010.
[17] COSO, "Enterprise Risk Management – Integrated Framework Application Techniques," vol. 2015, p. 2, 2014.
[18] H. Cendrowski and W. C. Mair, Enterprise Risk Management and COSO: A Guide for Directors, Executives, and Practitioners. Hoboken, NJ: John Wiley & Sons, 2009.
[19] R. E. Hoyt and A. P. Liebenberg, "The value of enterprise risk management," Journal of Risk and Insurance, vol. 78, pp. 795–822, 2011.
[20] J. Y. Liu, P. X. W. Zou, and W. Gong, " Managing project risk at enterprise level: exploratory case studies in China," Journal of Construction Engineering and Management, vol. 139, pp. 1268–74,
2013.
[21] J. F. Rockart, "Chief executives define their own data needs," Harvard Business Review, vol. 57, pp. 81-93, 1979.
[22] Y. P. Freund, "Planner’s guide Critical Success Factors," Planning Review, vol. 16, pp. 20-23, 1988.
[23] M. Grabowski and K. H. Roberts, "Risk mitigation in virtual organizations," Journal of Computer‐Mediated Communication, vol. 3, 1998.
[24] D. Galorath, "Risk management success factors," PM World Today, vol. 8, 2006.
[25] T. Aabo, J. S. Fraser, and B. J. Simkins, "The rise and evolution of the chief risk officer: enterprise risk management at Hydro One," Journal of Applied Corporate Finance, vol. 17, pp. 62-75, 2005.
[26] H. Cendrowski and W. C. Mair, Enterprise Risk Management
and COSO: A Guide for Directors, Executives, and Practitioners Hoboken, NJ: John Wiley & Sons, 2009.
[27] A. B. Yirenkyi-Fianko, N. Chileshe, and P. Stephenson, "Critical success factors of risk assessment and management processes (RAMP) implementation in Ghanaian construction related organisations," International Journal of Project Organisation and Management, vol. 4, pp. 379-396, 2012.
[28] T. L. Barton, W. G. Shenkir, and P. L. Walker,
Making enterprise risk management pay off: FT Press, 2002.
[29] R. Sharman, "Enterprise risk management-The KPMG approach," British Journal of Administrative Management, pp. 26-28, 2002.
[30] P. Hopkins, "Fundamentals of Risk Management," ed: London: Kogan Page Ltd, 2010.
[31] L. Rittenberg and F. Martens, "Understanding and communicating risk appetite," COSO-The Committee of Sponsoring Organisations of the Treadway Commission, 2012.
[32] L. Santori, K. Bevan, and C. Myers, "Summary of Standard & Poor’s enterprise risk management evaluation process for insurers,"
Standard & Poor's, New York, NY, 2007.
[33] P. X. W. Zou, Y. Chen, and T. Y. Chan, "Understanding and improving your risk management capability: Assessment model for construction organizations," Journal of Construction Engineering and Management, vol. 136, pp. 854-863, 2009.
[34] ISO 31000:2009, "ISO 31000:2009 Risk management Principle - Guidelines ", ed. Switzerland International Standard Organisation, 2009.
[35] R. Banham, "Enterprising views of risk management," Articles of Merit Award Program for Distinguished Contribution to Management Accounting, p. 14, 2005.
[36] E. Dafikpaku, "The strategic implications of enterprise risk management: A framework," in
Enterprise Risk Management Symposium, Chicago, IL, 2011, pp. 14-16.
[37] D. P. Pagach and R. S. Warr, "The effects of enterprise risk management on firm performance,"
Available at SSRN 1155218, 2010.
[38] J. Ward, "ERM: evolving, resonating and maturing down under," RatingsDirect, vol. 61, pp. 9631-2075, 2006.
[39] G. H. Duckert, Practical enterprise risk management: A business process approach vol. 15: John Wiley & Sons, 2010.
[40] A. E. Kleffner, R. B. Lee, and B. McGannon, "The effect of corporate governance on the use of enterprise risk management: Evidence from Canada,"
Risk Management and Insurance Review, vol. 6, pp. 53-73, 2003.
[41] B. G. Hwang, J. Fraser, and B. J. Simkins, "Identifying and communicating key risk indicators,"
Enterprise Risk Management, pp. 125-140, 2010. [42] M. S. Beasley, B. C. Branson, and B. V. Hancock, "Developing key risk indicators to strengthen enterprise risk management," Committee of Sponsoring Organizations of the Treadway Commission (COSO)(Hrsg.), Thought leadership in ERM. Embracing enterprise risk management. Chicago, 2010.
Management Approach," Research in Nation Development, vol. 8, 2010.
[44] N. A. Manab and I. Kassim, "A moderating effect of leadership on a success of enterprise–wide risk management practices," in Proceedings of the 3 rd International conference on business and Economic Research (3 rd ICBER 2012) Conference, Bandung, Indonesia, 2012.
[45] R. L. Gorsuch, "Factor Analysis, 2nd edn, L," ed: Erlbaum Associates, Hillsdale, NJ, 1983.
[46] J. C. Nunnally, I. H. Bernstein, and J. Berge,
Psychometric theory vol. 226. New York: McGraw-Hill 1967.
[47] T. Lyons and M. Skitmore, "Project risk management in the Queensland engineering construction industry: a survey," International journal of project management, vol. 22, pp. 51-61, 2004.
[48] D. M. Bowling and L. Rieger, "Success factors for implementing enterprise risk management," Bank accounting and finance, vol. 18, pp. 21-26, 2005.
[49] N. Chileshe and K. G. John, "Critical success factors for implementation of risk assessment and management practices within the Tanzanian construction industry," Engineering, Construction and Architectural Management, vol. 21, pp. 291-319, 2014.
[50] T. V. Luu, S. Y. Kim, H. L. Cao, and Y. M. Park, "Performance measurement of construction firms in developing countries," Construction Management and Economics, vol. 26, pp. 373-386, 2008.
[51] S. Ward and C. Chapman, "Transforming project risk management into project uncertainty management," International Journal of Project Management, vol. 21, pp. 97-105, 2003.
[52] T. H. Nguyen. (2010, 10th Feb). Owner’s Risk Management for Civil Construction Projects in
Vietnam. Available:
http://professionalprojectmanagement.blogspot.com.a u/2010/03/owners-risk-management-for-civil.html
[53] D. W. Brooks, J. Fraser, and B. J. Simkins, "Creating a risk‐aware culture," Enterprise Risk Management, pp. 87-95, 2010.
[54] N. A. Manab, S. N. Othman, and I. Kassim, "Enterprise-Wide Risk Management Best Practices: The Critical Success Factors," OIDA International Journal of Sustainable Development, vol. 4, pp. 87-96, 2012.
[55] M. J. Norušis, SPSS/PC+ professional statistics version 5.0. Chicago, 1992.
[56] B. Thompson, Exploratory and confirmatory factor analysis: Understanding concepts and applications: American Psychological Association, 2004.
[57] B. Williams, T. Brown, and A. Onsman, "Exploratory factor analysis: A five-step guide for novices," Australasian Journal of Paramedicine, vol. 8, p. 1, 2012.
[58] J. F. Hair, W. C. Black, B. J. Babin, R. E. Anderson, and R. L. Tatham, Multivariate data analysis vol. 6: Pearson Prentice Hall Upper Saddle River, NJ, 2006.
[59] B. Tabachnick and L. Fidell, "Profile analysis: the multivariate approach to repeated measures,"
Using multivariate statistics. Boston (MA): Pearson Education, Inc, pp. 311-74, 2007.
[60] N. K. Malhotra. (2010, 10th March). Marketing research: An applied orientation. Available: http://library.perbanas.ac.id/images/book/PHKI11/mar keting%20research.pdf
APPENDIXES
The exploratory factor analysis (EFA) was used to define a small and manageable set of factor groupings [55]. These groups present the relationship of the large set of correlated variables. Even though EFA is a seemingly complex statistical approach, the approach is sequential and linear, and involves a number of options [56]. Hence, establishing a protocol or decision pathway is extremely important in potential oversights [56]. Reference [57] provides a five-step exploratory factor analysis protocol which is seen as a starting reference point in developing clear decision pathways, showed in the figure 2.
Fig. 2.The 5-step Exploratory factor Analysis Protocol [57]
Step 1: is the data suitable for factor analysis? The first improtant requirement of the EFA is to check whether the sample size is big enough. This can be tested based on the Kaiser-Meyer-Olkin (KMO) [56]. The KMO index ranges from 0 to 1. The sample size is considered as enough for the EFA analysis if the value of KMO index is more than 0.5 [58]. The principal of the EFA method is to uncover the structure or hidden relationships of variables based on grouping the correlated variables. This therefore requires that the original coefficient correlation matrix is not an identity matrix. In other words, the variables in the EFA analysis must be correlated together. This requirement can be tested through the value of and Bartlett’s Test of Sphericity [58, 59].
The table 5 present the KMO and Bartlett’s sphericity test for our EFA analysis of 16 CSFs.
TABLE 5.KMO AND BARTLETT’S TEST
Kaiser-Meyer-Olkin
Measure of Sampling Adequacy. .658
Bartlett's Test of Sphericity
Approx.
Chi-Square 560.976
Df 120.000
Sig. .000
The Kaiser-Meyer-Olkin (KMO) index reports at 0.658, which was higher than the criteria of 0.5 as recommended [58, 59]. This means that our sample is enough for conducting the next steps of EFA method. Additionally, the value of the Bartlett’s Test of Sphericity is very large, reporting at 560.976 with its p-value is less than 0.05. This implies that the correlation matrix is not an identity matrix and is suitable for factor analysis.
Step 2: How will the factors be extracted?
There are two essential stages of conducting EFA: (1) factor extraction and (2) factor rotation. The first stage aims to simplify the facture structure and determine the number of factor groupings which are seen as a set of variables. There are many ways to extract factors, including principal component analysis (PCA), principle axis factoring (PAF), and maximum likelihood, unweight least squares, alpha factoring and image factoring. Among these methods, PCA and PAF are used widely. According to Thompson [56], decisions regarding whether to use PCA or PAF should be based on the application. PCA is viewed as the default method in many statistical programs and is most commonly used, while PAF is suggested for establishing preliminary solutions in EFA
Step 3: What criteria will assist in determining factor extraction?
Many extraction rules and approaches exist to help researchers produce scale dimensionality and simplify factor solutions, such as Kaiser’s criteria (eigenvalue >1 rule) [58], Scree test, cumulative percentage of variance extracted and paralleled analysis. Regarding cumulative percentage of variance, there is no fixed threshold available in theory, even though given percentage has been suggested by many authors [58, 60]. In the natural sciences, factors should be stopped when at least 95% of variance is explained, while variance is commonly 50-60% for the humanities area [58]. The guideline of Malhotra [60] recommends that variance should be higher than 60%. In addition, eigenvalues over 1.000 recommended.
Step 4: Selection of rotation method
This is an essential stage of factor analysis, which is conducted after identifying groups of factors and naming each group. Factor rotation aims to make
Step 1 Is the data suitable for factor
analysis?
Step 2 How will the factors be extracted?
Step 3 What criteria will assist in
determining factor extraction?
Step 4 Selection of rotational method
groupings more interpretable and conclude the final factor groupings [55]. There are two common rotation techniques used: embodying orthogonal rotation and oblique rotation. According to reference [56], orthogonal Varimax, which provides factor structures which are uncorrelated, is the most common rotational technique employed in factor analysis. By contrast, oblique rotation produces correlated factors, which is applied more often in research associated with human behaviors.
Table 6 below describes the summary of the step 2 to 4 in our EFA analysis. The principle component analysis is selected to define underlying factors of 16 CSFs. The result of table 6 shows that 16 CSFs are rotated and extracted into three groups. The first includes CSF4, CSF8, CSF9, CSF10, CSF11, CSF12 and is named as communication and understanding (F1). The second is covered by CSF5, CSF5, CSF7, CSF13, CSF14, and CSF16 and is named as execution and integration (F2). The final group is represented by CSF1, CSF2, CSF3, and CSF15 and is called leadership (F3). Our result is valid with the eigenvalues is more than 1 as recommended [58]. Moreover, the cumulative variance is 64.645 %; this means that the three extracted factors are explained 64.645% of the variance of 16 CSFs. This result is satisfied the criteria suggested [60] .
In addition, Cronbach’s Alpha is employed to test the reliability of three underlying groups. The value of Cronbach’s Alpha is 0.874, 0.869 and 0.799 for communication and understanding, execution and integration, and leadership, respectively, which are higher than the threshold of 0.7 recommended [61]
Step 5: Interpretation
TABLE 6. RESULTS OF USING EXPLORATORY FACTOR ANALYSIS (EFA)
Code CSFs
Components
N of
Items Cronbach's Alpha
1 2 3
CSF10 A common risk language 0.877
6 0.874
CSF8 Leveraging risks as opportunities 0.855
CSF 9 Risk management information
system (RMIS) 0.786
CSF11 Risk communication 0.779
CSF4 Risk-aware culture 0.748
CSF12 Training programs 0.626
CSF6 Risk identification, analysis and
response 0.873
6 0.869
CSF5 Sufficient resources 0.819
CSF16 Monitoring, reviewing and
improvement of ERM framework 0.785
CSF13 Formalized key risk indicators (KRIs) 0.737
CSF14 Integration of ERM into business
processes 0.734
CSF7 iterative and dynamic ERM process
steps 0.69
CSF2 ERM ownership 0.906
4 0.799
CSF1 Commit of the board and senior
management 0.903
CSF15 Objective setting 0.695
CSF3 Risk appetite and tolerance 0.593
Eigenvalue 4.452 3.358 2.449
Variance (%) 27.826 20.99 15.306