SUSCEPTIBLE-INFECTED-REMOVED MODEL OF AIDS
INCIDENCE IN THE PHILIPPINES
Annah Bernice L. Batara1, Jhoanna Lea P. Gayo2, Aldous Cesar F. Bueno3
1, 2, 3
Philippine Science High School-Central Luzon Campus Lily Hill, Clark Freeport Zone, Pampanga, Philippines
3
University of the Philippines Baguio, Baguio City, Philippines
*Corresponding E-mail : abbatara@clc.pshs.edu.ph
Abstract
Acquired Immunodeficiency Syndrome (AIDS) being one of the top 10 most communicable diseases, according to the Alameda County Public Health Department. It is caused by the Human Immunodeficiency Virus (HIV). This virus is also known to have no ways to be removed inside the infected human body yet. The spread of this disease in the Philippines was studied using the Susceptible-Infected-Removed Model which is a modification of the usual Susceptible-Infected-Recovered Model for no data show a person recover from AIDS. In this model, the populations of the Philippines from 1984 to 2010 were gathered. Two methods were used to derive the model, first by curve fitting and the other by computing the infection rate and the removal rate. The number of infected by AIDS and death toll for 2011 to 2016 were predicted using the obtained functions and rates.
Keywords: Acquired Immunodeficiency Syndrome (AIDS), Human Immunodeficiency Virus (HIV), Mathematical model, Susceptible-Infected-Recovered model, Susceptible-Infected-Removed model
Received:January 16, 2018 Accepted:January 25, 2018 Published:February 15, 2018
1.0 Introduction
The world is currently facing a lot of crises and one of the top concerns today are infectious diseases. Infectious diseases are diseases that can be directly or indirectly spread to one person to another and it is caused by microorganisms such as bacteria or viruses (WHO, 2016). Acquired Immune Deficiency Syndrome (AIDS) is a syndrome caused by a virus called HIV or Human Immunodeficiency Virus (HIV). It was discovered in 1959 and still has no cure and until the end of 2015, it has been affecting the world, with 36.7 million living with it (The AIDS Institute n.d). In the Philippines, there were reported 21,138 reported cased from January 1984 to July 2015 and 84% of them are reported from January 2012 which shows a sudden increase of the people infected (Gonzales, 2016).
The time of getting AIDS can reach to about five years. HIV/AIDS cannot be easily detected because it has no symptoms. The only way to know if someone has HIV/AIDS is to get tested. The treatment used for individuals who have HIV/AIDS is called antiretroviral therapy or ART. Without this treatment, a person with AIDS typically survives 3 years but with ART, they can live nearly as long as someone without HIV/AIDS. (Cheung, 2010)
This research aims to create a model that will predict the spread of HIV/AIDS in the Philippines. It will help in understanding the dynamics of disease spread and will give public health officers a hint on how to manage the disease.
2.0 Methodology
2.1 Data Collection
The number of cases infected and removed from HIV/AIDS in the Philippines from the year 1984 to 2015 was requested from the Department of Health Central Office and the number of population, births and deaths in the Philippines from 1903 to 2010 was provided by the Philippine Statistics Authority. The data used were the number of population, births, and the deaths in the Philippines and those infected and removed from HIV/AIDS from the year 1984 to 2010 since those are the years that both the data gathered have.
2.2 Plotting the Data
The number of births, deaths, infected and removed from HIV/AIDS in the Philippines were plotted against time in MS Excel and Mathematica 10 to represent the actual spread of the disease.
2.3 Modeling
The Susceptible-Infected-Recovered (SIR) Model is the most common theoretical estimation of the part of the population that is susceptible to HIV/AIDS, the part of the population that has been infected by it, and the remaining fraction of those who recovered from it, producing a function that will describe the spread of the disease.
The model used in this research is Susceptible-Infected-Removed (SIR) Model since there are no cases in which a person infected with HIV/AIDS recovered. It approximates the fraction of the population that is susceptible, infected and removed or died from HIV/AIDS. For the model, the following assumptions were made:
1. the population is not fixed or the birth rate and death rate are not equal;
2. a person can only leave the susceptible group if he/she is infected and a person who died due to the infection will move to the removed group;
3. factors such as age, sex, social status and race does not affect the probability of being infected;
4. there is no inherited infection; and 5. the member mix homogeneously.
There were two methods used for the SIR Modeling. For the first method, the different types of equations were used to different obtain S, I and R functions. Then, the R2 values of each were compared to know which of the functions best fit the data. For the second method, the infection rate (α) and removal rate (β) were determined and the R2 values were also compared to know which values for α and β best describes the data.
Here are the differential equations that will be used for the second method
In these equations, α is the infection rate, β is the removal rate, g is the growth rate and N
is population at year t.
2.4 Prediction of Values
3.0 Results and Discussion
From the first method, we obtained the following results.
Table 1: The Best-Fit Functions (in million units)
Class Solved Function
Susceptible
( )
0.998149
Infected
( )
0.978151
Removed
( )
0.9906621
From the equations, it can be deduced that the exponential growth rate for the infected and removed are approximately 14.32% and 0.59%, respectively. The high infection rate is quite alarming. Based on the function R(t), the death toll will tend to 3000. The graphs of I(t) and R(t) together with the data are show below. For all graphs, the x-axis: x years after 1984 to 2010 and the y-axis represents the number of Infected/Removed in million units
Figure 1: Graph of the best fit function I(t) (Exponential)
Figure 2: Graph of the Best Function R(t) (Logistic)
5 10 15 20 25
0.001 0.002 0.003 0.004 0.005 0.006
5 10 15 20 25
From the second method, we obtained the following results.
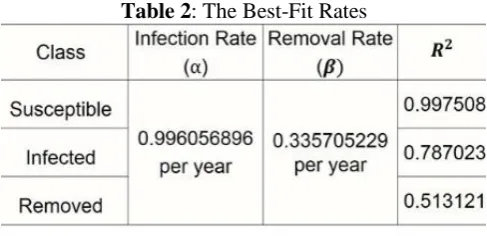
Table 2: The Best-Fit Rates
Getting the reciprocals of the infection rate and recovery rate, we obtain 1.003959 and 2.978804, respectively. These first value implies that the infection period is almost 1 year, while the last implies that the life span of a person with AIDS is approximately 3 years, assuming there is no medication, and this agrees with the result of Cheung 2010.
On the predictions, the model from best-fit functions produce more accurate values than the model from the best-fit rates. This is expected because of the R2 values obtained.
4.0 Conclusion and Recommendation
The model from the best-fit functions showed better results than the model from the best-fit rates based on R2 values and predictive power. With this, the first method used to create Susceptibel-Infected-Removed model is the best model “so far” to describe the spread of AIDS in the Philippines. With the obtained exponential growth rate of 14.32% for the infected, the Philippine should be quick to develop effective programs that will mitigate the spread of AIDS in the Philippines. Health programs should also be implemented to help Filipinos living with AIDS.
References
Cheung, S. Y. (2010). Epidemiological modeling of HIV in populations. 55.
DOH. (2016). HIV/AIDS & ART REGISTRY OF THE PHILIPPINES. Angeles City: DOH.
Introduction to Epidemic Modeling. (n.d.). 1-7. Retrieved from http://www.stat.columbia.edu/~regina/research/notes123.pdf