The Pressure for Reverse Logistics
Adoption among Manufacturers in
Malaysia
Nik Ab Halim Nik Abdullah* and Sabariah Yaakub
ABSTRACT
This study aims to examine how the level of reverse logistics adoption among manufacturers in Malaysia can be influenced by customer/stakeholder pressure, regulatory pressure, financial and competitive pressure, and corporate citizenship pressure. Data were collected through a survey questionnaire, and respondents were managers of manufacturing firms located in the Northern States of Peninsular Malaysia and the Klang Valley. Partial Least Square (PLS) regression analysis was applied and the findings indicate that regulatory pressure has a significantly strong influence on the level of reverse logistics adoption, while customer/stakeholder pressure has moderate influence.
Keywords: Corporate Social Responsibility (CSR), Environmental Protection, Reverse Logistics, Supply Chain Management
JEL Classification: M11, M14, M38
1. Introduction
Reverse logistics refers to the movement of products or materials that occurs in the opposite direction of the supply chain for the purpose of creating or recapturing value, or for the proper disposal of products
or material. Manufacturing firms often focus on forward logistics
and as a result, tend to overlook the importance of reverse logistics
activities. The managements of firms are usually concerned with the
inbound movement of material and product so as to ensure that these * Corresponding author: Nik Ab Halim Nik Abdullah is an Associate Professor at the Department of International Business, School of International Studies, Universiti Utara Malaysia, Kedah, Malaysia. Email: abhalim@uum.edu.my.
can be delivered efficiently within the required time frame and at the
right cost, through the supply chain. Consequently, the importance of having a centralised return centre (CRC) to process returned products
are overlooked by firms. Instead, they wrestle with the temptation to
deploy reverse logistics personnel to the forward logistics function when the facility experiences high demand (Rogers & Tibben-Lembke, 1998). Reverse logistics should be properly managed. Minahan (1998) estimates that reverse logistics activities constitute between 3 to 4 per
cent of a firm’s total logistics costs but some forward thinking firms
in industries such as electronic equipment, household appliances, automotive parts, pharmaceuticals and chemicals view reverse logistics
as a significant source of untapped profitability (Anderson, 2009;
Jayaraman & Luo, 2007). Estee Lauder, for example, has, after a very successful reverse logistics project, created a USD250 million product
line from its returned goods flow. Similarly, Caterpillar’s investment in
a re-manufacturing plant in Mississippi that disassembles and rebuilds diesel engines pays off when the division becomes its fastest growing unit with an annual revenue of USD1 billion and it is estimated to grow at the rate of 20 per cent per year (Jayaraman & Luo, 2007).
Firms in Malaysia currently feel the pressure to introduce reverse logistics into their operations. One of the new challenges faced by the
Malaysian firms that want to go global is the requirement to comply
with legislations or directives introduced by foreign countries that can ensure the effective disposal of manufactured products and waste. For example, in Europe there is a regulation with the objective to
reduce the amount of waste dumped in landfills. All manufacturers,
wholesalers and retailers have to comply with the Waste Electrical and Electronic Equipment (WEEE) Directive 2007. Under the terms of the regulations, manufacturers had to join a WEEE compliance scheme by March 2007, and by July 2007 to have full financial responsibility for
recycling household equipment. Due to this, their ability to manage the
reverse logistics process efficiently will definitely become a critical factor
especially for manufacturers and retailers currently doing business or those intending to venture into Europe (Scott, 2008).
Reverse logistics is also seen to have strategic importance in
alleviating environmental problems and generating economic benefits for firms and is therefore, a major issue of concern (Eltayeb & Zailani,
2011). The increase in awareness on environmental issues and the
benefits of recycling have also placed more pressure on firms to create a better reverse logistics strategy. Understandably, firms that comply
Besides managing product disposal, another activity linked to
a firm’s reverse logistics system is the management of after-sales
service, which is also part of customer relationship management (CRM). A product may be returned by a customer for several reasons: it is defective, it is not as advertised, it is in the wrong size or perhaps because the customer had changed his/her mind and had decided that the product is no longer needed after all (Blanchard, 2007). Proper
after-sales service may help to enhance a customer’s loyalty and at the same time improve the firm’s competitive advantage. According to Gentry (1999), the overall customers’ returns are estimated at 6 per
cent of sales and may be as high as 15 per cent for mass merchandisers and 35 per cent for catalogue and e-commerce retailers. However, most business organisations are not aware of after-sales service factors and the impact they have on customer satisfaction. Failure to realise the importance of these factors can lead to a disastrous and threatening
business relationship. Dissatisfied customers will turn to competitors
who can offer better after-sales services (Shaharudin, Md. Yusof, Elias, & Wan Mansor, 2009).
Thus, it is important for Malaysian manufacturers to realise the importance of reverse logistics and to implement it into their operations. Empirical studies investigating the existence of green supply chain initiative are limited, particularly those which focus on reverse logistics efforts. A study by Rao (2002), for example, had looked at
52 companies based in five countries, namely Philippines, Indonesia, Malaysia, Thailand and Singapore and this made it difficult to draw valid conclusions which can apply to Malaysia (Eltayeb, Zailani, &
Jayaraman, 2010). In this regard, the current study is conducted in order
to determine which factor has the most influence on the level of reverse
logistics adoption in Malaysia. The objective of this study is to locate
the impact of financial and competitive pressure, customer/stakeholder
pressure, regulatory pressure and corporate citizenship pressure on
the level of reverse logistics adoption among manufacturing firms in
Malaysia.
This paper is outlined as follows. First, the paper starts with a brief outline of reverse logistics followed by the development of the theoretical framework and hypotheses. Next, it describes the research method employed to test the hypotheses. The subsequent section
examines the findings and discusses the results. This paper concludes
2. Reverse Logistics
Reverse logistics is defined as the movement of products or materials
occurring in the opposite direction of the supply chain for the purpose of creating or recapturing value, or for proper disposal. It includes processing returned merchandise due to damage, seasonal inventory, restock, salvage recalls and excess inventory, as well as packaging and shipping materials received from the end user or reseller. It also includes recycling programmes, hazardous material programmes, obsolete equipment disposition, and asset recovery (Rogers & Tibben-Lembke, 2001). Rejected items may be returned to the vendor, resold as it is, reconditioned to discount store or to a broker, or donated for charity (thereby earning some tax deduction1). If the item is not usable
anymore, it may end up in a landfill or recycled. The descriptions of
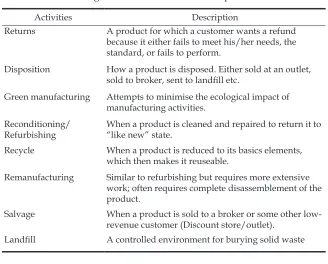
each reverse logistics activities are shown in Table 1.
Table 1: Reverse Logistics Activities and Its Description
1 Under section 34(6)(g) of the Malaysia Income Tax Act 1967, firms may earn tax deductions by
donating the cash income resulting from the reverse logistics activities to approved institutions. Such deductions are restricted to 10 per cent of the aggregate income of the company.
Activities Description
Returns A product for which a customer wants a refund because it either fails to meet his/her needs, the standard, or fails to perform.
Disposition How a product is disposed. Either sold at an outlet, sold to broker, sent to landfill etc.
Green manufacturing Attempts to minimise the ecological impact of manufacturing activities.
Reconditioning/
Refurbishing When a product is cleaned and repaired to return it to “like new” state. Recycle When a product is reduced to its basics elements,
which then makes it reuseable.
Remanufacturing Similar to refurbishing but requires more extensive work; often requires complete disassemblement of the product.
Salvage When a product is sold to a broker or some other low-revenue customer (Discount store/outlet).
Reverse logistics brings forth benefits such as cost reduction to customers and companies (Fassoula, 2005; Gentry, 1999). Further,
reverse logistics removes defective and environmentally hazardous products from consumers through recycling, reusing and reducing the
amount of materials used (Carter & Ellram, 1998; Aghazadeh, 2008), and this causes firms to become more environmental efficient. In their study, Olorunniwo and Li (2010) demonstrate that if a firm plans its
reverse logistics effectively, a domino effect will likely be felt in its other operational activities as operational attributes tend to support each other where an improvement in one will lead to improvement in others. This
finding is supported by Bernon, Rossi, and Cullen (2011) who iterate
that the management of returns processes is important in minimising logistics costs and improving the re-sale revenue of products. Jayaraman and Luo (2007) further stress that high quality reverse logistics can also promote long-term relationships where customers are more likely to
repurchase from firms that are effective and efficient in handling returns.
3. Theoretical Framework and Hypotheses Development Figure 1 presents the theoretical framework of the study. This framework uses the foundation of the institutional theory as its main basis in providing a viewpoint on the adoption of strategies in managing operations and supply chains (Kauppi, 2013). According to the institutional theory, business practices are implemented so as to enhance the legitimacy of the organisations (DiMaggio & Powell, 1983). The institutional theory examines the cause of isomorphism factors that
Figure 1: Theoretical Framework
Reverse Logistics Adoption Level Financial & competitive
pressure
Customer/Stakeholder pressure
Corporate citizenship pressure Regulatory pressure
H1
H2
H3
lead organisations to adopt similar structures, strategies and processes (Deephouse, 1996). There are two main variants to this theory: economic (Haunschild & Miner, 1997) and sociological (DiMaggio & Powell, 1983). This study adopts the sociological variant where the key tenet is that organisational isomorphism increases organisation legitimacy.
Organisation legitimacy is defined as a generalised perception that treats
actions of an organisation as desirable, proper and appropriate within some socially constructed systems (Suchman, 1995). It is also viewed as a necessary condition to compete, thereby driving organisations to adopt processes that lead to isomorphism (Gopal & Gao, 2009).
DiMaggio and Powell (1983) identify three types of mechanisms leading towards institutional isomorphism: coercive, mimetic and normative. Coercive isomorphism is found to be the most relevant to explain the phenomenon in the current study. According to DiMaggio and Powell (1983), coercive isomorphism occurs due to pressures, whether formal or informal, exerted on an organisation by other organisations which it is dependent on and also by the expectations of society. An organisation is under the pressure of its stakeholders, such as its customers and the government, to include social, environmental and economic responsibility considerations into its operations so that it will
be perceived as being more legitimate (Zhu & Sarkis, 2007; Tate, Ellram, & Kirchoff, 2010; Sarkis, Zhu, & Lai, 2011). Miemczyk (2008), however,
iterates that although coercive pressures can lead to the adaptation of
practices, it does not always lead to efficiency.
The current study’s model consists of four independent variables, namely financial and competitive pressure; customer/stakeholder pressure; regulatory pressure; and corporate citizenship pressure.
These proposed factors are expected to directly impact the dependent variable, which is the level of reverse logistics adoption. The basis for this assumption comes from the coercive isomorphism mechanism stated in the institutional theory which posits that formal and informal pressures
exerted by organisations or society can influence the management
practice (Scott, 1987). This is further supported by findings from previous studies examining reverse logistics adoption pressures such
as those done by Eltayeb and Zailani (2011) and Eltayeb, Zailani, and
Jayaraman (2010).
3.1 Financial and Competitive Pressure
In order to be competitive, firms need to innovate and discover the best
and methods in order to progress. At the same time, firms which want
to sustain their competitive advantage must earn the trust of customers and this may be gained by having a good return policy. A good return policy requires a good reverse logistics programme. The reality is that a good reverse logistics programme can be a differentiator and it provides
a way for firms to gain a competitive market advantage (Jayaraman & Luo, 2007). Competition between firms in the global market can put more pressure on firms to reduce costs. Thus, the implementation of reverse logistics activities can enable firms to become more proficient in handling returned goods. This not only improves inter-firm relationships
along the supply chain, but also reduces costs. Hence, a good reverse
logistics programme can improve profits and increase recovery rates (Stock, 1992). Previous studies find that there is a tendency which shows that the intensity with which firms compete with their competitors in
the market positively affects their strategic business policies, such as
influencing their investment decisions (Grenadier, 2002), increasing their innovation effort (Aghion, Bloom, Blundell, Griffith, & Howitt,
2005), and shaping their marketing strategy (Porter, 1979). Due to this, it is hypothesised that:
H1: Financial and competitive pressure is positively related to the level of reverse logistics adoption.
3.2 Demanding Customer/Stakeholders Pressure
Currently, there is a growing concern for environmental protection.
Thus, firms are expected to be under enormous pressure imposed
by their customers and stakeholders such as their shareholders, the government, non-governmental organisations (NGOs) or other pressure groups, to implement reverse logistics. Since customers are prepared to pay more for environmental-friendly products (Casadesus-Masanell,
Crooke, Reinhardt, & Vasishth, 2009; Vandermerwe & Oliff, 1990), a firm is forced to adopt the best reverse logistics practices for fear of
losing its market share. One of the best practices to adopt is the proper disposal of end-of-life products which otherwise, may cause a negative impact on the environment. Public concern for environment should not be viewed as a problem, but instead be considered as an opportunity
for firms to gain more profit by marketing their green products. The
may also include policies involving the replacement of damaged or defective merchandise, the recall of products and the provision of maintenance and repairs. Consequently, logistics professionals must give priority to the effective management of returns (Autry, Daugherty,
& Richey, 2001) as efficient after-sales services will increase customer
satisfaction (Shaharudin et al., 2009). Based on the above arguments, it is hypothesised that:
H2: Demanding customer/stakeholders pressure is positively related to the level of reverse logistics adoption.
3.3 Regulatory Pressure
Sustainable development and environmental protection concerns
are among the significant issues faced by businesses. Regulations on products and waste disposal may be introduced to mandate firms
to recover their used products or accept them back at the end of the
products’ useful life. Regulations are generally credited as having the greatest influence on a firm’s reverse logistics activities (Carter & Ellram, 1998) and so firms are expected to focus on reverse logistics operations
due to regulatory and environmental reasons (Rogers & Tibben-Lembke, 1998). The European Waste Electrical and Electronic Equipment (WEEE) Directive that was introduced in January 2007, for example, requires electrical and electronic manufacturers to comply with this scheme in order to trade in Europe (Scott, 2008). Another example is the German Packaging Ordinance of 1991 which resulted in companies working closely with their competitors so as to put tough environmental policies into practice (Cairncross, 1992). Packaging is returned mainly because it is reusable. Sometimes, there are regulations that require the packaging to be disposed in a proper and acceptable manner (Rogers & Tibben-Lembke, 2001).
In Malaysia, manufacturers have to adhere to the Malaysian Environmental Quality Act 1974. According to its preamble, the Act relates to the prevention, abatement, control of pollution and enhancement of the environment. Under this Act, a manufacturer is required to obtain approvals from the Director-General of Environmental Quality and to ensure the implementation of proper waste disposal activities before it is allowed to construct its premises. In addition, the Environmental Quality (Sewage) Regulations 2009 and Environmental
strengthen the enforcement of Environmental Quality Act 1974. The Regulations, among others, require the operation of the industrial
effluent treatment system to be supervised by competent persons. The
owner is also required to operate and maintain the system in accordance with a sound engineering practice. A performance monitoring is also
required for the components of the effluent treatment system (Federation
of Malaysian Manufacturers, 2009).
Besides the regulatory measures, other types of regulatory mechanisms
also persevere to encourage firms to undertake environmental initiatives and avoid harmful effects to the environment. The first of this is the
various environmental incentives offered to the manufacturing sector and they encompass the provision of pioneer status inclusive of tax
exemption and investment tax allowance for a firm that conducts green
initiative programmes such as proper treatment and disposal of toxic and hazardous waste, recycling activities, conservation of energy and generation of renewable energy (Malaysian Industrial Development Authority, 2012).
Previous studies revealed that most firms practice
environmental-friendly programmes only because they do not want to violate
environmental-related regulations (Luken & Van Rompaey, 2008; Hokey
& William, 2001). Therefore, the third hypothesis of this study is:
H3: Regulatory pressure is positively related to the level of reverse logistics adoption.
3.4 Corporate Citizenship Pressure
Firms are also under tremendous pressure to behave in a socially responsible manner, also known as corporate citizenship pressure. Corporate citizenship is the extent to which businesses are socially responsible for meeting legal, ethical and economic responsibilities placed on them by shareholders. The aim is for businesses to create higher standards of living and quality of life in the communities in
which they operate while still remaining profitable for the benefit of their stakeholders. As demand for socially responsible firms increases,
investors, consumers and employees are now more willing to use their
individual power to punish firms that do not share their values. A
responsible company (Veersalu, 2011). This claim is further supported by The Global, Socially-Conscious Consumer Survey (Nielsen Company,
2012) which finds that 46 per cent of the respondents are willing to pay more for products and services provided by firms that have implemented
programmes that give back to the society. In addition, they also prefer
to work for (62 per cent), and invest in (59 per cent) these firms.
Improvements in information and communication technologies
have significantly empowered consumers and increased their ability to wield power over firms. As such, firms are expected to develop stronger
cultures of corporate social responsibility and to be proactive in seeking ways to honour their moral obligations to society in the 21st century (Dimitriades, 2007). However, in as much as corporate citizenship may be desirable for a society as a whole, it is unlikely to be widely embraced
by firms unless corporate citizenship can yield concrete business benefits
(Isabelle & Ferrell, 2001), for example, when corporate citizenship
activities trigger consumers’ active support.
As discussed above, a good reverse logistic programme differentiates
a firm from its competitors (Jayaraman & Luo, 2007); hence,
implementation of reverse logistics activities is a way to portray good corporate citizenship. Therefore, it is hypothesised that manufacturers will implement or increase the current level of reverse logistics adoption due to corporate citizenship pressure. The fourth hypothesis of this study is thus:
H4: Corporate citizenship pressure is positively related to the level of reverse logistics adoption.
4. Methodology
The population identified for this study consists of all the manufacturing firms located in the three northern states of Peninsular Malaysia, namely Penang, Kedah and Perlis, together with firms located in the
Klang Valley (Kuala Lumpur and Selangor). These states, especially Selangor, Penang and Kedah are the centre of manufacturing activities in Malaysia (Malaysia Investment Development Authority, 2013).
As most manufacturing firms are located in these states, samples
with most manufacturers from electrical and electronics, automotive, chemicals and petroleum, food and beverage, and also machinery and fabricated metal industries.
Based on the sample size table developed by Cavana, Delahaye, and Sekaran (2001), the number of samples needed for this study is 300. A simple random sampling method was adopted in selecting the
respondents. The list of firms were entered into a spread sheet and
assigned with random numbers. The names was then sorted based
on the random numbers and the first 500 firms named in the list were
chosen as samples for this study.
The survey questionnaire for this study was created based on various scales used in previous studies related to reverse logistics or other related studies. Table 2 lists previous works done and the respective survey items incorporated into this study. The questionnaire consisted of three different sections. Section one required the demographic information of respondents. Section two measured the level of reverse
logistics implementation at the respondent firm. In order to measure the current level of reverse logistics adoption among manufacturing firms
in Malaysia, respondents were required to rate the level of investment
made by their respective firms for reverse logistics, resources allocated
for reverse logistics, management commitment and overall involvement towards reverse logistics. A scale of 1 to 5 was used for respondents to rate each item with 1 referred to as the minimum level and 5 as the maximum level. Section three consisted of questions for all four
independent variables of the study. Likewise, a five-point Likert scale of
1 to 5 (Strongly disagree to Strongly agree) was used, and respondents were required to rate their level of agreement or disagreement towards each statement given (Appendix 1).
Variables Previous research
Financial/Competitors pressure
(FinCom) Chad, Patricia, and Richey (2001); Evans (2006) Customer/Stakeholder pressure
(CustSH) Evans (2006); Álvarez-Gil, Berrone, Husillos, and Lado (2007) Regulatory pressure (RegPres) Ninlawan, Seksan, Tossapol, and Pilada
(2010) Corporate citizenship pressure
(CorpCitz) Álvarez-Gil et al. (2007)
In total, 500 survey questionnaires were distributed through personal delivery, regular mail, email, and by fax if so requested by the respondent. For regular mail surveys, a mailed package that included a cover letter explaining the research objectives and instructions on how to complete the questionnaire, together with a postage-paid reply envelope, were sent to respondents in order to encourage the return of the questionnaire. All the necessary action was taken to ensure that those
who filled in the survey via the self-administered questionnaire and
through emails were omitted from the mailing list. The questionnaire
was sent to the key informant within the firm, namely the officer
in-charge of the supply chain and logistics operation or the top management
of the firm itself. A telephone follow-up call was then made two weeks
after the questionnaire was posted as a gentle reminder to respondents.
Respondents were assured of anonymity for themselves and their firms, in addition to a guarantee of confidentiality of data provided.
Despite implementing the above procedure to acquire more returned questionnaires, only 104 of the 500 survey questionnaires distributed were completed and returned, making the return rate of 20.8 per cent. This response rate of 104 questionnaires, however, can be considered as acceptable as evidenced in other researches conducted
in developing countries (Jharkharia & Shankar, 2006; Thakur & Jain,
2006). In Malaysia itself, there are researches done on manufacturing
firms that received response rates of between 9 and 10 per cent only
(Sulaiman, 2000) so the current 20.8 per cent rate is considered good. Upon the preliminary screening of all the returned questionnaires, only 101 questionnaires were deemed usable for further data analysis. Three questionnaires were rejected because there were many missing values.
Straub, & Marie-Claude, 2000). SPSS was used for the preliminary data screening and descriptive analysis before PLS analysis was conducted.
5. Findings and Discussion
5.1 Descriptive Statistics
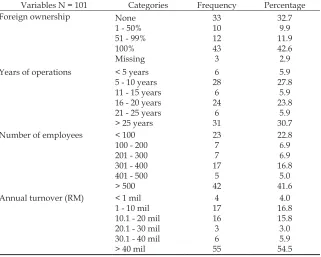
The profiles of the respondents are illustrated in Table 3 showing that
43 respondents (42.6 per cent) are fully owned by foreigners while 33
firms (32.7 per cent) are local firms with no foreign ownership. A total
of 22 respondents (21.8 per cent) are companies co-owned by locals and foreigners. In terms of years of operations, Table 3 highlights that 31 respondents (30.7 per cent) have been operating for more than 25 years, 28 respondents (27.7 per cent) have been operating between 6 to
10 years and 24 firms (23.8 per cent) have been operating between 16 to 20 years respectively. Majority of the respondents are large firms, with
64 respondents (63.4 per cent) employing more than 301 employees. Only 23 respondents (22.8 per cent) employ less than 100 employees.
Variables N = 101 Categories Frequency Percentage Foreign ownership None
1 - 50% 51 - 99% 100% Missing 33 10 12 43 3 32.7 9.9 11.9 42.6 2.9 Years of operations < 5 years
5 - 10 years 11 - 15 years 16 - 20 years 21 - 25 years > 25 years
6 28 6 24 6 31 5.9 27.8 5.9 23.8 5.9 30.7 Number of employees < 100
100 - 200 201 - 300 301 - 400 401 - 500 > 500 23 7 7 17 5 42 22.8 6.9 6.9 16.8 5.0 41.6 Annual turnover (RM) < 1 mil
1 - 10 mil 10.1 - 20 mil 20.1 - 30 mil 30.1 - 40 mil > 40 mil
Table 4: Level of Reverse Logistics Adoption
N Mean Std. Deviation
Financial investment in RL 101 2.36 1.168
Resources allocated for RL 101 2.35 1.104
Mgmt Commitment in RL 101 3.12 1.249
Overall involvement in RL 101 2.74 1.180
More than half of the respondents (54.5 per cent) earn more than RM 40 million a year while 33 respondents (32.6 per cent) earn between RM 1 million to RM 20 million annually. Only four respondents (4 per cent) earn less than a million ringgit in revenue annually.
In order to measure the level of reverse logistics adoption, four
measures were used, namely the firm’s financial investment, resource
allocation, management commitment and overall involvement towards reverse logistics activities. Table 4 shows that three out of these four indicators score a mean value of less than 3.0 (average). They are
financial investment, resource allocation and overall involvement. Only
the mean score for management commitment is more than average, which is 3.12. The overall mean for reverse logistics level is 2.67.
5.2 Reliability and Validity
The assessment of the measurement model is done by examining the content validity, convergent validity and discriminant validity. For content validity, all scales used in this study were derived from previous
studies as stated in the methodology section earlier. A first draft of the
questionnaire was discussed with a few academicians who are experts in logistics and supply chain areas so as to ensure that the items included in the questionnaire were relevant before it was pilot tested on 30
manufacturing firms. The Cronbach Alpha for each variable is above the cut-off level of 0.6. Therefore, content validity is assumed to be fulfilled
an Average Variance Extracted (AVE) score of at least 0.5 (Fornell & Larcker, 1981). Table 5 also shows that all constructs have an AVE value of more than 0.5, therefore, it can be concluded that the model has an adequate convergent validity.
Table 5: Survey Items Loadings
Indicators Loadings Composite Reliability Average Variance Extracted (AVE) Corporate Citizenship Pressure (CorpCitz) 0.8829 0.6046
CorpCitz1 0.6796
CorpCitz2 0.2530
CorpCitz3 0.9398
CorpCitz4 0.6877
CorpCitz5 0.7890
CorpCitz6 0.7324
Regulatory Pressure (RegPres) 0.8633 0.5174
RegPres1 0.5669
RegPres2 0.7019
RegPres3 0.6405
RegPres4 0.8809
RegPres5 0.7459
RegPres6 0.7378
Customer/Stakeholder Pressure (CustSH) 0.7924 0.5425
CustSH1 0.7407
CustSH2 0.8560
CustSH3 0.5567
CustSH4 0.51503
CustH5 0.5000
CustSH6 -0.0759
Financial/Competitors Pressure (FinCom) 0.7967 0.5429
FinCom1 0.3972
FinCom2 0.5545
FinCom3 0.6780
FinCom4 0.7307
FinCom5 0.7205
FinCom6 0.6203
Reverse Logistics Level (RLlevel) 0.9143 0.7285
RLlevel_Fin 0.8536
RLlevel_Invnt 0.9035 RLlevel_Mgmt 0.7443
Discriminant validity describes the degree in which the operationalisation is not similar to other operationalisation that it theoretically, should not be similar to. Campbell and Fiske (1959) introduce the concept of discriminant validity within their discussion on evaluating test validity. A successful evaluation of discriminant validity shows that a test of a concept is not highly correlated with other tests designed to measure theoretically different concepts. The AVE statistics were then used to determine the discriminant validity of the model. The square root of the average variance extracted (AVE) statistics were calculated using Microsoft Excel and compared with the correlations among the latent variables by using the latent variable correlation matrix output of PLS (Chin et al., 2003).
The latent variable correlation matrix and the square root of the AVE are indicated in Table 6. The correlations between the constructs are displayed in the lower left off-diagonal elements in the matrix. The average variance shared between the construct and its measurements should be greater than the variance shared between the construct and other constructs in the model (Fornell & Larcker, 1981). Table 6 shows that the diagonal elements in bold (square root of AVE) are greater than the off-diagonal elements at both corresponding rows and columns. For example, the square root of AVE for CorpCitz (0.778) is higher than the correlation of CustomerSH and CorpCitz (0.196). It is also higher than
the corporate citizenship’s correlation with other constructs (FinCom = 0.343; RL_Level = 0.121; RegPres = 0.331). Therefore, it can be concluded
that the findings of the PLS measurement model analysis show evidence of discriminant validity, where all constructs are statistically discriminated from the others.
CorpCitz CustomerSH FinCom RL_Level RegPres CorpCitz 0.778
CustSH 0.196 0.737
FinCom 0.343 0.343 0.737
RL_Level 0.121 0.240 0.246 0.853
RegPres 0.331 0.215 0.324 0.293 0.720
Table 6: Latent Variable Correlation Matrix
5.3 Result of the Analysis
Table 7 shows the outcome of PLS model analysis and it details the
variables. The T-distribution table was referred to in order to obtain the P value (Degree of freedom, df = 100). The result shows that out of four
relationships tested, only two are significant, namely between customer/
stakeholder pressure (CustomerSH) with the level of reverse logistics adoption (RL_Level), and between corporate citizenship (CorpCitz) and the level of reverse logistics adoption (RL_Level). Previous studies using
PLS have typically considered path coefficient of above 0.20 as having a strong relationship, path coefficients of between 0.10 to 0.20 as moderate, and path coefficients below 0.10 as weak (Johnson, 1997). In this study, the path coefficient for regulatory pressure is 0.23 thereby indicating
a strong relationship with the level of reverse logistics adoption while customer/stakeholder pressure which is 0.15 indicates that it only has a moderate relationship with adoption.
Sign Path T-Value P-Value Sig
FinCom → RL_Level + 0.13 0.924 0.1789 No
CustomerSH → RL_Level + 0.15 1.682 0.0478** Yes
RegPres → RL_Level + 0.23 1.760 0.0407** Yes
CorpCitz → RL_Level - 0.03 0.138 0.4453 No
Table 7: Outcome of Structural Model Analysis
Note: ** indicate significance at the 5% level
Meanwhile, the degree in which the PLS model accomplishes its objectives of minimising errors or maximising the variance explained, can be determined by examining the R2 values (Lertwongsatien, 2000).
R2is a measure of the proportion of the total of the dependent variables,
which is explained through independent variables. Falk (2005) suggests that the R2 value should be more than 0.1, and any value lower than that
informs very little even though it is statistically significant. The variance
explained values (R2) for level of reverse logistics adoption is 0.132 which
means that the model explains 13.2 per cent of the variance in the level of reverse logistics adoption among manufacturers in Malaysia.
6. Discussions and Contributions of the Study
The main objective of this study is to empirically investigate the level of
reverse logistics adoption and the impact of financial and competitive
manufacturing firms in Malaysia. The data analysed have led to some major findings. First, the level of reverse logistics adoption among
Malaysian manufacturers is still low with a mean score of 2.67. An item by item analysis shows that the levels of investment, resources and overall commitment towards reverse logistics are less than average. It
shows that firms are not ready to commit themselves in investing and
allocating extra resources for reverse logistics adoption. Even the score for commitment by the management shows just a slightly higher than average score. It appears that manufacturers are not ready to invest in and allocate resources even though the management of the company
is aware of the benefits of adopting reverse logistics.
Only two out of the four variables utilised in this study have a
significant relationship with reverse logistics adoption level, namely regulatory pressure, and customer/stakeholder pressure. This finding
could be explained by what is known as coercive isomorphism stated
under the institutional theory. According to the institutional theory, firms
are coerced into conforming to the expectations of society, especially when they are under pressure from their stakeholders, i.e. customers and the government. In this study, when faced with regulatory pressure
(from the government, mostly), firms feel the pressure to adopt reverse logistics in their operations. Hence, there is a significant positive
relationship between regulatory pressure and reverse logistics adoption level. The level of reverse logistics adoption, therefore, can be increased by introducing a new regulation or by improving the current existing legislation related to industrial waste management and recycling.
This finding noting the positive relationship between environmental
regulations and various environmentally friendly practices adopted
by firms is also similar to other studies (Porter & Linde, 1995; Khanna, Deltas, & Harrington, 2009; Weng & Lin, 2011) .
Demanding customers and stakeholders, meanwhile have a
moderate positive influence on the level of reverse logistics adoption.
This finding demonstrates that the government, shareholders,
consumers and pressure groups such as NGOs have an influence on a firm’s decision and their voices could lead to an increased likelihood of the firm adopting reverse logistics. Consumers are very concerned
with environmental issues when buying a product or using a service.
A study in the United States shows that 75 per cent of the consumers’ purchasing decisions are affected by a firm’s environmental reputation
indirectly indicate that environmental awareness among consumers
and stakeholders in Malaysia influences a firm’s decision in adopting
the environmental friendly logistics practices such as reverse logistics. Managers are under greater pressure to undertake reverse logistics not only as a consequence of their ethical principles but also because they feel that it is a good way to satisfy their customers and stakeholders.
This study finds that financial/competitive pressure has no
significant impact on reverse logistics adoption. Thus, the findings of this study are in contrast with previous studies which find that there is a tendency showing the intensity with which a firm competes with its
competitors in the market can affect its strategic business policies, such
as influencing its investment decisions (Grenadier, 2002), increasing its
innovation effort (Aghion et al., 2005), or shaping its marketing strategy (Porter, 1979). It is possible that Malaysian manufacturers do not feel the pressure to increase their level of reverse logistics adoption because their competitors are also not concerned with it.
Corporate citizenship pressure, although very popular currently,
also does not significantly pressure manufacturers to improve their reverse logistics activities. The findings of this study show that awareness
about the importance of sustainable development, environmental protection and corporate social responsibility (CSR) among Malaysian manufacturers is still low as compared to their counterparts in other developing and developed nations. Therefore, there is a need to educate Malaysian manufacturers on the importance of corporate citizenship as a way of improving customer relationship management. Implementation
of reverse logistics should be one of the priorities as it reflects corporate citizenship efforts among these firms. However, manufacturers might
feel that their involvement in corporate citizenship programme such as sustainable development, CSR or sponsoring any events will reduce
their profit although studies have shown otherwise. According to Vogel (2005), firms can improve their financial position through involvement
in corporate citizenship activities.
To date, most studies looking at reverse logistics adoption such as those done by Chad et al. (2001), and Alvarez Gil et al. (2007) were conducted in developed countries. It has been noted that the
most important factor which influences adoption is different between
Malaysia. The results of this empirical study demonstrate that stricter regulation and strong pressure from customers and stakeholders may also act as drivers that can increase environmental awareness among
managers of manufacturing firms and initiate firms’ implementation of best practices and activities in reverse logistics. The findings therefore,
may serve as a guideline for business managers and most importantly, policy makers in Malaysia, when making policies related to reverse logistics, sustainable development and environmental protection. At the
same time, manufacturers can maximise their customer’s satisfaction
and improve their corporate image if they adhere to the environmental regulations and promote sustainable manufacturing practices such as
reverse logistics in their operations. The expected business benefits
derived from the reverse logistic operation may propel manufacturers
to increase the level of adoption (Eltayib & Zailani, 2011).
This study suggests that it is important for the management of a
firm, in particular a manufacturer, to have an understanding of reverse
logistics, and the reason why it should seriously enhance the level of reverse logistics activities in its operations. As more manufacturers sell or plan to sell their products in foreign markets, the most important
challenge to be met is thus to fulfil the requirements as stated in the
regulations related to environmental protection as previously discussed in this paper. The manufacturers must ensure that they comply with the regulations by implementing a proper reverse logistics management that
can efficiently manage product returns, and waste or product disposal.
7. Limitations and Directions for Future Research
There are a few limitations in this study which could provide the leeway to conduct further research. First, the data collected for this study is small due to cost and time constraints. The sample size of this survey is only 101 manufacturers located in the Northern States of the Peninsular Malaysia and the Klang Valley. A research with a greater sample size replicating this survey may use different samples
of firms in other sectors such as service sector throughout Malaysia so as to validate current findings. Moreover, this study did not categorise
the respondents based on their level of adoption such as high reverse logistics adoption level, low level adopters and also non-adopters which
could be further refined and tested as a model. In addition, this study
specific industry or sizes of respondent firms and the respective levels of
reverse logistics adoption would provide new insights into the reverse
logistics adoption factors. The factors influencing the adoption of reverse
logistics could be different between small and medium enterprises (SMEs) and other enterprises.
8. Conclusion
The objective of this study is to identify the level of reverse logistics adoption and the pressure for adoption among manufacturers in Malaysia. 101 companies were involved and based on the research
findings, it may be concluded that the level of reverse logistics in
Malaysia is still low as manufacturers are not ready to invest and allocate their resources towards reverse logistics activities. Based on the pressure for adoption analysis, two possible means of improving the level of
reverse logistics adoption are identified: enforcement of regulations
and pressure from stakeholders such as supply chain partners, pressure groups, non-governmental organisations and consumers.
References
Álvarez-Gil, M.J., Berrone, P., Husillos, F.J., & Lado, N. (2007). Reverse logistics, stakeholders’ influence, organizational slack, and managers’ posture.
Journal of Business Research, 60(5), 463-473.
Aghazadeh, S.M. (2008). The success of reverse logistics in supporting the environment: The case of the computer industry. International Journal of
Environment and Sustainable Development, 7(4), 452-464.
Aghion, P., Bloom, N., Blundell, R., Griffith, R., & Howitt, P. (2005). Competition and innovation: An Inverted-U relationship. The Quarterly Journal of
Economics, 120(2), 701-728.
Anderson, P. (2009). How to succeed in reverse logistics. Material Handling
Management, 64(8), 41-42.
Autry, C.W., Daugherty, P., & Richey, R.G. (2001). The challenge of reverse logistics in catalog retailing. International Journal of Physical Distribution
& Logistics Management, 31(1), 26.
Bernon, M., Rossi, S., & Cullen, J., (2011) Retail reverse logistics: A call and grounding framework for research. International Journal of Physical
Distribution & Logistics Management, 41(5), 484-510.
Blanchard, D. (2007). Supply chains also work in reverse. Industry Week/IW, 256(5), 48-48.
Cairncross, F. (1992). How Europe’s companies position to recycle. Harvard
Campbell, D.T., & Fiske, D.W. (1959). Convergent and discriminant validation by the multitrait-multimethod matrix. Psychological Bulletin, 56, 81-105. Carter, C.R., & Ellram, L.M. (1998). Reverse logistics: A review of the literature
and framework for future investigation. Journal of Business Logistics, 19(1), 85 -102.
Casadesus-Masanell, R., Crooke, M., Reinhardt, F. & Vasishth, V. (2009). Households’ willingness to pay for ‘green’ goods: Evidence from Patagonia’s introduction of organic cotton sportswear. Journal of Economics
& Management Strategy, 18, 203–233.
Cavana, R.Y., Delahaye, B.L., & Sekaran, U. (2001). Applied Business Research:
Qualitative and Qantitative Method. Queensland: John Wiley & Sons
Australia Ltd.
Chad, W.A., Patricia, J.D., & Richey, R.G. (2001). The challenge of reverse logistics in catalog retailing. International Journal of Physical Distribution
& Logistics Management, 31(1), 26 - 37.
Chin, W.W., Marcolin, B.L., & Newsted, P.R. (2003). A partial least squares latent variable modelling approach for measuring interaction effects: Results from a Monte Carlo simulation study and voice mail emotion/adoption study. Information Systems Research, 14(2), 189-217.
Deephouse, D. (1996). Does isomorphism legitimate? Academy of Management
Journal, 39(4), 1024-1039.
DiMaggio, P.J., & Powell, W.W. (1983). The iron cage revisited: Institutional isomorphism and collective rationality in organizational fields. American
Sociological Review, 48(2),147-160.
Dimitriades, Z.S. (2007). Business ethics and corporate social responsibility in the e-economy: A commentary. Electronic Journal of Business Ethics and
Organisation Studies, 12(2). Available at http://ejbo.jyu.fi/articles/0701_1.
html (accessed on 21 March 2015).
Drumwright, M.E. (1994). Socially responsible organisational buying: Environmental concern as non-economic buying criterion. Journal of
Marketing, 58(3), 1-19.
Eltayeb, T.K., & Zailani, S.H.M., (2011). Drivers on the reverse logistics: Evidence from Malaysian certified companies. International Journal of Logistics
Systems and Management, 10(4), 375-397.
Eltayeb, T.K., Zailani, S.H.M., & Jayaraman, K. (2010), The examination on the drivers for green purchasing adoption among EMS 14001 certified companies in Malaysia. Journal of Manufacturing Technology Management, 21(2), 206-225.
Evans, M.J. (2006). Understanding Innovation Adoption in the Air Force.
Unpublished Master’s Degree Thesis. Air Force Institute of Technology, Ohio.
Falk, M. (2005). ICT-linked firm reorganisation and productivity gains.
Technovation, 25(11), 1229-1250.
Fassoula, E. (2005). Reverse logistics as a means of reducing the cost of quality.
Federation of Malaysian Manufacturers. (2009). Explanatory Notes on Industrial
Effluent Regulations 2009. Available at http://www.fmm.org.my/upload/ Explanatory_Notes_EQ_Industrial_Effluent _Regulations_2009.pdf (accessed on 14 July 2014).
Fornell, C., & Larcker, D.F. (1981). Evaluating structural equation models with unobservable variables and measurement error. Journal of Marketing
Research, 18(1), 39-50.
Gefen, D., Straub, D.W., & Marie-Claude, B. (2000). Structural equation modelling techniques and regression: Guidelines for research practice.
Communications of AIS, 7(7), 1-78.
Gentry, C.R. (1999). Reducing the cost of returns. Chain Store Age, 75(10), 124-126 .
Gopal, A., & Gao, G. (2009). Certification in the Indian offshore IT services industry. Manufacturing & Service Operations Management, 11(3), 471-492. Grenadier, S. (2002). Option exercise games: An application to the equilibrium
investment strategies of firms. Review of Financial Studies, 15, 691-721. Haunschild, P., & Miner, A. (1997). Modes of interorganizational imitation:
The effects ofoutcome salience and uncertainty. Administrative Science
Quarterly, 42(3),472-500.
Hokey, M., & William, P.G. (2001). Green purchasing practices of US firms.
International Journal of Operations & Production Management, 21(9),
1222-1238.
Isabelle, M., & Ferrell, O.C. (2001). Corporate citizenship as a marketing instrument - Concepts, evidence and research directions. European Journal
of Marketing, 35(3), 457-484.
Jayaraman, V., & Luo, Y. (2007). Creating competitive advantages through new value creation: A reverse logistics perspective. Academy of Management
Perspectives, 21(2), 56-73.
Jharkharia, S., & Shankar, R. (2006). Supply chain management: Some sectoral dissimilarities in the Indian manufacturing industry. Supply Chain
Management: An International Journal, 11(4), 345 - 52.
Johnson, J.P. (1997). Strategic Decision Making, Commitment and Organizational Justice: Implications for the Control and Performance of International Joint
Venture. Unpublished Doctor of Philosophy thesis. University of South
Carolina, South Carolina.
Kauppi, K. (2013). Extending the use of institutional theory in operations and supply chain management research. International Journal of Operations &
Production Management, 33(10), 1318-1345.
Khanna, M., Deltas, G., & Harrington, D.R. (2009). Adoption of pollution prevention techniques: The role of management systems and regulatory pressures. Environmental Resource Economics, 44(1), 85-106.
Lertwongsatien, C. (2000). An Impirical Investigation of the Strategic Implications
of Information System Resources and Capabilities. Unpublished Doctor of
Luken, R., & Van Rompaey, F. (2008). Drivers for and barriers to environmentally sound technology adoption by manufacturing plants in nine developing countries. Journal of Cleaner Production, 16(1), 67-77.
Malaysian Environmental Quality Act, 1974. Available at http://www.agc.gov.
my/Akta/Vol.3/Act127.pdf (accessed on 20 October 2014).
Malaysian Environmental Quality (Sewage) Regulations 2009. Available at http://
faolex.fao.org/docs/texts/mal99051.doc (accessed on 20 October 2014). Malaysian Industrial Development Authority (MIDA). (2012). Investment in the
Manufacturing Sector: Policies, Incentives and Policies. Availabe at http://
www.mida.gov.my/home/administrator/system_files/modules/photo/ uploads/20140 (accessed on 21 October 2014).
Miemczyk, J. (2008). An exploration of institutional constraints on developing end-of-life product recovery capabilities. International Journal of Production
Economics, 115(2), 272-282.
Minahan, T. (1998). Manufacturers take aim at end of the supply chain.
Purchasing, 124(6), 111-112.
Nielsen Company. (2012). The Global, Socially-Conscious Consumer
Survey. Available at http://www.fi.nielsen.com/site/documents
NielsenGlobalSocialResponsibilityReport March2012.pdf (accessed on 20 June 2014).
Ninlawan, C., Seksan, P., Tossapol, K., & Pilada, W. (2010). The Implementation of Green Supply Chain Management Practices in Electronics Industry.
Paper presented at the International MultiConference of Engineers and Computer Scientists, Hong Kong, China on 17-19 March 2010.
Olorunniwo, F.O., & Li, X., (2010). Information sharing and collaboration practices in reverse logistics. Supply Chain Management: An International
Journal, 15(6), 454–462.
Porter, M.E. (1979). How competitive forces shape strategy? Harvard Business
Review, March - April, 137-145.
Porter, M.E., & Linde, C.V.D. (1995). Green and competitive: Ending the stalemate. Harvard Business Review, 73, 120-134.
Rao, P. (2002). Greening the supply chain: A new initiative in South East Asia.
International Journal of Operations and Production Management, 22(6), 632-55.
Rogers, D.S., & Tibben-Lembke, R.S. (1998). Going Backwards: Reverse Logistics
Trends and Practices. Pittsburgh: Reverse Logistics Executive Council.
Rogers, D.S., & Tibben-Lembke, R.S. (2001). An examination of reverse logistics practices. Journal of Business Logistics, 22(2), 129-148.
Sarkis, J., Zhu, Q., & Lai, K. (2011). An organizational theoretic review of green supply chain management literature. International Journal of Production
Economics, 130(1),1-15.
Scott, A. (2008). Taking it back: Why reverse logistics will at last be taken seriously. Logistics & Transport Focus, 10(6), 34-35.
Scott, R.W. (1987). The adolescence of institutional theory. Administrative Science
Shaharudin, M.R., Md. Yusof, K.M., Elias, S.J., & Wan Mansor, S. (2009). Factors affecting customer satisfaction in after-sales service of Malaysian electronic business market. Canadian Social Science, 5(6), 10-18.
Stock, J.R. (1992). Reverse Logistics. Illinois: Council of Logistics Management. Suchman, M. (1995). Managing legitimacy: Strategic and institutional
approaches. Academy of Management Review, 20(3), 571-610.
Sulaiman, A.(2000). The status of e-commerce applications in Malaysia.
Information Technology for Development, 9(3/4),153.
Tate, W.L., Ellram, L.M., & Kirchoff, J.O.N.F. (2010). Corporate social responsibility reports: Athematic analysis related to supply chain management. Journal of Supply Chain Management, 46(1), 19-44.
Thakur, L.S., & Jain, V.K. (2006). Technology adoption in India: A future perspective with analysis of important variables. Journal of Advanced
Manufacturing Systems, 5(2), 179.
Vandermerwe, S., & Oliff, M.D. (1990). Customers drive corporations green.
Long Range Planning, 23(6), 10-16.
Veersalu, L. (2011). The Importance of Corporate Social Responsibility in Estonian
Consumers’ Purchasing Decisions. Unpublished Bachelor Degree Thesis.
Tallinn University of Technology, Estonia.
Vogel, D.J. ( 2005). Is there a market for virtue? California Management Review, 47(4), 19-45.
Weng, M.H., & Lin, C.Y. (2011). Determinants of green innovation adoption for small and medium-size enterprises (SMES). African Journal of Business
Management, 5(22), 9154-9163.
Zhu, Q., & Sarkis, J. (2007). The moderating effects of institutional pressures on emergent green supply chain practices and performance. International
Items Code Customer/Stakeholder Pressure
Customer and stakeholder had the power to influence my company’s
decision. CustSH1
The demand made by customer/stakeholder were viewed as
important by my company’s management team. CustSH2
Customer/stakeholder is very concern about environmental
protection and sustainable development these days. CustSH3 Continuous improvement in customer service is a priority at my
company. CustSH4
My company will definitely implement any new business initiative
if it can handle customer issues more efficiently. CustSH5 Nowadays, governmental agencies and NGOs are strongly demanding
for responsible and sustainable environmental development. CustSH6
Regulatory Pressure
Environmental regulations have been intensified over the last few
years. RegPres1
Regulations related to consumer purchase protection have also
intensified. RegPres2
My company has or is in the process of achieving the ISO 14000
Environmental management accreditation. RegPres3 Customers prefer to do business with companies that have been
accredited with ISO 14000. RegPres4
Pressure for a proper waste management or recycling is higher these
days. RegPres5
Compliance with existing and future environmental regulations is a
priority at my company. RegPres6
Corporate Citizenship Pressure
Environmental protection and sustainable development is important
to my company. CorpCitz1
My company encourages our customer to return used products to
be recycled. CorpCitz2
My company always sponsors or gets involved in activities related
to environmental protection and sustainable development. CorpCitz3 Relationship with the community is important as it can effect my
company’s reputation. CorpCitz4
Green manufacturing or green purchasing practices is one of my
company’s priorities. CorpCitz5
Social responsibility to customers and suppliers is important to my
company. CorpCitz6
Financial and competitive pressure
Providing reliable and efficient services at the lowest possible cost
to the customer is our priority FinCom1
Operational efficiency and cost reduction is a huge concern at my
company. FinCom2
My company had to be committed and invest in reverse logistics
activities in order to stay competitive. FinCom3 Competitors have an effective policy in managing returned goods. FinCom4 My company seeks to improve its competitiveness by adopting new
and innovative ideas. FinCom5