Original
Article
of Human Microsatellite D19S884
Fazliana Mansor, Liyana ZaMri, Siti Sarah HaMZaH
Institute for Medical Research, Jalan Pahang, 50588 Kuala Lumpur, Malaysia
Submitted: 8 Jul 2014
Accepted: 24 Jan 2015
Abstract
Background: The detection and analysis of microsatellites is very important for the mapping of genetic diseases because they are commonly used as genetic markers. Microsatellite marker D19S884 has been associated with polycystic ovary syndrome (PCOS), the most common reproductive endocrine disease of women in their childbearing years. It is responsible for an estimated 70% of cases of anovulatory infertility. In this work, we detected microsatellites in DNA extracted from the blood of PCOS patients.
Methods: DNA microsatellites were amplified by polymerase chain reaction (PCR) using a pair of specific primers tagged with fluorescence to yield products of 160–200 base pairs in length. Alleles were separated on 4% low-melting agarose gels; stained with a safe gel staining, GelRed™, which is an alternative to ethidium bromide; and visualised by ultraviolet illumination.
Results: Bands were observed, but their base-pairs differences were difficult to distinguish. To identify each allele clearly, the PCR products were also analysed using capillary gel electrophoresis for fragment analysis where it was possible to discriminate even in case of difference between two pairs of bases between the alleles.
Conclusion: In this article, we present a protocol that combines the use of gel electrophoresis and fragment analysis in the identification of genetic biomarkers for PCOS.
Keywords: microsatellite, D19S884, low-melting agarose gel, FBN3, GelRed, fragment analysis
Introduction
Microsatellites are short repetitions of nucleotides in the genome. They are tandemly repeated segments of base pairs at a unique physical location in the genome, and tend to occur in non-coding deoxyribonucleic acid (DNA). A microsatellite varies among individuals as shown by patterns of inheritance tracked through families (1,2). Microsatellite analysis is being used in the study of genetic factors that determine complex diseases (3). Polycystic ovary syndrome (PCOS) is the most common reproductive endocrine disease of women in their childbearing years. It is responsible for an estimated 70% of cases of anovulatory infertility. The World Health Organization estimates that, as of 2010, it affected 116 million women worldwide (4). Although the mode of inheritance remains unclear, PCOS is likely a complex endocrine disorder involving several genes (5,6). Although more than 70 candidate genes have been studied, PCOS status has been associated through evidence with only one locus on chromosome 19p13.2 (D19S884) (7,8).
D19S884 is a dinucleotide repeat polymorphism ((CA)n) mapping to chromosome 19p13.2. It is located very close to the insulin
receptor gene (INSR) (9). D19S884 is located exactly in intron 55 of the fibrillin 3 gene (FBN3). Women with PCOS and one or two alleles of allele 8 (FBN3+) have significantly elevated fasting insulin levels, and homeostasis model assessment of insulin resistance values indicates that they are more insulin resistant than affected women with all other alleles of D19S884 (FBN3-) (8). Several studies, which predominantly focus on Caucasians using independent patient cohorts, have investigated the association between PCOS and the D19S884 marker (8–10). The length polymorphism of a microsatellite marker is commonly detected through polymerase chain reaction (PCR) amplification using pairs of specific primers flanking tandem arrays of microsatellite repetitions and proceeded by electrophoresis (11). Horizontal electrophoretic analyses are commonly performed using agarose gels. However, denatured vertical polyacrylamide gels are often preferred due to their higher resolution (12).
electrophoresis and sized according to a size standard. Usually, genetic marker analysis experiments rely on detection of changes in the length of a specific DNA sequence to indicate the presence or absence of a genetic marker. In this analysis, the sequence of the gene is not directly analysed, but the presence of a particular allele or mutant version of the allele of the gene is inferred from the presence or absence of a linked DNA sequence, which can serve as a marker for the allele. Genetic markers are usually polymorphic genetic sequences contained in or near an allele of interest, such as microsatellites or restriction fragment length polymorphisms which allow the chromosomal alleles to be distinguished (13,14). Here, we describe applications of low melting agarose (LMA) gel electrophoresis and capillary electrophoresis for D19S884 genotyping in PCOS patients.
Material and Methods
DNA extraction
For isolation of genomic DNA, patients’ blood samples were collected aseptically in vacutainers containing anticoagulant solution. The genomic DNA was extracted from 200 µL of blood using QiaAmp Blood Mini Kit (Qiagen) according to the manufacturer’s instructions. The quality of the DNA extracted was checked by agarose gel electrophoresis, and the quantity was checked by Multiskan™ GO Microplate Spectrophotometer (Thermo Scientific) and stored at -20°C. Ethics approval for this study was obtained from the Medical Research Ethic Committee, Ministry of Health of Malaysia (NMRR-13-206-15132).
Polymerase chain reaction
Microsatellite loci are amplified by PCR using fluorescently labeled forward primers and unlabeled reverse primers. A pair of microsatellite primers was custom synthesised at First BASE Laboratories Sdn Bhd (Selangor, Malaysia) and utilised in the study for amplification of PCOS markers. PCR primers for amplifying the D19S884 marker were 5’ACATTGGCTCACACAACTGCT -3’ (forward) and 5’-GCTCAGGGTCATGTGTCTGTACT-3’
(reverse, marked with FAM) (Table 1). PCR amplification was carried out in a total volume of 25 µL containing 150 ng template DNA, 0.2 µM of each primer, and 1.5 µL of PCR Master Mix (Type–It Microsatellite Kit, Qiagen). PCR was performed in a GeneAmp PCR System 9700 thermal cycler (Applied BioSystem) as follows: an initial denaturation step at 95 °C for 5 minutes, denaturation at 90 °C for 30 seconds, annealing at 60 °C for 90 seconds, and extension at 72 °C for 30 seconds. For 28 cycles, the extension temperature of 72 °C was held for 30 minutes.
Gel electrophoresis
First, the PCR products were run in 2%, 3%, and 4% (weight/volume) LMA gel in 1X Tris/ Borate/EDTA (TBE) buffer at 100V at 90 minutes for gel electrophoresis optimisation. Then the PCR products were electrophoresed on a 4% LMA gel (Fisher Scientific) using 1X TBE buffer at 100 V for 1 hour and 25 minutes. O’Range Ruler 20 base pair DNA Ladder (Thermo Fisher Scientific Inc.) was used as the DNA standard. Bands were visualised using the Gel Doc EZ Imager (Bio-Rad Laboratories Inc.). All gels were stained with GelRed™ (Biotium, Hayward, CA, USA), a safe and sensitive alternative to ethidium bromide size determination in agarose gel electrophoresis. The images were processed and bands were analyzed with Image Lab Software 3.0 (Bio-Rad Laboratories Inc.) to obtain the size of the base pairs of the PCR products.
Capillary electrophoresis for fragment analysis
Each PCR product was analysed at First Base Laboratories (Selangor, Malaysia) for fragment analysis. The fluorescent PCR products were assayed by capillary electrophoresis and visually analysed using Applied Biosystem Genetic Analyzer with GeneMapper® v4.0 by Microsatellite Analysis Software.
Results
Using three random samples, we observed that LMA gel with 4% (w/v) run in 1XTBE buffer gave better separation of the bands compared to others (Figure 1). Next, gel electrophoresis was
Table 1: Primers used for PCR and microsatellite genotyping
Gene or
locus Genebank accession number
Location of
amplicon Forward primer (5’ –3’) Reverse primer (5’ –3’)
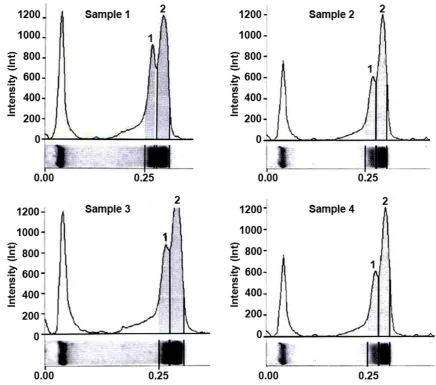
carried out to analyse sixteen PCR products using 4% (w/v) LMA. As can be seen in figure 2, the PCR products migrated between the bands of 160 bp and 200 bp. The estimation of the amplicons was based on the DNA ladders. The gel electrophoresis peak profiles for representative samples 1–4 are presented in figure 3.
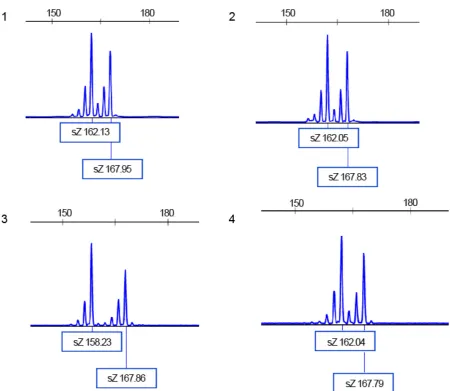
Using capillary electrophoresis, the fluorescent PCR products (as electrophoresed in figure 2) were visually analysed using Applied Biosystem Genetic Analyzer. The results indicated its potential to allelic discrimination even in case of difference between two pairs of bases between the alleles (Figure 4). This standardised method
Figure 1: PCR products and 20 bp DNA ladder run in 2%, 3%, and 4% LMA in 1x TBE at 100 V at 90 min.
Figure 3: Gel electrophoresis peak profile for sample 1–4 analysed using Gel Doc EZ Imager and Image Lab Software 3.0 (Bio-Rad Laboratories Inc.).
was reproducible and precise.
Multiple alleles have been found at the D19S884 locus. Their amplified sizes are presented in table 2. The number of CA-repetitions is based on a previous study by Urbanek et al. (2009) and summarised in table 3. Because only four samples were used as representative profiles, there were differences between observed allele size obtained by LMA gel electrophoresis and fragment analysis (Table 4).
Discussion
In this work, we employed electrophoresis and signal visualisation techniques in order to determine the reproducible and precise protocols for analysing existing polymorphism in the D19S884 of the FBN3 gene from DNA samples in peripheral blood.
We proved that the primers design in the study by Prodoehl et al. (15) worked for the PCR amplification. The primers were used instead of amplimer AFMa299zc5 as listed in Genbank (National Institute of Health genetic sequence database) (Table 3). The PCR products visualisation using the GelRed™ Gel Stain is also proven to be safer than that using ethidium bromide (16). Although the banding patterns were observed and measured using gel electrophoresis, which suggests that the banding sequence of this microsatellite (CA)n exhibits allelic dimorphism, it is still not the best technique to determine the amplicon size; therefore, the size of the CA- repeats. Therefore, fragment analysis using capillary electrophoresis is needed for more precise analysis.
Figure 4: Electropherograms for D19S884 microsatellites in sample 1–4 ( as run in gel electrophoresis in figure 3). At each peak, amplified fragment sizes are given in base pairs. Please see table 3 for allele size range; only a representative profile is shown here.
polymorphisms of microsatellite markers (17). This method requires highly sophisticated instruments and fluorescently tagged primers, which are quite expensive. The results are confirmed to be precise and reliable.
Even though there were size deviations between LMA gel electrophoresis and fragment analysis (Table 3), gel electrophoresis is highly relevant because the technique is simpler for band confirmation before proceeding to the higher-cost technique of capillary electrophoresis.
Capillary electrophoresis is an analytical technique that separates ions based on their electrophoretic mobility with the use of an applied voltage, and it gives faster results and provides high-resolution separation (18).
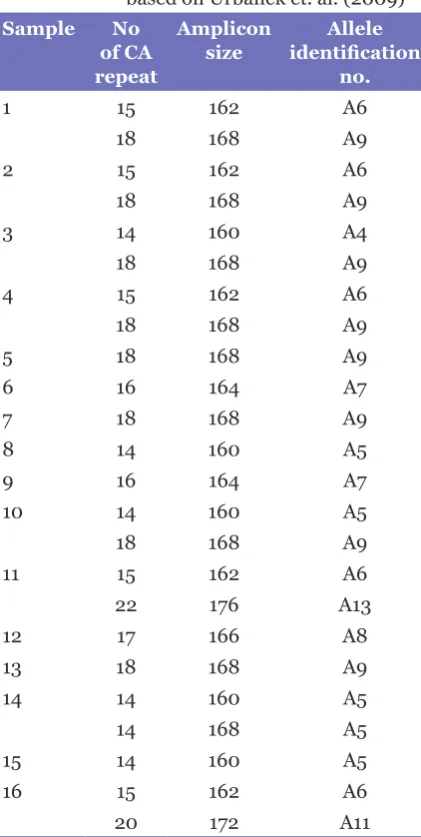
Table 2: D19S884 (CA)n microsatellite polymorphism allele detected in samples (Sample 1–16) analysed using capillary electrophoresis. (The number of CA-repeat is based on Urbanek et. al. (2009)
Sample No of CA repeat
Amplicon
size identification Allele no.
1 15 162 A6
18 168 A9
2 15 162 A6
18 168 A9
3 14 160 A4
18 168 A9
4 15 162 A6
18 168 A9
5 18 168 A9
6 16 164 A7
7 18 168 A9
8 14 160 A5
9 16 164 A7
10 14 160 A5
18 168 A9
11 15 162 A6
22 176 A13
12 17 166 A8
13 18 168 A9
14 14 160 A5
14 168 A5
15 14 160 A5
16 15 162 A6
20 172 A11
Table 3: For each allele in microsatellite D19S884, this list provides information on the sizes of the amplicons using the current primers. The numbers of CA repeats and the identification numbers of alleles are based on previous study (Urbanek et al., 2005)
Amplicon
sizes Number of CA repeats
Allele identification
no.
160 14 A5
162 15 A6
164 16 A7
166 17 A8
168 18 A9
170 19 A10
172 20 A11
174 21 A12
176 22 A13
178 23 A14
Table 4: Allele size (bp) comparison between LMA gel electrophoresis and fragment analysis. Only 4 representative samples shown here
Samples Gel
electrophoresis Fragment analysis Band
1 Band 2 Band 1 Band 2
1 191 169 168 162
2 186 167 168 163
3 193 167 168 158
4 193 174 168 162
Acknowledgement
The authors would like to thank the Director General of Health, Ministry of Health, Malaysia for supporting the work described in this paper and permission to publish this paper. We are also grateful to Assoc. Prof. Dr. Hanifullah Khan of Cyberjaya University College of Medical Sciences, for providing blood samples for this study.
Conflict of Interest
None.
Funds
This work was supported by grant from the Ministry of Health, Malaysia (Grant no. NMRR-13-206-15132; JPP-IMR: 12-042).
Authors’ Contributions
Conception and design, drafting of the article: FM Analysis and interpretation of the data: FM, LAZ, SSH
Correspondence
Dr Fazliana Mansor
BSc Hons (University Malaya), PhD (Karolinska Institute, Stockholm, Sweden)
Cardiovascular, Diabetes & Nutrition Research Centre, Institute for Medical Research
Jalan Pahang
50588 Kuala Lumpur, Malaysia Tel: +603-2616 2666
Fax: +603-2296 2856 Email: [email protected]
References
1. Moazami-Goudarzi K, Laloë D, Furet JP, Grosclaude F. Analysis of genetic relationships between 10 cattle breeds with 17 microsatellites. Anim Genet. 1997; 28(5):338–345.
2. Martín-Burriel I, García-Muro E, Zaragoza P. Genetic diversity analysis of six Spanish native cattle breeds using microsatellites. Anim Genet. 1999;30(3):177– 182.
3. Balazs I, Neuweiler J, Perlee L, Venturini J. Frequency of restriction site polymorphisms in the region surrounding VNTR loci. EXS. 1993;67:59–62.
4. Vos T, Flaxman AD, Naghavi M, Lozano R, Michaud C, Ezzati M, et al. Years lived with disability (YLDs) for 1160 sequelae of 289 diseases and injuries 1990-2010: a systematic analysis for the Global Burden of Disease Study 2010. Lancet. 2012;380(9859):2163– 2196. doi: 10.1016/S0140-6736(12)61729-2.
5. Franks S, Gharani N, Waterworth D, Batty S, White D, Williamson R, et al. The genetic basis of polycystic ovary syndrome. Hum Reprod. 1997;12(12):2641– 2648.
6. Franks S, McCarthy M. Genetics of ovarian disorders: polycystic ovary syndrome. Rev Endocr Metab Disord. 2004;5(1):69–76.
7. Nam Menke M, Strauss JF. Genetics of polycystic ovarian syndrome. Clin Obstet Gynecol. 2007; 50(1):188–204.
8. Urbanek M. The genetics of the polycystic ovary syndrome. Nat Clin Pract Endocrinol Metab. 2007; 3(2):103–111.
9. Urbanek M, Legro RS, Driscoll DA, Azziz R, Ehrmann DA, Norman RJ, et al. Thirty-seven candidate genes for polycystic ovary syndrome: strongest evidence for linkage is with follistatin. Proc Natl Acad Sci USA.
1999;96(15):8573–8578.
10. Ewens KG, Stewart DR, Ankener W, Urbanek M, McAllister JM, Chen C, et al. Family-based analysis of candidate genes for polycystic ovary syndrome. J Clin Endocrinol Metab. 2010;95(5):2306–2315. doi: 10.1210/jc.2009-2703.
11. Rahman M, Malik T, Aslam N, Asif M, Ahmad R, Khan I, et al. Optimization of PCR conditions to amplify microsatellite loci in cotton Gossypium hirsutum L. genomic DNA. Intern J Agriculture Biol.
2002;4(2):282–284.
12. Nellemann LJ, Frederiksen J, Morling N. PCR typing of DNA fragments of the two short tandem repeat (STR) systems upstream of the human myelin basic protein (MBP) gene in Danes and Greenland Eskimos.
Forensic Sci Int. 1996;78(2):139–156.
13. Inazuka M, Wenz HM, Sakabe M, Tahira T, Hayashi K. A streamlined mutation detection system: multicolor post-PCR fluorescence labeling and single-strand conformational polymorphism analysis by capillary electrophoresis. Genome Res. 1997;7(11):1094–1103.
14. Renshaw MA, Giresi M, Adams JO. Microsatellite fragment analysis using the ABI PRISM ® 377 DNA sequencer. Methods Mol Biol. 2013;1006:181–196. doi: 10.1007/978-1-62703-389-3_13.
15. Prodoehl MJ, Hatzirodos N, Irving-Rodgers HF, Zhao ZZ, Painter JN, Hickey TE, et al. Genetic and gene expression analyses of the polycystic ovary syndrome candidate gene fibrillin-3 and other fibrillin family members in human ovaries. Mol Hum Reprod.
2009;15(12):829–841. doi: 10.1093/molehr/gap072.
16. Huang Q, Baum L, Fu W-L. Simple and practical staining of DNA with GelRed in agarose gel electrophoresis. Clin Lab. 2010;56(3-4):149–152.
17. Marino MA, Turni LA, Del Rio SA, Williams PE, Cregan PB. The analysis of simple sequence repeat DNA in soybean by Capillary Gel Electrophoresis.
Appl Theor Electrophor. 1995;5(1):1–5.