http://www.sciencepublishinggroup.com/j/ijmea doi: 10.11648/j.ijmea.20180602.12
ISSN: 2330-023X (Print); ISSN: 2330-0248 (Online)
An Improved Radar-Graph Method for Comprehensive
Evaluation of Material Machinability
Tao Sun
1, 2, *, Jin Liang
1, Dengwan Li
2, Huizhong Wang
2, Xinxing Li
21
State Key Laboratory for Manufacturing Systems Engineering, School of Mechanical Engineering, Xi’an Jiaotong University, Xi’an, China
2
Sichuan Province Engineering Laboratory for Superalloy Cutting Technology, Sichuan Engineering Technical College, Deyang, China
Email address:
*
Corresponding author
To cite this article:
Tao Sun, Jin Liang, Dengwan Li, Huizhong Wang, Xinxing Li. An Improved Radar-Graph Method for Comprehensive Evaluation of Material Machinability. International Journal of Mechanical Engineering and Applications. Vol. 6, No. 2, 2018, pp. 23-28.
doi: 10.11648/j.ijmea.20180602.12
Received: March 25, 2018; Accepted: April 18, 2018; Published: May 11, 2018
Abstract: Material machinability evaluation is the basis of a reasonable manufacturing process. Material machinability can be
evaluated qualitatively and quantitatively using the radar-graph method. However, two key questions remain unresolved, and these are indicator weight confirmation and effective evaluation. A comprehensive evaluation method is proposed to address the first question. A statistical method is used to compute the indicator weight, which is determined by a subjective or objective weighting method. An optimization model is established based on minimizing the total deviation between the original evaluation weight and the combination weight. As to the second question, a comprehensive evaluation index K, including the area vector and perimeter vector of a radar-graph, is defined to quantitatively evaluate material machinability. Machinability examples of Ti6Al4V titanium alloy, AISI316L stainless steel, P20 mold steel, 20 steel, and normalized 45 steel are provided. The results show that the method is feasible, reliable, and effective.Keywords: Radar-Graph, Machinability, Combination Weighting, Comprehensive Evaluation, Statistics
1. Introduction
With advances in science and technology and economic progress, many new metal materials have been introduced. Material machinability should be known before determining a manufacturing process. In short, material machinability determines the degree of difficulty in machining. There are three methods to evaluate material machinability. These are the single indicator evaluation method, relative machinability classification method, and comprehensive evaluation method. The single indicator evaluation method determines material machinability using one indicator. This method is too simple to give a comprehensive and effective evaluation of material machinability. The relative machinability classification method determines material machinability by comparing a material’s machinability with that of a reference material, which is generally specified as normalized 45 steel [1]. This method is used widely for its simplicity, and it can reflect the
complete picture of a material’s machinability, but it is not good at reflecting the correlation between the overall machinability with each indicator.
Radar-graphs were first applied to evaluate material machinability by Professor Jan-Eric in 2007 [12]. In 2010, the teams of Professor Liu [13] and Dr. Xu [14], cooperating with Professor Jan-Eric, were first to employ radar-graphs to evaluate material machinability in China. Different indicator systems of material machinability were proposed by the two teams, and varied data-processing methods and examples were given [9, 13, 14, 15]. Professor Liu’s team used the subjective weighting method to determine an indicator weight, which can reflect the intention of decision-makers, but did not account for interrelations of indicators. A composite evaluation index Y was defined,but the Y value changed with various orders of the indicator’s geometric ray axes in the radar-graph [9, 13]. Dr. Xu’s team extensively analyzed the influence of the indicator on material machinability, but the indicators’ weights were not given. They used a radar-graph to evaluate material machinability qualitatively, but not quantitatively [14, 15].
To overcome the shortcomings of the radar-graph, a weighting method combining subjective and objective weighting was proposed, based on statistical principles. The drawing method of the radar-graph was improved, and a comprehensive evaluation index K was defined to evaluate material machinability more effectively.
2. Materials and Method
2.1. Evaluating Indicator Determination
Material machinability depends on cutting conditions as well as chemical components, structure, property, and status of the material itself. When considering cutting conditions, many costly experiments and a long testing cycle are required. Furthermore, the determination of cutting conditions lies in the material itself. Therefore, the evaluation of material machinability only focuses on the material. The chemical components are one of the basic factors that affect the material properties. With the same chemical components, the material’s micro-structure varies with different heat treatments and forming processes, leading to a change of the material’s physical and mechanical properties.
In fact, a material’s physical and mechanical properties are the primary factors affecting material machinability during the cutting process, and the change of these properties depends on the chemical components and metallurgical structure of the material. Among physical and mechanical property
parameters, hardness, tensile strength σb , elongation
δ
, impact toughness ak, and thermal conductivity κ are the most significant and widely used indicators affecting material machinability. The testing methods of these material physical and mechanical properties are standard, and they have a low cost and small error. In full consideration, the above five indicators are taken as the evaluating indicators of material machinability.2.2. Experimental Method
Ti6Al4V titanium alloy, AISI316L stainless steel, P20 mold steel, 20 steel, and normalized 45 steel were taken as the target materials to evaluate machinability using a comprehensive method. The tensile strength σb and the elongation
δ
were tested through tensile tests based on the digital image correlation method [16]. The thermal conductivity κ was tested by the TC3000 heat conduction coefficient instrument developed by Xi’an Xiaxi Electronic Technology Co., Ltd., based on the transient hot-wire method [17]. Vickers hardness was employed due to its sensitivity. The impact toughness ak was tested through the Charpy notch impact test. All tests complied with the relevant international or Chinese standards. The experimental data are listed in Table 2.2.3. Standardization and Normalization of Experimental Data
If the material machinability improves when an indicator’s value increases, the indicator is defined as a helpful indicator. Otherwise, the indicator is defined as a useless indicator. Therefore, κ is called a helpful indicator, and hardness, σb,
δ
, and ak are regarded as useless indicators.The indicator value, its maximum value, and its minimum value are expressed as x, xmax, and xmin, respectively. The standardization formula is
min
max min x x x
x x
− =
− (1)
where x is the standardized value of the indicator. It is important to note that the extreme value in material machinability scales [1] would be taken as xmaxand xmin of hardness, σb,
δ
, ak, and κ, as shown in Table 1.Table 1. Extreme values of hardness, tensile strength, elongation, impact toughness, and thermal conductivity in material machinability scales.
Performance
indicators Vickers hardness
Tensile strength
b
σσσσ /MPa
Elongation
δδδδ /%
Impact toughness
k
a /kJ.m-2 Thermal conductivity κ
/W.m-1.K-1
max
x 676 2450 100 3920 293.08
min
x 83 0 0 0 0
The standardized value x should be normalized [13]. For a helpful indicator, the normalization equation is
1 x
y= −e− (2)
where y is the normalized value after transformation. For a useless indicator, the normalization equation is
x
The hardness, σb ,
δ
, ak , and κ of the above five materials after standardization and normalization are listed inTable 2.
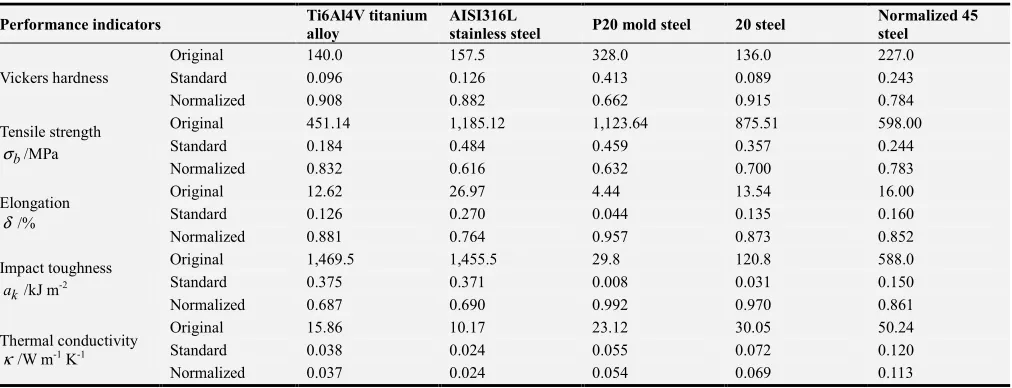
Table 2. Original, standard, and normalized values of material machinability experiments.
Performance indicators Ti6Al4V titanium alloy
AISI316L
stainless steel P20 mold steel 20 steel
Normalized 45 steel
Vickers hardness
Original 140.0 157.5 328.0 136.0 227.0
Standard 0.096 0.126 0.413 0.089 0.243
Normalized 0.908 0.882 0.662 0.915 0.784
Tensile strength
b
σ /MPa
Original 451.14 1,185.12 1,123.64 875.51 598.00
Standard 0.184 0.484 0.459 0.357 0.244
Normalized 0.832 0.616 0.632 0.700 0.783
Elongation
δ/%
Original 12.62 26.97 4.44 13.54 16.00
Standard 0.126 0.270 0.044 0.135 0.160
Normalized 0.881 0.764 0.957 0.873 0.852
Impact toughness
k
a /kJ m-2
Original 1,469.5 1,455.5 29.8 120.8 588.0
Standard 0.375 0.371 0.008 0.031 0.150
Normalized 0.687 0.690 0.992 0.970 0.861
Thermal conductivity
κ/W m-1 K-1
Original 15.86 10.17 23.12 30.05 50.24
Standard 0.038 0.024 0.055 0.072 0.120
Normalized 0.037 0.024 0.054 0.069 0.113
3. Combination Weighting of Evaluating
Indicator
The weight determination of indicators is the key to evaluating material machinability using the radar-graph method. Weighting methods can be classified as either subjective or objective. The commonly used subjective weighting method includes a superiority chart, analytic hierarchy process, expert scoring, etc., while the objective weighting method includes principal component analysis, the entropy method, the correlation coefficient, etc. [18]. The subjective weighting method carries out the intention of decision-makers, but neglects the interrelations of the indicators, so the dynamic features of the indicators are not present. The objective weighting method can reflect the differences of indicators, but it neglects the subjectivity of decision-makers based on practical experience, and the computing process is relatively complex, so the weight may not fulfill specific needs. A weighting method combining the subjective and objective may be the better choice.
Assume an n m× matrix is a comprehensive evaluation matrix of material machinability, where n is the number of evaluating indicators, and m is the number of samples. The principle of the combination weighting method is to assign p objective weights and q subjective weights to the indicator; obtain the subjective weight vectors
ω ω
1, 2,⋯,ω
q and objective weight vectorsω
q+1,ω
q+2,⋯,ω
q p+ , where the kth weight vector ωk =(ω ωk1, k2,⋯,ωkn) meets the condition1
1
n
ki i
ω
=
=
∑
(k=1, 2,⋯, )l ; and optimize the combinationweight vectors based on statistical principles.
3.1. Preprocessing of Weight Vector
Suppose the subjective weight vectors
ω ω
1, 2,⋯,ω
q are samples of uniformly distributed random variables. The variance S( )ω and expectation E( )ω are taken as the vector feature, they are normalized based on statistical principles, and the subjective weight vector u can be obtained. The formula is2
2 2
1 ( ) [ ( ) ] ( ) ( )
2 2 2
q
k k
k k k k
q
E S E
u
ω
ω + ω ω =
= = =
∑
(4)
where qk =1q is the probability of the kth subjective weight vector. Using the same method, the probability of the
th
i objective weight vector v can be obtained as pi =1 p.
3.2. Computation of Weight Vector
Suppose the probabilities of the subjective weight vector u and the objective weight vector v are a and b , respectively. The combination weight vector Q can be obtained using the statistical method, and the weight vector
0
ω can be obtained after normalization. The formulas are
2 2
0
1
2
n
i i
au bv Q
Q
Q
ω
=
+
=
=
∑
(5)
total deviation between original evaluating weights and combination weights, the model is built as follows:
{
}
2{
}
22 2 2 2
1 1 1 1
min [ [ ( ) ( ) ] / 2 ] [ [ ( ) ( ) ] / 2 ]
1 0 0
n m n m
i i i ij i i i ij
i j i j
F u a u b v X v a u b v X
a b a b
= = = =
= − + + − +
+ =
≥
≥
∑∑
∑∑
(6)
where a and b are the probabilities of the subjective and objective weight vectors, respectively, and Xij is the
normalized matrix corresponding to the ith indicator of the
th
j sample.
The optimal model is transformed into a problem of extreme value, with the Lagrange function built as follows:
{
} {
2}
22 2 2 2
1 1
( , , ) [ [ ( ) ( ) ] / 2 ] [ [ ( ) ( ) ] / 2 ] ( 1)
n m
i i i ij i i i ij
i j
L a bλ u a u b v X v a u b v X λ a b
= =
= − + + − + + + −
∑∑
(7)The requirement of the solution is
0
L L L
a b λ
∂ =∂ = ∂ =
∂ ∂ ∂ (8)
The derivation process is omitted. The partial differential Equation (7) can be solved using appropriate software, a and b can be determined, and the optimal weight vector ω0 can be obtained through Eq. (5).
We have borrowed the subjective weight vector
[0.3,0.25,0.15,0.15,0.15]T
u= and objective weight vector
[0.160,0.131,0.358,0.131,0.219]T
v= from literature [19]. By the above method, the probabilities are a=0.51835 and
0.48165
b= , and the weight vector is
0 [0.233,0.193,0.260,0.135,0.179] T
ω
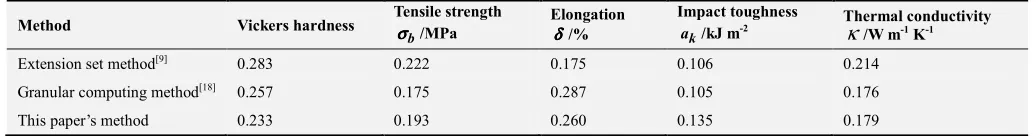
= . The results of this paper’s method and other methods are listed in Table 3.Table 3. Comparison of weights by different weighting methods.
Method Vickers hardness Tensile strength b
σσσσ /MPa
Elongation
δδδδ/%
Impact toughness
k
a /kJ m-2 Thermal conductivity κ
/W m-1 K-1
Extension set method[9] 0.283 0.222 0.175 0.106 0.214
Granular computing method[18] 0.257 0.175 0.287 0.105 0.176
This paper’s method 0.233 0.193 0.260 0.135 0.179
As known in Table 3, the rankings of the combination weights in this paper are compatible with other methods. Compared to the extension set method and granular computing method, the complexity of the computing process in this paper is relatively low, and the deviation is smaller, so the features of the subjective and objective weighting methods are both exploited.
4. Drawing and Evaluation of
Radar-Graph
4.1. Drawing Method of Radar-Graph
The followings are the steps in drawing the radar-graph. Step 1: According to the final combination weight vector
0 ( 1, 2,⋯, 5)T
w = w w w , the sector region of each indicator in radar-graph is allocated, and the sector region angle of the ith
indicator is θi=2ω πi .
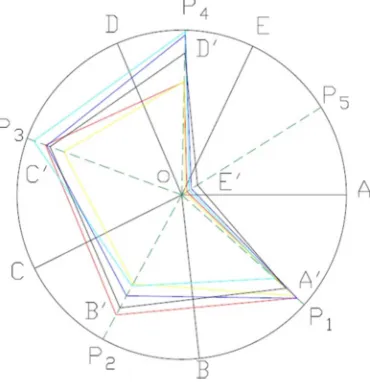
Step 2: Draw a unit circle and a geometric ray OA from the center O intersecting the unit circle at point A. Starting from
the line OA, draw the other four geometric rays, OB, OC, OD, and OE, successively at angles of θi =2ω πi . Then draw the diagonals of the sector regions including AOB, BOC, COD, DOE, and EOA in turn, intersecting the unit circle at points P1, P2, P3, P4, and P5. The geometric rays OP1, OP2, OP3, OP4, and OP5 are specified as the indicator axes.
Step 3: Plot the corresponding points of each indicator's matrix X on the indicator axes in turn. These points are A', B', C', D', and E'. Connect the five points to obtain the polygon radar-graphs. The radar-graphs are depicted in different colors in Figure 1. Red, yellow, cyan, blue, and black lines correspond to Ti6Al4V titanium alloy, AISI316L stainless steel, P20 mold steel, 20 steel, and normalized 45 steel, respectively.
Figure 1. Radar-graph of material machinability in comprehensive evaluation method. (Color online only.)
4.2. Evaluation of Radar-Graph
The radar-graph is evaluated based on the principles of area and roundness. The area is closely connected with the material machinability, and the roundness can represent the developmental balance of each indicator. According to the pattern of the radar-graph, the status of each indicator and its machinability can be analyzed directly. To analyze the material machinability quantitatively, the comprehensive evaluation index is defined as
c c SL K
S L
= (9)
where S is the corresponding polygon area of the radar-graph, L is the quadratic sum of the polygon edges,
c
S is the area of the unit circle, and Lc is the perimeter square of the unit circle. The K values of the five materials were computed using Eq. (9) and are listed in Table 4.
Table 4. Comprehensive evaluation of material machinability.
Indicator Ti6Al4V titanium alloy AISI316L stainless steel P20 mold steel 20 steel Normalized 45 steel
Area vector S 0.2591 0.4691 0.6020 0.6289 0.5613
Perimetervector L 4.7412 4.3286 3.9103 5.0051 4.7115
Comprehensive
evaluation index K 0.2494 0.3208 0.3454 0.3994 0.3661
Relative machinability
index Kr[9] 0.25~0.38 0.5~0.6 0.5~0.65 2.5~3 1~1.6
Along with K , the relative machinability index Kr associated with the relative machinability classification method is listed in Table 4. It is important to note that the ranges of Kr overlap between AISI316L stainless steel and P20 mold steel. This is because we could only obtain the ranges of Kr for the same kinds of material and not for special brands of material in literature [20]. Based on K and
r
K , the machinability rankings of these five materials both have the relationship 20 steel > normalized 45 steel > P20 mold steel > AISI316L stainless steel > Ti6Al4V titanium alloy. The results imply that K can effectively distinguish material machinability. Moreover, Kr has a concise definition and is easy to use, but many costly cutting experiments and a long testing cycle are required. While Kis derived from the feature vector of the radar-graph and the feature vectors are connected with the material’s physical and mechanical property parameters, which are easily obtained. The combination of K and the radar-graph enable both qualitative and quantitative evaluation of material machinability.
5. Conclusions
1. To solve the problem of indicator weight confirmation when using a radar-graph, a combination weighting method was proposed based on statistical principles. The weights of
hardness, σb,
δ
, ak, and κ were computed, with values of 0.233, 0.193, 0.260, 0.135, and 0.179, respectively. The results were generally compatible with other methods, and the computation was simpler.2. The drawing method of the radar-graph was improved to solve the problem that the change of feature vector varied with the order of the evaluating indicator, and a comprehensive evaluation index K, including the feature vector of the area and perimeter, was defined. The material machinability rankings of the five materials according to the parameters K and Kr were presented, which showed that Kcan evaluate the material machinability effectively and quantitatively, and the experiment cost was lower than that of Kr.
3. According to the radar-graph and comprehensive evaluation indexK, the material machinability ranking of the five materials is 20 steel > normalized 45 steel > P20 mold steel > AISI316L stainless steel > Ti6Al4V titanium alloy.
Acknowledgements
References
[1] Wu, Y. D. and Y. P. Zhang. Metal Cutting and Tool, 1st Ed. Beijing, China: China Machine Press, 2016, 66-69.
[2] Grzesik, W. Advanced Machining Processes of Metallic Materials, 2nd Ed. ELSEVIER, 2017, 241-264.
[3] Segreto, T., A. Caggiano and R. Teti (2015). Neuro-fuzzy System Implementation in Multiple Sensor Monitoring for Ni-Ti Alloy Machinability Evaluation. Procedia CIRP 37, 193-198.
[4] Henzinger, M., S. Krinninger and D. Nanongkai (2016). Improved Algorithms for Decremental Single-Source Reachability on Directed Graphs. Lecture Notes in Computer Science 9134(7), 725-736.
[5] Rao, R. V. and D. Singh (2016). An Improved Grey Relational Analysis as a Decision-Making Method for Manufacturing Situations. International Journal of Decision Sciences Risk & Management, 2(1/2), 1-23.
[6] Tavana, M., M. A. Kaviani, D. D. Caprio and B. Rahpeyma (2016). A Two-Stage Data Envelopment Analysis Model for Measuring Performance in Three-Level Supply Chains. Measurement, 78, 322-333.
[7] Dey, S. and S. Chakraborty (2016). A Study on The Machinability of Some Metal Alloys Using Grey Topsis Method. Decision Science Letters 5(1), 31-44.
[8] Deli, I. and Y. Şubaş (2017). A Ranking Method of Single Valued Neutrosophic Numbers and Its Applications to Multi-Attribute Decision Making Problems. International Journal of Machine Learning & Cybernetics, 8(4), 1309-1322. [9] Wan, Y., K. Cheng, Z. Q. Liu and H. T. Ye (2013). An
Investigation on Machinability Assessment of Difficult-to-cut Materials based on Radar-Graphs. Proceedings of the Institution of Mechanical Engineers Part B Journal of Engineering Manufacture 227(12), 1916-1920.
[10] Fan, C. Q., X. T. Tian and S. N. Liu (2011). Evaluation of Material Machinability based Extension Set. Modern Manufacturing Engineering 1, 67-69.
[11] Golwala, H. and R. Chudamani (2016). New Three-Dimensional Space Vector-Based Switching Signal Generation Technique Without Null Vectors and With Reduced Switching Losses for a Grid-Connected Four-Leg Inverter. IEEE Transactions on Power Electronics, 31(2), 1026-1035. [12] J. E. Ståhl and M. Andersson, “Polar machinability diagrams- a
model to predict the machinability of a work material,” Swedish Production Symposium, Göteborg, Sweden, 2007. [13] Du, J. and Z. Q. Liu (2010). Evaluation of Material
Machinability based on Radar-Graph Method. Tool Engineering 44(7), 3-6.
[14] Xu, L. H., Z. F. Jiang and J. E. Ståhl (2010). Machinability Prediction of Workpiece Material with a Diagraph Method. Advanced Materials Research 97-101, 2072-2075.
[15] Xu, L. H., F. Schultheiss, M. Andersson and J. E. Ståhl (2013). General Conception of Polar Diagrams for the Evaluation of the Potential Machinability of Workpiece Materials. International Journal of Machining & Machinability of Materials 1, 24-44.
[16] Ayatollahi, M. R. and M. Moazzami (2017). Digital Image Correlation Method for Calculating Coefficients of Williams Expansion in Compact Tension Specimen. Optics & Lasers in Engineering, 90, 26-33.
[17] Kang, C., Y. H. Park, J. T. V. Lew, A. Ying, M. Abdou and S. Cho (2017). Transient Hot-Wire Experimental System for Measuring the Effective Thermal Conductivity of a Ceramic Breeder Pebble Bed. Fusion Science & Technology, 72(1), 1-8. [18] F. Zhang, D. Li, B. Geng and Z. Liu, “Study on comprehensive weighting method based on subjective and objective weights,” International Conference on Logistics Engineering, Management and Computer Science, pp. 737-741, 2014. [19] Zhou, D. C. (2014). Material Similarity Algorithm for Process
Cases Retrieval based on Granular Computing. Journal of Mechanical Engineering 50(13), 170-177.