*Corresponding author’s e-mail: [email protected] https://doi.org/10.32802/asmscj.2019.212
Application of 3D GIS Flood Simulation to
Investigate the Source of Inundation at Pekan
Sub-District
Muhammad Shaheed S.1*, Zuhairi A.1, Ranjit S.1
1Kulliyyah of Science, International Islamic University Malaysia, Jalan Sultan Ahmad Shah,
Bandar Indera Mahkota, 25200 Kuantan, Pahang, Malaysia
Flood is usually caused by heavy precipitation that eventually lead to river spillage. In some rare cases, inundation could happen due to the accumulation of water on land cover resulting in stagnant flooding. Pekan sub-district is chosen as the ideal study area to determine the type of flood in this location. Using Geographic Information System (GIS) approach, 3-Dimensional inundation simulation procedure is applied to discover the real source of flooding at the study area. This study is performed to observe flood pattern over the study area based on the river surface level readings of nearby Department of Irrigation and Drainage Malaysia (DID) station. Flood simulation used SRTM (Shuttle Radar Topographic Mission) dataset to produce Pekan sub-district topography into 3D TIN (triangulated irregular network) model. Additionally, water body layer represents specific Pahang River gauge level offsets for overland inundation and river expansion inspection. Historical datasets of Pahang River hydrograph at station 3434401 published by DID were used to find the peak level. Results from inundation model instances show that very few overtopping incidences observed along Pahang River within the study boundary. Still, signs of the growing number of water spots on land cover positively indicate that inundation is again happening. This situation concludes that Pekan sub-district flood occurrences are caused by stagnant flooding. Justification is done through photographic evidence and historical DID hydrograph datasets of the year 2007 to the 1st quarter of 2018.
Keywords: SRTM; TIN model; 3D flood simulation; DID hydrograph
I. INTRODUCTION
Flood issues have been causing troubles to the people that reside near to the river areas. The situation is normal because civilization has been growing mostly in the floodplain zone, where inundation happened as part of the water cycle course. The communities are aware of this threat, and thus, numerous flood mitigation efforts are analyzed and performed. Structural/engineering approach is known to be the sole solution to resolve flood. It was introduced previously by implementing flood control structures such as levees, dams, canals, and drainage system (NAP, 2013). In the current modern scene, holistic approach (non-structural) was introduced to make a concrete decision through precise computerized
estimation. It mostly consists of a model simulation study that is always monitored to achieve the highest efficiency while also avoiding structural failure, i.e. levee system failure in New Orleans (GL Sills, 2008; Bernhardt et al., 2011). It is only possible through the rapid advances in technology where digital devices and software are developed.
2 comprehensible at any level of education based on their creativity.
In Malaysia, heavy precipitation is the natural cause that triggers a flood. Monsoon season affects the East Coast of Peninsular Malaysia, while flash flood happens in urbanized locations. It is common that flood is described as ‘the rise of river water level that eventually overtops riverbanks and spills over land courses. When such situation happened, it becomes hazardous to the nearby residents (Baharudin et al., 2013). While in urbanized locations, flood may happen due to the accumulation of stagnant water over land areas. Pekan sub-district is chosen as a case study because flood has been happening despite being reinforced with Malaysia Flood Mitigation Program (RTB) consisting of levees structures. This paper will investigate and discuss the type of flood of the area through a 3D flood simulation study.
Simulation of the flood is based on the idea that lower ground areas will be inundated earlier before reaching higher ground locations. Thus, Pekan sub-district is presented into a 3D model. TIN processing is the most common method to create a 3D presentation of terrain surface (Sarkkila, undated). Waterbody reference plane is added together to provide environmental visualization for flood estimation. It is converted in advanced to match the vertical datum used by DID (mean sea level, MSL) to match with EGM96 (Earth Gravitational Model 1996) of DEM raster. The pattern of Pahang River expansion at Pekan sub-district and the overland inundation at each water body reference plane offsets is observed within GIS spatial analyst.
II. METHODOLOGY
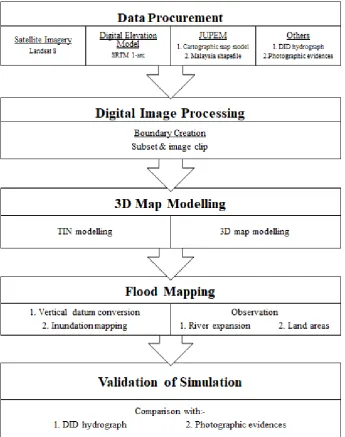
General procedures used within this study consist of remote sensing data collection, digital image processing, 3D map modelling, flood mapping, and finally results validation (Figure 1). In Malaysia, flood studies normally consist of rainfall-runoff and river discharge variables. It is because any development project should follow the design standard specified within Urban Stormwater Management Manual (MSMA).
This study wanted to allow an easier method of simulating flood and test how Pahang River at Pekan sub-district stream parameter will affect inundation across the study boundary. Producing TIN model and running the
are predicted through observation at a normal level (1.0m MSL), alert (2.44m MSL), and danger (3.66m MSL). Additional forecasts at 4.50m and 5.50m MSL are also included in case of undesirable situations were going to happen. This study used ArcGIS software components as the primary GIS software for model simulation.
A. Data Procurement
Landsat-8 (30m) is collected to provide actual visualization of Pekan sub-district. While SRTM data (1-arc) of the same accuracy is chosen to provide the topographic information focusing on Pekan sub-district. Both datasets are acquired through USGS EarthExplorer, which is commonly known as open source remotely sensed data provider. Data is collected in satellite raster TiFF format. Each of the original SRTM DEM data covers a broad area of about 225km x 225km cell size (USGS) in UTM zone 48N projection.
DID hydrograph of station 3434401 were analyzed to check Pahang River surface level anomalies. The datasets are selected by focusing more on the flood event that happened in 2007 and 2014, where Pahang River surface level reached the danger level. The most recent flood in January 2018 was also collected with the parameter reaching alert level. In addition, river hydrographs are accompanied by photographic imageries as pieces of evidence
B. Digital Image Processing
Image subset and clip is a process to produce Pekan sub-district boundary. To maintain the boundary of the study area, the Public Work Department (JUPEM) Malaysia shapefile and digital cartographic map of Pahang were used as a based model. Subsetting is done to shrink out the scope over the target area from original remote sensing datasets. Then, manual digitization is adjusted to follow the boundary line on land areas according to the cartographic map. Whereas the coastal part of Pekan sub-district is digitized by using snapping tool that referred to the JUPEM Malaysia shapefile data.
3
Figure 1. The sequence of activities/processes within this study
C. Digital TIN Processing (Terrain Modelling)
This method is used to convert SRTM raster, which contained elevation information into an infographic topographic mapping. Performing GIS processing, ArcMap can produce TIN raster directly from SRTM dataset. But the downside of this method is TIN raster result would become very coarse. As this raster might affect the inundation simulation, DEM raster is initially processed into contour raster surface to produce a smooth, refined TIN raster.
Thus, the contouring process is initially performed. Using ArcMap 3D analyst tools, a new contour feature class is created using 1.0m intervals format. After that, the contour model is used as a reference model for producing TIN
raster. A specific colour symbology schematic is also assigned onto the TIN model to provide visual assistance in discerning the topographic condition across Pekan sub-district boundary.
D. Inundation Mapping
1. Vertical Datum Conversion
4 directly requested from JUPEM authorities at the point
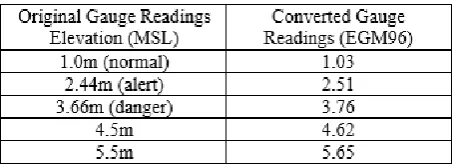
Figure 2. DID reference flood warning sign of station 3434401
Figure 3. Converted mean sea level (MSL) vertical elevation to suit the working environment of SRTM datasets projection (Shaheed S., 2018)
2. Vertical Inundation Mapping
Using the TIN raster, topographic information is assigned with original SRTM database height. Inundation simulation is done by using a dummy water body layer/plane created based on the polygon boundary shapefile and assigned with light blue colour. Inundation pattern is simulated using the converted local DID gauge reading parameters as referenced elevation offset settings. Observation of spillage from river expansion and flood pattern over land areas of Pekan sub-district can finally be discovered (Shaheed S. & Zuhairi A., 2016; 2017).
E. Inundation River expansion determination & overland (land cover) inundation observation
Third party graphics software does river expansion demarcation process. 3D flood simulation assigned plane offsets is converted into 2D layer files. At each inundation simulation instances, Pahang river visual expansion is digitized by sorting out land cover area from the river water body. Each digitized linings are assigned with a unique colour code. Then, all digitized linings that symbolize each simulation instances are merged into one master file. Afterwards, the stacked demarcations lines are put together with Pekan sub-district TIN raster (Figure 4)
and Landsat-8 imagery (Figure 7) to show specific spatial pattern changes of how Pahang River expands.
Applying the same method of simulation, observation is continued to determine inundation pattern caused by the accumulation of stagnant water across the land area of Pekan sub-district.
III. RESULTS
Combining both TIN model and water body plane, simulation at each gauge reading offsets projection provide visual information of inundation pattern at the areas residing beside riverbanks as well as across the boundary of Pekan sub-district. Waterbody plane that is assigned in blue colour indicates Pahang River spreading pattern changes from its normal state.
A. Observation: Pahang River Expansion
5
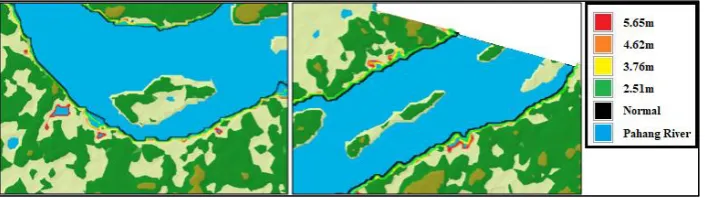
Figure 4. Observation on the river expansion at each offsets setting
Figure 5. Observation on more focused parts of Pahang River
B. Observation: Pahang River Expansion
TIN model that is infused with SRTM base height produced a 3D model restricted within the boundary of Pekan sub-district. Colour ramp symbology is assigned with red parts to represent high terrain zones while greener colour specified lower ground zones. At 2.44m MSL (warning level), very little sign of inundation is on sight. While at 3.66m MSL (danger level), accumulation
6
7
IV. DISCUSSION
Separate observation of inundation was done to satisfy the objective of this study. In the Pahang River expansion
observation, demarcation lines that yield from the 3D simulation follow the right and logical expanding pattern sequence. The relativity between land topography with river surface level is justified.
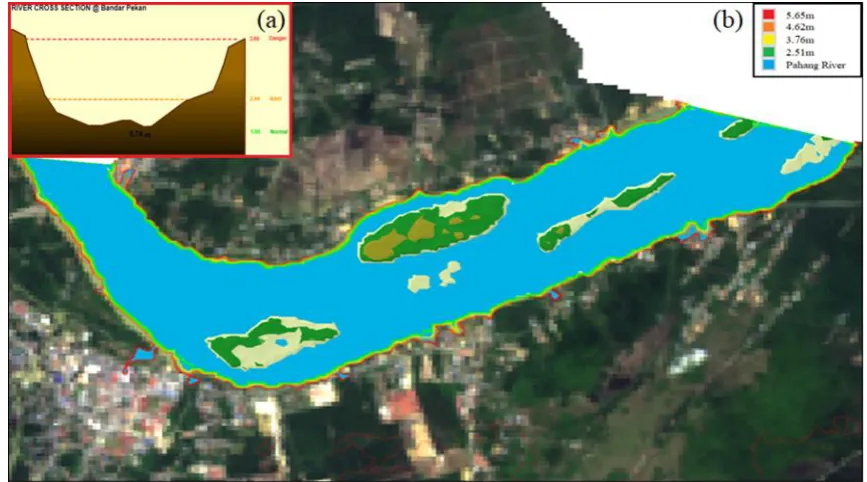
Figure 7. DID river-cross-section model of station 3434401 (a); comparing river expansion with the Landsat-8 map of Pekan sub-district to see the effect over land areas (b)
Overlapping the river pattern results with Pekan sub-district Landsat-8 raster, the simulation shows no distinguished visual evidence that riverside settlements are profoundly affected by river flooding, especially at Pekan town. Referring to DID river cross-section model (Figure 7, a), Pahang River is at its peak level in which river surface is
8
Figure8. Comparison with historical DID hydrograph and photographic pieces of evidence
Simulation data that only focus on river expansion patterns are found contrary to Pekan sub-district historical flood records. This is because factual evidence can be found through previous studies/articles, news, and web reports, especially during the yearly monsoon season. Traces of inundation at the riverside settlements are also proven by photographic pieces of evidence of flooding in 2007 and 2014. In Figure 8, photographic pieces of evidence of inundation at Pekan town are paired together with river surface level data provided by
9
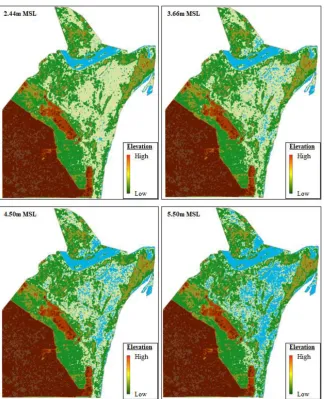
Figure9. Comparison with simulation over land covers at 3.66m MSL (a); 4.50m MSL (b); 5.50m MSL (c)
Additional checking is done through correlation with inundation simulation that also includes the nearby land cover. It shows a more realistic result that describes what might happen when river surface level progress over danger level and further. In Figure 9 within circled parts, many spots of water accumulation were sighted. The size grew larger in parallel with the progressing of simulation offsets. Thus, flood observation through 3D simulation has offered accurate results recognized through the relation with discussed pieces of evidence. Stagnant flooding is determined to be the leading cause of inundation across Pekan sub-district.
V. CONCLUSION
RTB (levee systems) projects are one of the flood mitigation plan introduced by the Malaysian government. Each of them costs millions of ringgit, which is very straining to the economy. Although the mission is to protect the locals and human activities of one area, the real caused of flood has to be thoroughly reviewed as part of good risk management practice.
This study assumed that river expansion would not be the cause of inundation but stagnant water. This can be considered as a safe assumption because pieces of evidence of river spillage are undiscoverable/ unreported. Although flood is widely termed as river that overtops the land areas, other causes got less attention. The natural soil structure of the area can highly influence the water infiltration ability. As an example, a dense soil structure will hinder rainfall water from seeping into the ground. Also, flood hazard in Pekan sub-district may be related to urban flooding. Hollis (1975) reported in his paper that increased paving (e.g., cement, bricks, and concrete cover) at river basins due to urbanization correlates with the recurrence interval of the flood. The issues are worsened by the inappropriate land use, improper management of urban activities, and
drainage related issues (Mohit & Sellu, 2013). Current water table of Pahang sub-district should also be discussed considering that flood can be induced by the buildup of underground water (Mukherjee et al., 2016).
10 [1] Bernhardt, M, et al. 2011, ‘Mississippi River Levee
Failures: June 2008 Flood’, International Journal
of Geoengineering Case Histories, vol. 2, no. 2,
pp.127-162.
[2]Baharudin, Y, et al. 2013, ‘Impacts of climate
change on flood risk in the Muar river basin of
Malaysia’, Disaster Advances, vol. 6, no. 10, pp.
11-17.
[3]Hollis, GE 1975, ‘The effects of urbanization on
floods of different recurrence intervals’, Water
Resources Research, vol. 11, no. 3, pp. 431-435.
[4]Jouni Sarkkila undated, Digital terrain modelling
for flood analysis and impact assessment in
emergency action planning,
<http://www.syke.fi/download/noname/%7B0
01BF485-EE5F-4E28-882F-CB7E17A4A142%7D/77228>.
[5]Mohit, M, et al. 2013, ‘Mitigation of climate change
effects through non-structural flood disaster
management in Pekan Town, Malaysia’, Procedia -
Social and Behavioral Sciences, vol. 85, pp.
564-573.
[6]Mukherjee, et al. 2016, ‘Effect of urbanization on
flood – a review with recent flood in Chennai
(INDIA)’, International Journal of Engineering
Sciences & Research Technology (IJERST), vol. 5,
no. 7, pp. 451-455.
[7]The National Academy Press 2013, Implementing
flood risk management strategies, Levees and the
National Flood Insurance Program: Improving
Policies and Practices, vol. 6, pp. 97-126.
[8]Shaheed, S & Zuhairi, A 2016, 3-Dimensional flood inundation model of Pekan sub-district, Pahang
using GIS, Oceanography and Sustainable Marine
Production (ICOSMAP), p. 15.
[9]Shaheed, S & Zuhairi, A 2018, ‘Emphasizing grid
feature as flood zonal identification to support
flood relief mechanism’, International Journal of Engineering & Technology, vol.7, no. 2.29, pp.
905-908.
[10] Shaheed, S 2018, ‘Flood Inundation Modelling
Using GIS Spatial Analyst; Case Study of Pekan
Sub-district, Pahang’, Master thesis, International
Islamic University Malaysia, Kuantan, Pahang.
[11] Sills, GL, et al. 2008, ‘Overview of New Orleans
levee failures: lessons learned and their impact on
national level design and assessment’, Journal of
Geotechnical and Geoenvironmental Engineering,