Optimal Operation of a DWC by Self-Optimizing Control:
Active Vapor Split Approach
Arjomand, Alireza*+
Faculty of Chemical and Materials Engineering, Shahrood University of Technology, Shahrood, I.R. IRAN
ABSTRACT: Dividing Wall Column(DWC) offers the large potential for operating and capital cost saving in compared with conventional distillation sequence. In the studied DWC in this study, the aid of Vmin diagrams, it is shown that without a suitable value for vapor split fraction bellow the dividing wall in different operating conditions, the energy requirement increases from optimal value and it will lead to the suboptimal operation. Accordingly, a control structure based on the self-optimizing concept is designed using vapor split fraction as the control degree of freedom (active vapor split). To find the best self-optimizing Controlled Variables (CV) the exact local method is used. It is shown that the value of loss with the aid of active vapor split is lower than 0.7 percent of nominal value with using the conventional single measurement self-optimizing CV, which is reasonably small value, and using a more complex combination of measurement as a self-optimizing CV provides a little enhancement in reducing the loss. So, including vapor split fraction in the self-optimizing control structure of the DWC can save energy and in the meantime avoid the complexity of combination of measurement. Moreover, the dynamic simulation studies show that the proposed control structure with the simple decentralized control loops can conveniently stabilize the plant and reject the effects of disturbances.
KEYWORDS: Active vapor split; Dividing-wall column; Optimal operation; Self-optimizing control; Vmin diagram.
INTRODUCTION
Distillation is one of the dominant methods of separation in the chemical engineering industry and, by now, nearly 40 000 distillation columns are in operation [1]. Despite the popularity of the distillation towers, they are separation technology with high energy consumption. In fact, distillation towers are one of the biggest energy consuming unit operation in chemical engineering processes [2]. Therefore a lot of studies have been done in the improvement of energy efficiency of distillation towers [3].
Achievements in modeling, computational power, and advanced numerical methods have made major progress in the process intensification. Dividing Wall Columns (DWCs) are the only large scale process intensification example where capital and operating costs are reduced simultaneously [4] and in some cases are the most economically attractive chemical separation systems[5]. DWC concept has been first introduced in a patent in 1949 [6] and the first industrial application of DWC
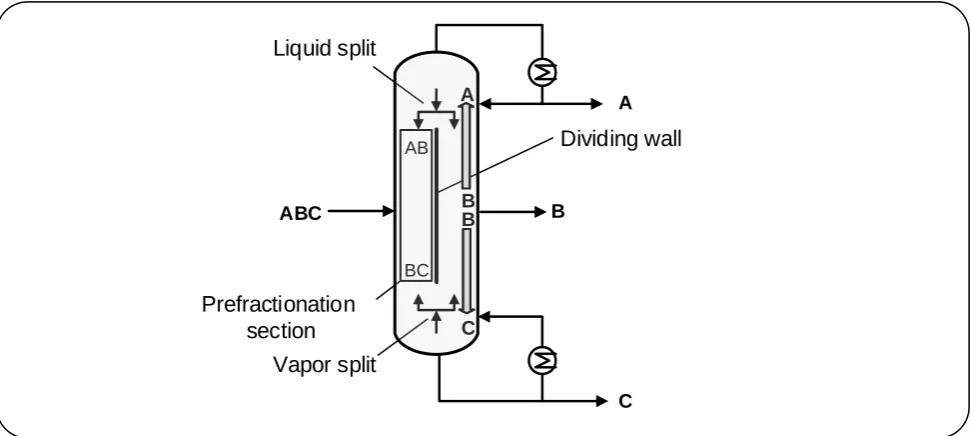
Fig. 1: Conventional dividing wall column for separation of a ternary mixture. A is the light-boiling, B is the middle-boiling and C is the heavy-boiling component. The prefractionation section performs a sharp split between A and C, while the
E component leaves the prefractionation section at both ends (non-sharp E split).
was accomplished in 1985 by BASF [7]. By now, more than 130 production scale units are worldwide in operation [8]. Kiss [3] summarized the industrial application of DWC. Most of the industrial DWCs are exploited by BASF, although other companies like Bayer AG, Dow Chemical Co., LG Chem Ltd, have started employing DWC technology as well [3].
Dividing wall columns are conventional distillation towers with at least a single vertical wall within the shell, as is shown in Fig. 1. This vertical wall makes it possible to separate a ternary feed into three products with the purer middle product than that from a conventional side draw. Without this vertical partition, it is not possible to keep side product free from lower an upper boiling point component. DWCs are the implementation of Petluyk arrangement. DWC also reduces the remixing loss and increases thermodynamic efficiency [9]. So, DWCs minimize the energy requirement for a specific separation. As well as the fewer value of operating cost, because of utilizing the single shell and one reboiler and condenser in the separation of multicomponent mixtures, DWCs reduce capital investment cost and the required installation space in compare with traditional conventional distillation sequences.
After thirty years of first industrial application of DWC and with a lot of numerical investigation on this separation technology, Kaibel [10] concluded that DWCs
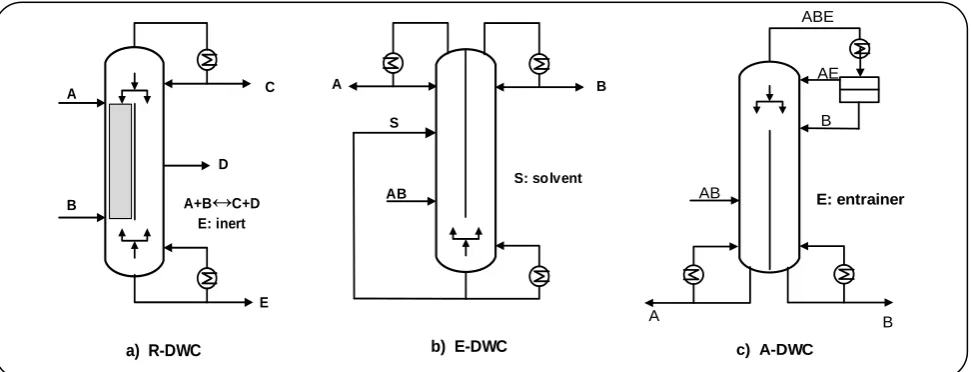
are fully developed to a standard type of distillation column. Fig. 2 shows three main types of DWCs which are namely azeotropic DWC (A-DWC), extractive DWC (E-DWC), and reactive DWC (R-DWC). The academic research studies and industrial practices address the concerns about the design, operation, and control of DWCs. In the following, some of these recent works are summarized.
R-DWC combines reactor with DWC in a single column shell, as is shown in Fig. 2-a and reactions regularly take place in the prefractionation section of the column. Ehlers et al. [11] by providing a detailed comparison between experimental and simulation results showed that how a mathematical model is able to accurately predict the behavior of a reactive Dividing Wall Column (RDWC) and this model can be used as a basis for the steady-state design of RDWCs. Schroder et al. [12] showed that energy-saving potential of the RDWC could be quantified precisely at an early stage of the process synthesis and Schroder and Fieg [13] presented the heuristics for estimating how the reaction system properties affect the energy saving in an RDWC.
In extractive distillation for separation of an azeotrope mixture, namely AB, a solvent, S, with a boiling point much higher than that of A and B, is added. Distillation sequence for extractive distillation can be integrated into one column and is illustrated in Fig. 2-b. Dai et al. [14]
A
B
C
Liquid split
Vapor split Prefractionation
section
Dividing wall
AB
BC
A
B B
Fig. 2: Dividing wall column (DWC) used for (a) Reactive distillation (R-DWC), (b) Extractive distillation (E-DWC), (c) Azeotropic distillation (A-DWC).
proposed an E-DWC and showed that it saved 44% of the operating and 35.8% of the total annualized cost of the process. Kiss et al. [15] proposed a heat pump assisted E-DWC and showed that 40% of energy was saved and also 24% decrease in total annual cost was possible.
Azeotropic distillation uses an additional component (an entrainer) that forms a heterogeneous azeotrope with the components to be separated. Then, it can be easily separated in a decanter. It is possible to combine azeotropic distillation with the DWC technology for separation of an azeotropic mixture AB with entrainer E according to Fig. 2-c. Le et al. [16] with the application of an A-DWC in the separation of water and acetic acid saved 20% in energy cost, meanwhile, reduced capital cost. Kiss and Suszwalak [17] used A-DWC and E-DWC for bioethanol dehydration and showed that over 20% energy savings were possible with using fewer equipment units. Li et al. [18] still modified an A-DWC with a vapor recompression heat pump and developed a process with better economic performance and environmental sustainability.
Different aspects of DWC application are investigated by now. Structured packing is regularly applied in the industrial application of DWC. In the other hand, Jobson [19] and Yildirim et al. [7] reported that for using trays in the industrial application of DWC, CEPSA Refinery, Spain, installed high-performance trays in a retrofit application and Koch Glitsch developed new chimney trays to facilitate accurate distribution of liquid and vapor flows to either side of the wall. Also, Rodríguez-Angeles
[20] developed a strategy for the mechanical design and hydrodynamic analysis of the sieve trays for the separation of a hydrocarbon mixture in a dividing wall column. Okoli and Adams [21] used DWC to reduce the production cost of biofuel and Kiss [4] reviewed the numerous novel application of DWC in biofuel production. Liu et al. [22] lowered the required amount of operating cost by applying the heat pump to DWC and made a more intensified process. However, this process needs more capital cost in compare with a conventional DWC.
Benyounes et al. [23] defined the key operating parameters to make the process to be feasible and concluded that internal split (liquid split fraction above the dividing wall and vapor split fraction bellow the dividing wall) play a very important role in the design of DWC. Ehlers et al. [24] showed that the improper value of the internal splits will lead to the wrong operation and make twice or three times larger energy demands in compare with conventional distillation sequence. The liquid split ratio at the top of the vertical wall can easily be set with the control valve, like the reflux stream at the top of the column. Also, a mechanical liquid splitter can be used [25]. So, it is common to use a liquid split fraction as a manipulated variable in the control structure of the DWC like the study by Arjomand and Fanaei [26] which proposed a control structure with a fixed vapor split fraction.
The recent studies have shown that it is possible to use vapor split fraction as a manipulated variable in the control structure of the DWC. Ramapriya et al. [27]
a) R-DWC A
B A+B C+D
E: inert C
E D
B
b) E-DWC A
S
AB
S: solvent
c) A-DWC
AB
B AE
B A
ABE
declared that if the vapor split at the bottom of the vertical partition does not be controlled, optimal operation of a DWC could be quite challenging. However, the effect of vapor split in the operation and control of the DWC is still a growing matter. Sun et al. [28] proposed a vapor splitter, and with the numerical simulation and the experimental study showed that the device could flexibly adjust the vapor split and achieve a uniform vapor distribution. Also, Huaqiang et al. [29] in arecent work investigated the performance of their proposed vapor splitter by a number of experiments under different operating conditions. In the other works, Dwivedi et al. [30] proposed a vapor splitter and with the experimental the study showed that it was possible to effectively manipulate vapor split in an appropriate feedback control structure.
In this paper, the usefulness of using the vapor split fraction as the control degree of freedom in the self-optimizing control structure of the DWC will be studied. It will be quantified with the numerical simulation study that manipulating vapor split can use energy saving possibilities of the DWC with avoiding the complexity in the self-optimizing control structure of the DWC. The rest of the paper is organized as follow. In the theoretical section, after describing the process under study, with the Vmin diagram, it will show that fixing the vapor split fraction on one value will not necessarily provide optimal operation for the column in the presence of feed composition disturbances. Then, a self-optimizing controlled variable based on the single measurement and the combination of measurements will be developed with using the vapor split fraction as the control degree of freedom. In the subsequent section, the proposed self-optimizing control structure will be validated with the dynamic simulation and it will be followed by the results and discussions section. Finally, the conclusions will be in the last section.
THEORETICAL SECTION
DWC process description
The separation of 1 kmol/s mixture of benzene/toluene/o-xylene is studied. Feed enters to the DWC at the temperature of 358K and with the concentration of 30/30/40 mol% B/T/X. The steady-state design of this separation is based on the result of the optimization study by Ling and Luyben [31]. The column diameter is 7.32 meter with sieve tray and the tray
spacing is 0.6 meter. There are 24 stages in prefractionation section (stages one through 24), 9 stages in rectifier section (stages 25 through 33), 24 stages in sidestream section (stages 34 through 57), and 13 stages in stripper section (stages 58 through 70). It is assumed that the tray efficiencies do not vary significantly with vapor and liquid rates near the column capacity [31]. Product purities are 99 mol %. Condenser pressure is 0.37 atmg and tray pressure drop is 0.0068 atm. The reflux ratio is 2.85, a liquid split fraction above the wall is 0.353, vapor split fraction bellow the wall is 0.625 and reboiler heat duty is 35.6 MW.
Vmin diagram
Vmin diagram or “minimum energy mountains” is a simple and useful tool to study the effect of vapor split on the energy requirement of a DWC [32]. V represents the vapor flow in the column, and subscript “min” is the minimum energy requirements in the limiting case of an infinite number of stages which is corresponding to the minimum vapor flow. A two product distillation column has two degrees of freedom for a given feed specification. Therefore, the Vmin diagram can visualize the entire operation range of a distillation column with a two-dimensional plot. However, the Vmin diagram uses underwood method and it has the assumption of constant relative volatilities and constant molar flows [33]. For more study about the Vmin diagrams, one can refer to the original work by Halvorsen [32].
To sketch the Vmin diagram for the process under study, the feed is considered to be saturated liquid, q = 1, and the feed has the composition of 0.3/0.3/0.4 mole fraction of B/T/X. The relative volatility in the highest temperature, α1, and the relative volatility in the lowest temperature, α2, in the column is computed from the data available in the book by Polling et al. [34] and then with the use of a geometric average
1 2 7.73 3.01 1
. The corresponding
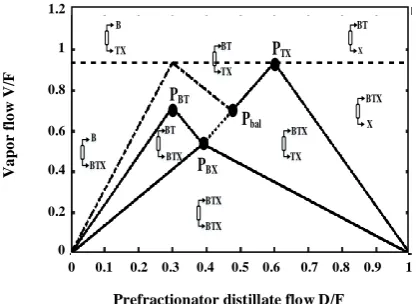
Fig. 3: Vmin diagram for the studied DWC.
the PBT and PTX peaks are the minimum vapor flow required for the sharp split between B/T and T/X, respectively. PBX is the sharp split between the two key components, namely B and X and allows the component T to distribute. The point PBX is the preferred split. The minimum required vapor flow rate in the Petlyuk column is simply the highest peak in the Vmin diagram. So, the highest peak always sets the overall requirement. In the Fig. 3, PTX has a higher peak than PBT and sets the overall requirement of vapor flow. However, for a balanced main column, the peaks are equal where the vapor flow requirement in the top section and in the bottom section of the main column becomes equal. The balance point in Fig. 3 is shown with Pbal. Fidkowski and Krolikowski [35], and also Halvorsen and Skogestad [32] have shown that the minimum boilup solution is not unique and the optimal region is extended from the preferred split (PBX) towards the highest peak up to the so-called “balanced point”, Pbal. This optimal region for vapor flow rate, which can determine the vapor split fraction bellow the dividing wall, is shown with a dotted line in Fig. 3. So, there is a flat optimal region where the minimum vapor flow rate can be obtained along a dotted line in Fig. 3, in the space spanned by the two degrees of freedom. Setting the vapor flow outside this flat optimal region makes DWC operate away from the optimality and degrade the energy saving possibility of DWC. This flat optimal region is computed for different feed composition and the corresponding vapor split fractions below the dividing wall are shown in Table 1. These optimal spans are also graphically shown in Fig. 4.
DWC process rigorous simulation
Although the dividing wall columns have gotten much attention in recent decades, there is not still an off-the-shelf unit operation model in current commercial flowsheet simulators. The four column model of a DWC reflects the actual situation of a DWC best, allows for the maximum flexibility regarding the specification for the different column specification and internal fractions, and also is the most suitable configuration for optimization and dynamic simulation studies [36]. Therefore, in this study, for rigorous steady-state simulation of DWC, four columns are used in Aspen Plus as is shown in Fig. 5. The dividing wall column configurations are shown in Fig. 5. The fully thermally coupled distillation column (Petlyuk configuration) is shown in Fig. 5-a. DWC is the the implementation of the Petlyuk configuration and is shown in Fig. 5-b. DWC is simulated using two absorbers, one stripper, and one rectifier column. Feed enters at stage 12 and sidestream withdraws at stage 44, as is shown in Fig. 5-c. Chao-Seader in the Aspen Plus simulator is used as a physical property package.
Definition of Optimal Operation
The objective is to minimize reboiler heat duty for specific product purity. With the constant feed flow rate and pressure, there are 7 dynamic degrees of freedom [37] and with taking into account two liquid level inventories, there are 5 steady state degrees of freedom. Three product purities are the three active constraints maintained by three steady state freedom degrees. So, two unconstrained degrees of freedom, namely as vapor (Rv) and liquid (Rl)
split fraction, are left which can be used to control the self-optimizing control variables. In addition, active constraints (product composition) and also feed composition considered as important disturbances.
Self-Optimizing Control
The self-optimizing method finds suitable Controlled Variables (CVs) for the unconstrained degrees of freedom. With controlling these CVs, with constant setpoint values, an acceptable loss is achieved (real-time optimization) [38]. Therefore, the process does not need to be reoptimized when disturbances occur. To quantify the acceptable loss, L, it is defined as the difference between the real value of the objective function, J, and the truly optimal value, as follow.
BT
TX
BT
BTX B
BTX
BTX
BTX
BTX
TX
BTX
X BT
X
B
TX
PTX
Pbal
PBT
PBX
Prefractionator distillate flow D/F
0 0.1 0.2 0.3 0.4 0.5 0.6 0.7 0.8 0.9 1
V
a
p
o
r
fl
o
w
V
/F
1.2
1
0.8
0.6
0.4
0.2
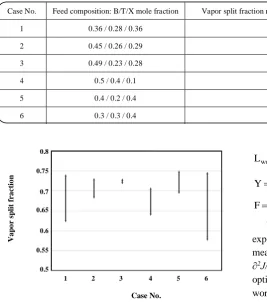
Table 1: Flat optimal region for cases with the different feed composition
Case No. Feed composition: B/T/X mole fraction Vapor split fraction range in the flat optimal region: Preferred split – Balanced split
1 0.36 / 0.28 / 0.36 0.6212 – 0.7422
2 0.45 / 0.26 / 0.29 0.6798 – 0.7323
3 0.49 / 0.23 / 0.28 0.7160 – 0.7314
4 0.5 / 0.4 / 0.1 0.6373 – 0.7093
5 0.4 / 0.2 / 0.4 0.6920 - 0.7514
6 0.3 / 0.3 / 0.4 0.5744 – 0.7480
Fig. 3: Vapor split fraction span in the flat optimal region for different feed composition case.
opt
LJ (u, d) J (d) (1)
Where u and d are input and disturbance vectors, respectively. For an exact optimal operation, the loss value is zero, however, generally, the loss value is greater than zero (L > 0). The loss depends on the selected CVs and the optimal set of CVs have the least amount of loss in the set of candidate measurements. In distillation control, it is usual and convenient to measure temperature. In this study, also, stage temperatures are selected as the set of candidate measurement. So, there are 70 temperature measurements corresponding to each stage. With the self-optimizing method, it is possible to systematically find a suitable subset of measurement among all possible alternatives. Exact local method [39] for finding self-optimizing CVs is used in this work which selects the subset with the minimum worst case loss imposed by each candidate subset among all possible alternatives, as follow.
2 1/2 y 1
worst uu
1
L (H) (J (HG ) HY)
2
(2)
d n
Y[ FW W ] (3)
y y 1
uu ud
d
FG G J J (4)
Where H is called the selection matrix, Wd is the
expected magnitude of disturbances, Wn is the
measurement errors, Gy and Gy
d are the gain matrix, Juu is
∂2J/∂u2, and J
ud is ∂2J/∂u∂d. F in equation (4) is called the
optimal sensitivity matrix where Fij=∂yi,opt/∂dj. In another
word, F is the change in the optimal value of measurement, y, due to changes in disturbances, d. The value of F is numerically calculated with making a small perturbation in d and reoptimization of the process. The expected magnitudes of disturbance for toluene mole fraction in the feed and for the three product mole fractions are as Table 2. The implementation errors are also considered to be 1.0 degree Celsius.
There are 2415
! 68 ! 2
! 70 2
70
possible subsets in the
set of candidate measurements. Since the evaluation of loss for all alternative subsets (exhaustive search) is computationally burden and intractable for large-scale problems, therefore the branch and bounding method is used [40]. With the branch and bounding algorithm, a combinatorial optimization problem in finding an optimal subset of measurement in the set of candidate measurement is solved. The results are shown in Table 3. This table shows the first five best sets of measurement for the self-optimizing CV. The best choice with the lowest worst case loss is the temperature of stages 13 and 56.
Optimal Measurement Combination
In the previous section, the self-optimizing CVs is selected as an individual measurement. However, 0.5
0.55 0.6 0.65 0.7 0.75 0.8
1 2 3 4 5 6
V
a
p
o
r
sp
li
t
fr
a
ctio
n
Case No.Case No.
1 2 3 4 5 6
V
a
p
o
r
s
p
li
t
fr
a
c
ti
o
n
0.8
0.75
0.7
0.65
0.6
0.55
Table 2: Expected magnitude of disturbance.
i Disturbance Wd (i,i)
1 Toluene mole fraction in F 0.12
2 Benzene mole fraction in D 0.2
3 Toluene mole fraction in S 0.2
4 Xylene mole fraction in B 0.2
Table 3: Five sets of self-optimizing CVs with individual measurement.
Rank of sets Set Minimum worst case loss (kW)
1 CV1 = T13
CV2 = T56 244.6
2 CV1 = T42
CV2 = T56
1758.1
3 CVCV1 = T13
2 = T42 2313.0
4 CV1 = T44
CV2 = T56 2981.6
5 CVCV1 = T2
2 = T56 3019.9
Fig. 5: Dividing wall column configurations (a) Fully thermally coupled distillation column (Petlyuk configuration), (b) Dividing wall column (Implementation of Petlyuk configuration), (c) DWC model with four columns
as an alternative to individual measurement, a linear combination of available measurements leads to the lower loss and therefore better self-optimizing properties. The linear measurement combination is as Eq. (5).
C H y
(5)
Finding the linear combination of measurement as Eq. (5) that minimizes the loss leads to solving the optimization problem to minimize the worst case loss for a set of the controlled variable. This optimization problem is written as Eq. (6).
1/2 y 1
opt uu
H
H arg min ( J (HG ) HY) (6)
The Eq. (6) is a non-convex optimization problem and the solution is not unique. Alstad et al. [41] have shown
that J1/2uu(HG )y 1
may be freely selected. So, simply set
1/2 y 1
uu
J (HG ) I and solved the following optimization
problem[41].
opt
H
1/2 y 1
uu
H arg min ( HY)
subject to : J (HG ) I
(7)
ABC
A
C B
(a)
ABC
A
C B
(b)
25
33
1
24
34
57
12 44
58
70
Vapor split fraction Liquid split
fraction
ABC
A
B
C
Table 4: Optimal measurement combination (CVs) with corresponding loss.
No. of measurements The best set of combination CVs Minimum worst case loss (kW)
2 CV1 = T13
CV2 = T56
244.6
3 CV1 = -2.0055T13 + 0.0211T15 + 0.0164T63
CV2 = 0.2257T13 + 1.1289T15 – 0.4592T63 199.7
4 CV1 = -0.3448T2 + 0.4228T22 – 0.3467T42 + 0.3177T55
CV2 = -0.1123T2 – 0.3415T22 – 0.2775T42 – 0.5242T55
48.2
5 CV1 = -0.2340T2 – 0.4479T14 + 0.3930T23 – 0.2786T42 + 0.2471T55
CV2 = -0.0632T2 – 0.1850T14 – 0.3426T23 – 0.2441T42 – 0.5430T55
29.3
6 CV1 = -0.2485T2 + 0.3479T24 – 0.2786T42 + 0.2204T55 + 0.2610T56 – 0.1550T66
CV2 = -0.0558T2 – 0.1812T24 – 0.1703T42 – 0.3091T55 – 0.2711T56 – 0.1073T66 21.4
Where I is the unit matrix and both objective function and constraints are linear. The explicit solution of the optimization problem, Eq. (7), for H is as Eq. (8).
T
T T 1 y y T 1 y 1 1/2
uu
H (Y Y ) G (G (Y Y ) G ) J (8)
This solution also minimizes the maximum singular
value of J1/2uu (HG )y 1HY
, that is, provides the solution
to Eq. (6). In this section also, the branch and bound method is used for selection of the optimal combination of measurements [40]. The results are shown in Table 4. As can be seen in Table 4, the value of local loss decreases with increasing the number of measurements.
DYNAMIC VALIDATION
Structure of the control layer
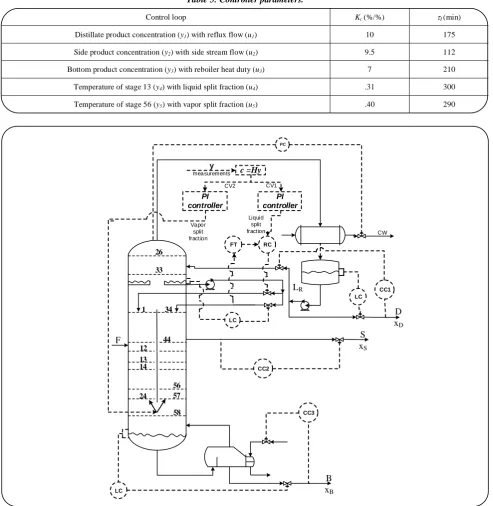
The decentralized structure of DB/LSV with low complexity PI controller, which is used frequently in the literature [42], is used in the control structure of the studied DWC. In this control structure, the concentration of the distillate product is controlled by the reflux flow, the concentration of the side product is controlled by the side stream flow, and the concentration of the bottom product is controlled by the reboiler heat duty. Finally, each determined self-optimizing CV is paired with a corresponding closest manipulated variable. So, the temperature of stage 13 is controlled by the liquid split fraction and the temperature of stage 56 is controlled by the vapor split fraction. Also, 5 minute dead time is added to all composition loops. The resulting control structure is shown in Fig. 6.
Controller tuning
The PI controllers are tuned with the SIMC method [43].
c c
1 K
k
(5)
I min[ , 4( c )]
(6)
Where k, , and are the process gain, the time constant, and time delay, respectively. Kc, I, and c are also
the controller gain, the integral time constant, and desired closed-loop time constant (tuning parameter), respectively. In our case, we choose c = to ensure tight control subject
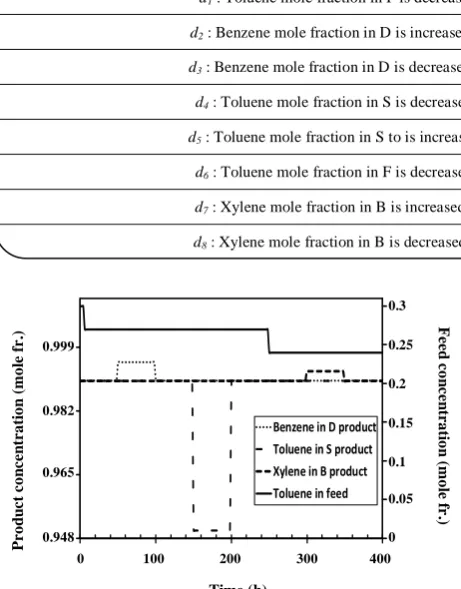
to having good robustness for product concentration loops which are active constraints. The controller parameters are shown in Table 5. The level controllers are proportional only with the gain value of 2. The proposed control structure is studied in rejecting the disturbances entered into the plant according to the Fig. 7. The dynamic responses of the proposed control structure are also shown in Fig. 8.
Nonlinear loss
The self-optimizing CVs are selected based on the linear model. In this section, the value of the loss is also calculated with the nonlinear model to see the performance of the proposed self-optimizing control structure. In this way, the process is reoptimized for each disturbance to determine the economic deviation of the process operation with the proposed control structure from its corresponding optimum value. The values of nonlinear loss are shown in Table 6.
RESULTS AND DISCUSSIONS
Table 5: Controller parameters.
Control loop Kc(%/%) I(min)
Distillate product concentration (y1) with reflux flow (u1) 10 175
Side product concentration (y2) with side stream flow (u2) 9.5 112
Bottom product concentration (y3) with reboiler heat duty (u3) 7 210
Temperature of stage 13 (y4) with liquid split fraction (u4) .31 300
Temperature of stage 56 (y5) with vapor split fraction (u5) .40 290
Fig. 6: Proposed decentralized control structure.
This flat optimal region is computed for different disturbances in the feed and the corresponding vapor split fraction at the bottom of the partitioning wall is shown in Fig.4. It is clear from Fig. 4 that fixing vapor split fraction in the flat optimal region of one case is not necessarily in the optimal region of the other case and it makes the DWC deviate from the optimal operation.
As an example, fixing vapor split fraction in the optimal region of case 3 is outside the optimal region of case 4 or all the vapor split fraction in case 6 is not in the optimal region of case 2. So, fixing the vapor split fraction on one value will not necessarily provide optimal operation for the column in the presence of feed composition disturbances. Therefore, the vapor split fraction at the
CC1
B
xB
LC
PC
CC2 RC FT
c =Hy
PI controller
CW
S
xS
D
xD
F
CC3
LC
26
33
1
12
24 44
58 57 34
13 14
LR
LC y
PI controller
CV2 CV1
Liquid split fract ion Vapor
split fract ion
measurements
Table 6: Nonlinear loss imposed by self-optimizing structure.
Disturbance Loss (kW)
d1 : Toluene mole fraction in F is decreased from 0.3 to 0.27 134
d2 : Benzene mole fraction in D is increased from 0.99 to 0.995 128
d3 : Benzene mole fraction in D is decreased from 0.995 to 0.99 134
d4 : Toluene mole fraction in S is decreased from 0.99 to 0.95 126
d5 : Toluene mole fraction in S to is increased from 0.95 to 0.99 134
d6 : Toluene mole fraction in F is decreased from 0.27 to 0.24 140
d7 : Xylene mole fraction in B is increased from 0.99 to 0.992 135
d8 : Xylene mole fraction in B is decreased from 0.992 to 0.99 140
Fig. 7: Disturbance trajectory.
bottom of the partitioning wall is used in the self-optimizing control structure of a DWC as a steady-state degree of freedom (active vapor split).
Table 3 shows 5 alternatives for individual measurement as a self-optimizing CV. The first row in this table shows the best set with the lowest local loss among all other alternatives. The rest of the rows of the table show other alternatives for a single measurement self-optimizing CV. Table 4 shows 4 alternatives with the combination of measurements as a self-optimizing CV. The value of local loss for the best set with the lowest local loss in Table 3 is small enough (244.6kW / 35600kW = 0.0069 which is lower than 0.7 percent of the nominal value of the reboiler duty) and the combination of measurements in Table 4 provides a little enhancement in reducing the loss. So, selecting individual measurement as a self-optimizing CV provides sufficiently near optimal operation in the studied DWC and there is no need for the combination of measurements.
The results of the study by Arjomand and Fanaei [26] showed that it is possible to have better self-optimizing properties by controlling linear combinations of measurements than by controlling conventional individual measurements in the self-optimizing control structure of DWC and the combination of measurements was recommended for lower loss. However, selecting a combination of measurement as controlled variable is not common in practice and also it suffers from the lack of physical meaning. In addition, dynamic issues, such as inverse response may cause problems [44]. But, it is shown in this paper that with the aid of active vapor split fraction, it is possible to select individual measurement as a self-optimizing CV. So, the proposed self-optimizing control structure in this paper, with using active vapor split, avoids the complexity of the combination of measurement as the self-optimizing CV in compare with the study by Arjomand and Fanaei [26] and in the meantime provides optimal operation.
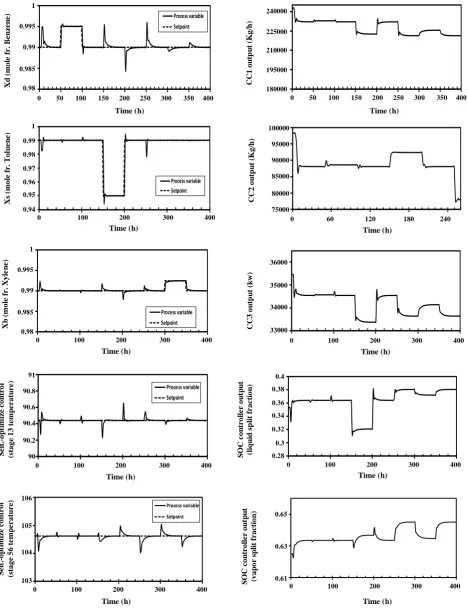
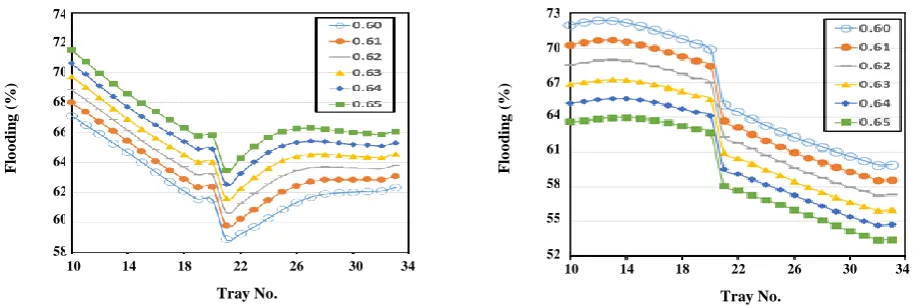
Fig. 8 shows the dynamic responses of the proposed control structure in rejecting the disturbances entered into the process as Fig. 7. It is clear from Fig. 8 that the proposed control structure conveniently rejects the effect of disturbances, makes the process stable and controls the product concentrations tightly. Also, for each disturbance, the flowsheet is reoptimized and the corresponding losses from the nonlinear model are shown in Table 6. The small values of nonlinear loss in Table 6 indicate that the proposed self-optimizing control structure makes the process track near optimal operation with a negligible loss from the practical point of view and removes the need for real-time optimization. Fig. 9 shows the percent of flooding for the trays on both sides of the partitioning
0 0.05 0.1 0.15 0.2 0.25 0.3
0.948 0.965 0.982 0.999
0 100 200 300 400
F
e
e
d
c
o
n
c
e
n
tr
a
ti
o
n
(
m
o
le
f
r.
)
P
ro
d
u
c
t
c
o
n
c
e
n
tr
a
ti
o
n
(
m
o
le
f
r.
)
Time(hr)
Benzene in D product Toluene in S product Xylene in B product Toluene in feed
Time (h)
0 100 200 300 400
P
r
o
d
u
c
t
c
o
n
c
e
n
tr
a
ti
o
n
(m
o
le
fr
.)
0.999
0.982
0.965
0.948
F
e
e
d
c
o
n
c
e
n
tr
a
ti
o
n
(m
o
le
fr
.)
0.3
0.25
0.2
0.15
0.1
0.05
Fig. 8: Dynamic responses of the studied DWC with the proposed self-optimizing control structure. 0.98 0.985 0.99 0.995 1
0 50 100 150 200 250 300 350 400
X d ( m o le fr . B e n z e n e ) Time (hr) Process variable Setpoint 0.94 0.95 0.96 0.97 0.98 0.99 1
0 100 200 300 400
X s ( m o le fr . T o lu e n e ) Time (hr) Process variable Setpoint 0.98 0.985 0.99 0.995 1
0 100 200 300 400
X b ( m o le f r. ( X y le n e ) Time (hr) Process variable Setpoint 90 90.2 90.4 90.6 90.8 91
0 100 200 300 400
S e lf -o p ti m iz e c o n tr o l (S ta g e 1 3 te m p e ra tu re ) Time (hr) Process variable Setpoint 103 104 105 106
0 100 200 300 400
S e lf -o p ti m iz e c o n tr o l (S ta g e 5 6 t em p er a tu re) Time (hr) Process variable Setpoint 180000 195000 210000 225000 240000
0 50 100 150 200 250 300 350 400
C C 1 o u tp u t (K g / h r ) Time (hr) 75000 80000 85000 90000 95000 100000
0 60 120 180 240
C C 2 o u tp u t (K g / h r) Time (hr) 33000 34000 35000 36000
0 100 200 300 400
C C 3 o u tp u t (kw ) Time (hr) 0.28 0.3 0.32 0.34 0.36 0.38 0.4
0 100 200 300 400
S O C C o n tr o ll e r o u tp u t (l iq u i s p li t fr a c ti o n ) Time (hr) 0.61 0.63 0.65
0 100 200 300 400
SO C c o n tr o ll e r o u tp u t (v ap o r sp li t fr ac ti o n ) Time (hr) Time (h)
0 50 100 150 200 250 300 350 400
X d (m o le fr . Be n z e n e ) 1 0.995 0.99 0.985 0.98 Time (h)
0 50 100 150 200 250 300 350 400
Time (h)
0 100 200 300 400
Time (h)
0 60 120 180 240
Time (h)
0 100 200 300 400
Time (h)
0 100 200 300 400
Time (h)
0 100 200 300 400
Time (h)
0 100 200 300 400
Time (h)
0 100 200 300 400
Time (h)
0 100 200 300 400
X s (m o le fr . To lu e n e
) 1
0.99 0.98 0.97 0.96 0.95 0.94 C C 1 o u tp u t (K g /h ) 240000 225000 210000 195000 180000 C C 2 o u tp u t (K g /h ) 100000 95000 90000 85000 80000 75000 C C 3 o u tp u t (k w ) 36000 35000 34000 33000 S O C c o n tr o ll e r o u tp u t (l iq u id s p li t fr a c ti o n ) 0.4 0.38 0.36 0.34 0.32 0.3 0.28 S O C c o n tr o ll e r o u tp u t (v a p o r s p li t fr a c ti o n
) 0.65
0.63 0.61 X b (m o le fr . X y le n e ) 1 0.995 0.99 0.985 0.98 S e lf. -o p ti m iz e c o n tr o l (s ta g e 1 3 te m p e r a tu r e
) 91
90.8 90.6 90.4 90.2 90 S e lf. -o p ti m iz e c o n tr o l (s ta g e 5 6 te m p e r a tu r e
) 106
105
104
Fig. 9: Percent flooding profile for the trays on both sides of the partitioning wall (a) prefractionation section (b) main column section.
wall in the column. It is clear from Fig. 9 that including the vapor split fraction in the self-optimizing control structure of DWC does not cause a bottleneck problem in the operation of the distillation column.
CONCLUSIONS
In this paper, it was shown with the Vmin diagram that fixing the vapor split fraction on a specific value in the optimal operation span of a given feed, may not necessarily provide optimal operation for different feed composition. Then, the vapor split fraction at the bottom of the partitioning wall was effectively used in the self-optimizing control structure of a DWC as a steady-state degree of freedom (active vapor split). With the exact local method, it was shown that the worst case lose impose by single measurement candidates in the self-optimizing control structure of DWC was lower than 0.7 percent of the nominal value. Moreover, the rigorous simulation study in the presence of disturbances showed that the nonlinear loss was negligible, from a practical point of view. So, it was shown that the proposed self-optimizing control structure, with a single measurement as self-optimizing CV, made the process track optimal operation. Therefore, the active vapor split made it possible to avoid the complexity of the combination of measurement as a self-optimizing controlled variable. In the other hand, the value of flooding percent showed that the proposed self-optimizing control structure did not cause a bottleneck problem. In addition to the near optimal operation, the effect of disturbances is studied with the dynamic simulation and it was shown that the
proposed self-optimizing control structure conveniently made the process stable with a simple decentralized control structure.
Received : Oct. 31, 2016 ; Accepted : Nov. 20, 2017
REFERENCES
[1] Kiss A.A., Distillation Technology – Still Young and Full of Breakthrough Opportunities, Journal of Chemical Technology and Biotechnology, 89: 479-498 (2014).
[2] Li H., Wu Y., Li X., Gao X., State-Of-The-Art of Advanced Distillation Technologies in China, Chemical Engineering Technology, 39(5): 815-833 (2016).
[3] Kiss A.A., “Advanced Distillation Technologies - Design, Control and Applications”, John Wiley and Sons, Inc. (2013).
[4] Kiss A.A., Novel Applications of Dividing-Wall Column Technology to Biofuel Production Processes, Journal of Chemical Technology and Biotechnology, 88(8): 1387-1404 (2013).
[5] Luyben W.L., Comparison of a Conventional Two-Column Demethanizer/Deethanizer Configuration Requiring Refrigerated Condensers with a Nonconventional Column/Rectifier Configuration, Journal of Chemical Technology and Biotechnology, 91(6): 1688–1696 (2016).
[6] Schultz M., Stewart D.G., Harris J.M., Rosenblum S.P., Shakur M.S., Obrien D.E., Reduce Costs with Dividing-Wall Columns, Chemical Engineering Progress, 98: 64-71 (2002).
Tray No.
F
lo
o
d
in
g
(
%)
74
72
70
68
66
64
62
60
58
10 14 18 22 26 30 34
Tray No.
F
lo
o
d
in
g
(
%)
73
70
67
64
61
58
55
52
[7] Yildirim O., Kiss A.A., Kenig E.Y., Dividing Wall Columns in Chemical Process Industry: A Review on Current Activities, Separation and Purification Technology, 80: 403–417 (2011).
[8] Staak D., Grutzner T., Schwegler B., Roederer D.,
Dividing Wall Column for Industrial Multi Purpose Use, Chemical Engineering and Processing: Process Intensification, 75: 48– 57 (2014).
[9] Donahue M.M., Roach B.J., Downs J.J., Blevins T., Baldea M., Eldridge R.B., Dividing Wall Column Control: Common Practices and Key Findings, Chemical Engineering and Processing: Process Intensification, 107: 106-115 (2016).
[10] Kaibel B., “Dividing-Wall Columns, in Distillation: Equipment and Processes”, Editor, Gorak A., Olujic Z., Academic Press (2014).
[11] Ehlers C., Egger T., Fieg G., Experimental Operation of a Reactive Dividing Wall Column and Comparison with Simulation Results, AIChE Journal, 63(3): 1036-1050 (2017).
[12] Schroder M., Ehlers C., Fieg G., A Comprehensive Analysis on the Reactive Dividing-Wall Column, Its Minimum Energy Demand, and Energy-Saving Potential, Chemical Engineering Technology, 39(12): 2323-2338 (2016).
[13] Schroder M., Fieg G., Influence of Reaction System Properties on the Energy Saving Potential of the Reactive Dividing-Wall Column: Separation Properties, Chemical Engineering Technology, 39(12): 2265-2272 (2016).
[14] Dai X., Ye Q., Qin J., Yu H., Suo X., Li R., Energy-Saving Dividing-Wall Column Design and Control for Benzene Extraction Distillation via Mixed Entrainer, Chemical Engineering and Processing: Process Intensification, 100: 49–64 (2016).
[15] Kiss A.A., Luo H., Bildea C.S., Energy Efficient Bioethanol Purification by Heat Pump Assisted Extractive Distillation, Computer Aided Chemical Engineering, 37: 1307-1312 (2015).
[16] Le Q.K., Halvorsen I.J., Pajalic O., Skogestad S.,
Dividing Wall Columns for Heterogeneous Azeotropic Distillation, Chemical Engineering Research and Design, 99: 111-119 (2015).
[17] Kiss A.A., Suszwalak D.J.P.C., Enhanced Bioethanol Dehydration by Extractive and Azeotropic Distillation in Dividing-Wall Columns, Separation and Purification Technology, 86: 70-78 (2012).
[18] Li R., Ye Q., Suo X., Dai X., Yu H., Feng S., Xia H.,
Improving the Performance of Heat Pump-Assisted Azeotropic Dividing Wall Distillation, Industrial and Engineering Chemistry Research, 55(22): 6454– 6464 (2016).
[19] Jobson M., Dividing Wall Distillation Comes of Age, The Chemical Ehgineering, 766: 30-31 (2005). [20] Rodríguez-Angeles M.A., Gomez-Castro F.I.,
Segovia-Hernandez J.G., Uribe-Ramírez A.R.,
Mechanical Design and Hydrodynamic Analysis of Sieve Trays in a Dividing Wall Column for a Hydrocarbon Mixture, Chemical Engineering and Processing: Process Intensification, 97: 55–65 (2015).
[21] Okoli C.O., Adams T.A., Design of Dividing Wall Columns for Butanol Recovery in a Thermochemical Biomass to Butanol Process, Chemical Engineering and Processing: Process Intensification, 95: 302–316 (2015).
[22] Liu Y., Zhai J., Li L., Sun L., Zhai C., Heat Pump Assisted Reactive and Azeotropic Distillations in Dividing Wall Columns, Chemical Engineering and Processing: Process Intensification, 95: 289–301 (2015).
[23] Benyounes H., Benyahia K., Shen W., Gerbaud V.,
Novel Procedure for Assessment of Feasible Design Parameters of Dividing-Wall Columns: Application to Non-Azeotropic Mixtures, Industrial and Engineering Chemistry Research, 54(19): 5307– 5318 (2015).
[24] Ehlers C., Schroder M., Fieg G., Influence of Heat Transfer Across the Wall of Dividing Wall Columns on Energy Demand, AIChE Journal, 61(5): 1648-1662 (2015).
[25] Gorak A., Olujic Z., Distillation: Equipment and Processes, Academic Press (2014).
[26] Arjomand A., Fanaei M.A., Optimal Operation of a Three-Product Dividing-Wall Column with Self-Optimizing Control Structure Design, Iranian Journal of Chemistry and Chemical Engineering (IJCCE), 34(1): 107-117 (2015).
[27] Ramapriya G.M., Tawarmalani M., Agrawal R.,
[28] Sun J., Ge H., Chen W., Chen N., Chen X., CFD Simulation and Experimental Study on Vapour Splitter in Packed Divided Wall Column, The Canadian Journal of Chemical Engineering, 93(12): 2261–2265 (2015).
[29] Huaqiang G., Xiangwu C., Nan C., Wenyi C.,
Experimental Study on Vapour Splitter in Packed Divided Wall Column, Journal of Chemical Technology and Biotechnology, 91(2): 449–455 (2016). [30] Dwivedi D., Strandberg J.P., Halvorsen I.J., Preisig H.A.,
Skogestad S., Active Vapor Split Control for Dividing-Wall Columns, Industrial and Engineering Chemistry Research, 51(46): 15176–15183 (2012). [31] Ling H., Luyben W.L., New Control Structure for
Divided-Wall Columns, Industrial and Engineering Chemistry Research, 48: 6034-6049 (2009).
[32] Halvorsen I.J., Minimum Energy Requirements in Complex Distillation Arrangements, Ph.D. Thesis, Norwegian University of Science and Technology, Department of Chemical Engineering, (2001). [33] Underwood A.J.V., Fractional Distillation of
Multi-Component Mixtures, Industrial and Engineering Chemistry Research, 41(12): 2844-2847 (1949). [34] Poling B.E., Prausnitz J.M., O'Connell J.P., The
Properties of Gases and Liquids, McGraw-Hill (2001). [35] Fidkowski Z., Krolikowski L., Thermally Coupled
System of Distillation Columns: Optimization Procedure, AIChE journal, 32(4): 537-546 (1986). [36] Dejanovic I., Matijasevic L.J., Olujic Z., Dividing
Wall Column-A Breakthrough Towards Sustainable Distilling, Chemical Engineering and Processing: Process Intensification, 49: 559-580 (2010).
[37] Mutalib M.I.A., Smith R., Operation and Control of Dividing Wall Distillation Columns Part1: Degrees of Freedom and Dynamic Simulation, Trans IChemE, 76(Part A): 308-318 (1998).
[38] Skogestad S., Plantwide Control: The Search for the Self-Optimizing Control Structure, Journal of Process Control, 10(5): 487-507 (2000).
[39] Halvorsen I.J., Skogestad S., Morud J.C., Alstad V.,
Optimal Selection of Controlled Variables, Industrial and Engineering Chemistry Research, 42: 3273-3284 (2003).
[40] Kariwala V., Cao Y., Bidirectional Branch and Bound for Controlled Variable Selection. Part II: Exact Local Method for Self-Optimizing Control, Computers and Chemical Engineering, 33: 1402-1412 (2009).
[41] Alstad V., Skogestad S., Hori E.S., Optimal Measurement Combinations as Controlled Variables, Journal of Process Control, 19: 138-148 (2008). [42] Kiss A.A., Rewagada R.R., Energy Efficient Control
of a BTX Dividing-Wall Column, Computers and Chemical Engineering, 35: 2896-2904 (2011). [43] Skogestad S., Simple Analytic Rules for Model
Reduction and PID Controller Tuning, Journal of Process Control, 13: 291-309 (2003).