M E T H O D O L O G Y
Open Access
Automatic classification of communication
logs into implementation stages via text
analysis
Dingding Wang
1, Mitsunori Ogihara
2, Carlos Gallo
3, Juan A. Villamar
3, Justin D. Smith
3,
Wouter Vermeer
3, Gracelyn Cruden
4, Nanette Benbow
3and C. Hendricks Brown
3*Abstract
Background: To improve the quality, quantity, and speed of implementation, careful monitoring of the implementation process is required. However, some health organizations have such limited capacity to collect, organize, and synthesize information relevant to its decision to implement an evidence-based program, the
preparation steps necessary for successful program adoption, the fidelity of program delivery, and the sustainment of this program over time. When a large health system implements an evidence-based program across multiple sites, a trained intermediary or broker may provide such monitoring and feedback, but this task is labor intensive and not easily scaled up for large numbers of sites.
We present a novel approach to producing an automated system of monitoring implementation stage entrances and exits based on a computational analysis of communication log notes generated by implementation brokers.
Potentially discriminating keywords are identified using the definitions of the stages and experts’ coding of a portion of the log notes. A machine learning algorithm produces a decision rule to classify remaining, unclassified log notes. Results: We applied this procedure to log notes in the implementation trial of multidimensional treatment foster care in the California 40-county implementation trial (CAL-40) project, using the stages of implementation completion (SIC) measure. We found that a semi-supervised non-negative matrix factorization method accurately identified most stage transitions. Another computational model was built for determining the start and the end of each stage. Conclusions: This automated system demonstrated feasibility in this proof of concept challenge. We provide suggestions on how such a system can be used to improve the speed, quality, quantity, and sustainment of
implementation. The innovative methods presented here are not intended to replace the expertise and judgement of an expert rater already in place. Rather, these can be used when human monitoring and feedback is too expensive to use or maintain. These methods rely on digitized text that already exists or can be collected with minimal to no intrusiveness and can signal when additional attention or remediation is required during implementation. Thus, resources can be allocated according to need rather than universally applied, or worse, not applied at all due to their cost. Keywords: Machine learning, Unobtrusive measures, Text mining, Social systems informatics
Abbreviations: CAL-40, California 40-county implementation trial; CDT, Community development teams; IND, Individualized county implementation; IRB, Institutional review board; MTFC, Multidimensional treatment foster care; NMF, Non-negative matrix factorization; SIC, Stages of implementation completion; SVM, Support vector machine
*Correspondence: [email protected]
3Center for Prevention Implementation Methodology, Department of Psychiatry and Behavioral Sciences, Feinberg School of Medicine Northwestern University, 750 N. Lake Shore Dr., Chicago, IL, USA Full list of author information is available at the end of the article
Background
A critical challenge to implementation science is the development of methods to support the scale up of evidence-based programs that are both effective and feasible for use in research-limited community service agencies. Since implementation agencies at the federal, state, or community level typically operate with limited resources, allocating them wisely to achieve a saturated, effective level of implementation (e.g., maximizing the number of adopters and ensuring that each adopter exe-cutes the intervention program at a high level of fidelity) is a key issue. A community service agency, local health organization, or technical assistance center may need to take an additional step to move a stagnating but promis-ing implementation forward or may have to withdraw resources from an effort that shows no sign of pro-gressing or achieving impact. Currently, agencies make strategic resource allocation decisions based upon their personal experiences or on limited prior evidence, which is typically derived from investigations conducted under conditions that may not be comparable to real-world cir-cumstances (e.g., implementation trials taking place in a different health system). Ideally, one would want to respond to experiences in the field based on valid and reliable measures to assess the quality, quantity, speed, and sustainment of implementation of an evidence-based intervention through the various stages in the process [3, 7, 29]. However, the accurate and reliable measure-ment of implemeasure-mentation stages and milestone attainmeasure-ment is generally resource intensive [16, 35] and therefore not often available for monitoring and feedback. A method-ological question germane to implementation science is whether the process of implementing a given interven-tion can be mathematically characterized using low cost or unobtrusive measurement methods [41], what we call of social system informatics (Gallo, CG, Berkel, C, Mauri-cio, A, Sandler, I, Smith, JD, Villamar, JA, Brown, CH, Implementation Methodology from a Systems-Level Per-spective: An Illustration of Redesigning the New Begin-nings Program, in preparation) and whether these results can be used to assist implementation decision making processes, potentially reducing human bias and error while reducing the costs associated with scale up and sustainment. This automated alternative to a coding by an expert of the implementation process could use read-ily available text information, such as an organization’s meeting notes, grantee reports to funding agencies, or email implementation agents, and transcripts of interven-tion agents, and the target populainterven-tion as programs are delivered. Such text is one type information that we have found useful in identifying key activities and milestones indicative of implementation stage; however, the auto-mated classification of such information has only recently been tested in limited circumstances [16]. In this paper,
we present a proof of concept for automating the deter-mination of the stage of implementation using a machine learning algorithm with brief text collected by an imple-mentation broker or intermediary as an evidence-based program is implemented across 40 counties. This auto-mated approach to determining when different stages are entered or exited could pave the way for improved imple-mentation decision-making as programs are scaled up.
Implementation is a process that runs in stages. The number of stages, what each stage represents, and their elements are largely defined by the developer of a specific intervention or specified by the implementation frame-work that guides the research. Stages are useful for under-standing and organizing the tasks and activities that occur earlier versus later in the implementation process, [29] and the level and type of involvement required of each ser-vice agency [39]. For example, Aarons and colleagues [1] describe a four-stage framework for the implementation of interventions in the public service sector. These stages are as follows: exploration, adoption decision/preparation, active implementation, and sustainment (referred to as the EPIS framework). With almost any implementation effort, there exists the possibility of multiple stages over-lapping or occurring concurrently. This can be very ben-eficial; for example, monitoring progress on preliminary steps towards sustainment may be useful in predicting whether a health delivery system eventually attains this stage. Many intervention developers have described the implementation process and the scale up of their spe-cific intervention in considerable detail using their own systems, for implementing selected parenting programs that focus on prevention [10, 15, 16, 18–21, 25, 34, 36]. In this particular study, we use the stages of implemen-tation completion (SIC) [7], which involves eight stages, in a randomized implementation trial involving 40 coun-ties in California where multidimensional treatment foster care is implemented [3, 8–10, 23, 30, 32, 40]. We selected this CAL-40 project for proof of concept because of the high quality and strength of the SIC data and use this for development and illustration of the method.
based on an ongoing set of communication log notes taken by an intervention broker. The classifier is built on the expert’s classification of messages and applied to unclas-sified messages to provide probabilities of stage member-ship. These can then be used to identify when entries, exits, and potential re-entries into these stages occur.
This paper is organized as follows. In the next section, we provide a brief context of our motivating implementa-tion study, what data are available, a high-level overview of the construction of an algorithm for classification, and how it can be used in practice. We also describe preparatory steps including what we term data scrubbing to remove person and place identifiers. This is followed by a more detailed section on keyword labeling, feature extraction, and a description of the novel semi-supervised non-negative matrix factorization algorithm. This section is for readers requiring computational details, but other readers can glean the general approach from the previ-ous section and can skip the details. Next, we illustrate the use of these procedures on text obtained from the CAL-40 project, showing the behavior of this automated classifier based on short sequences of text and how well it can infer the stage and date entrances and exits longitudinally. We end with a conclusion section.
Methods
Cal-40 study
For this proof of concept, we utilized the communication log notes from a large-scale randomized implementation trial of multidimensional treatment foster care (MTFC) to examine the efficacy of the proposed text mining approach. A total of 51 counties, 40 from California and 11 from Ohio, were recruited and randomized to the individualized (IND) or community development teams (CDT) implementation model. California counties, whose data are the focus of this paper, were recruited starting May 2006, with follow-up data collected through April 2012. The CDT counties were connected in a learning collaborative model to facilitate knowledge transfer, while counties assigned to IND implemented MTFC under usual conditions (e.g., without social learning and network development across counties). Randomization, allocation concealment, and procedures to minimize contamination across conditions are detailed elsewhere [7, 8].
Stages of implementation completion
The stages of implementation completion (SIC) measure [7, 29] was developed to provide qualitative and quanti-tative assessment of the time to achievement of a series of implementation stages. The initial development of the SIC occurred in the context of the CAL-40 random-ized implementation trial [7] and has been generalrandom-ized to many other settings [29]. In brief, the SIC is an observa-tional measure of eight stages used to assess the adoption
and delivery of the intervention protocol and the pro-portion and quality of activity completion within a series of defined implementation stages. The SIC can produce time-based milestone metrics, such as the highest stage achieved and time to stage achievement, along with rele-vant intervention specific outcomes (e.g., the number of families served). This measure was equally appropriate for counties in the IND and CDT conditions. Research staff collected dates relevant to the events and milestones out-lined in the SIC in an ongoing manner throughout the study, thus providing a complete tracking of which stages a county was in at each time [7, 29, 31].
Communication logs collected by implementation brokers During the trial, MTFC implementation brokers inter-acted by phone, email, and in person with the county service organizations to implement this new system of foster care assignments for at-risk children. All interac-tions were recorded and dated by the intervention brokers through digitized communication log notes they main-tained throughout the trial. These notes identified the county and what was the intent or what happened at each contact. Each occurrence generated a single or a few sen-tences and often included phrases rather than complete sentences. No instructions were provided to the imple-mentation brokers on how detailed these notes should be, nor was there an expectation that these notes would be used later for this automatic classifier.
Communication log processing and scrubbing
technology has been used before to facilitate the sharing of sensitive data between academic institutions [27, 38, 42].
Processing of individual log notes to formation of longitudinal state trajectories
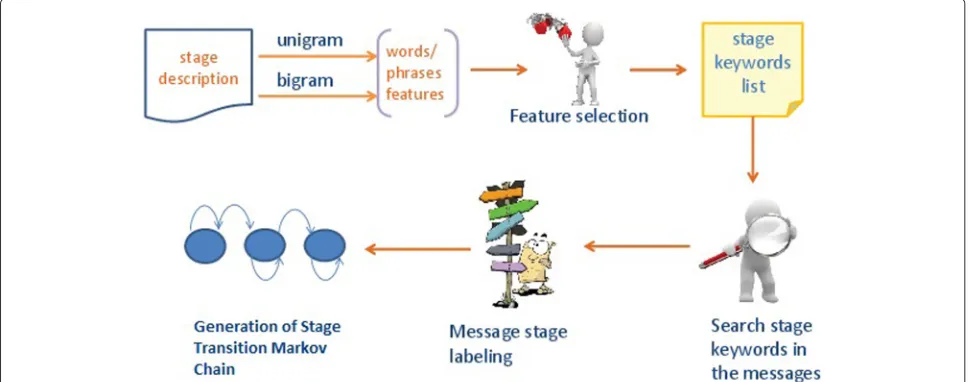
Figure 1 gives a broad overview of the steps used to identify keywords and phrases to build the automated classifier, provide probabilistic labeling of log notes, and produce summaries of each site’s stage transitions across time. Using text mining, we identify potentially important single keywords or unigrams, as well as two-word phrases, or bigrams, and potentially more complex features whose presence in an entry in a communication log is associ-ated with an implementation stage. From here on out, we refer to an entry in a communication log by the term “log note” or with a more general term “message.” A compu-tational procedure is used to determine an optimal set of these keywords, a step known as feature selection. Then, each log note is searched for these selected features and labeled into stages according to its probability assessment. The final step is to construct summary representations of these using Markov or other more complex modeling approaches.
Identification of keywords from the text and formation of the classification rule
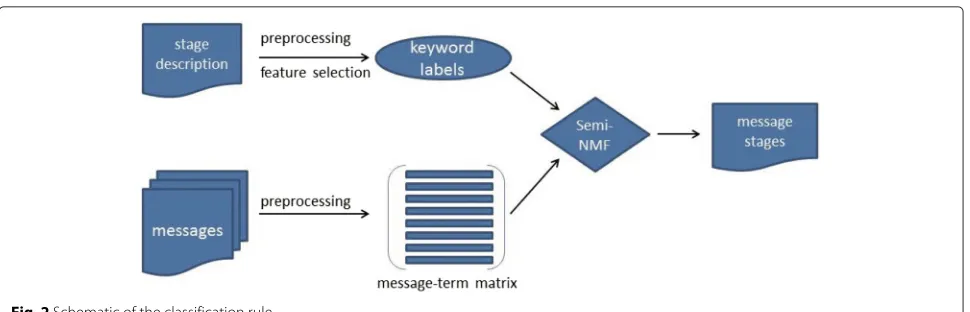
The key methodological challenge is to identify which words and phrases should be identified from a log note. This can be accomplished through steps illustrated in Fig. 2. Our text mining involves two sets of information. First, from the description of each stage, keywords per-taining uniquely to that stage are identified. Second, other potential unigrams or bigrams are identified based on log notes that are previously classified by experts as well as their frequency of their appearance. In the second row of
this figure, we count the occurrence of each of these key-words in each log note. A machine learning algorithm—a novel version of a semi-supervised non-negative matrix factorization (semi-NMF), which has shown superior per-formance to other alternatives—is used to determine probably stages for each log note.
The stage prediction problem considered in this paper has two important characteristics. First, the same log note may appear in multiple stages. Thus, instead of classify-ing each log note into a unique stage, we try to assign with a probability value the log note to each stage, where the probability values of the log note across the stages sum to 1. Second, log notes are classified independently across time and site. This temporal feature makes the stage assignment problem a natural fit for incremental classification; here, a new log note is processed for the probabilistic class assignment without referring to the probability values calculated for the previous log notes from the site.
Details on machine learning
Two sets of data are available as input for the training set. The first data set,Dstage, consists of the stage descriptions in text obtained from the published SIC measure, orga-nized as follows: let 1,. . .,Sbe the stages of the process. Then, Dstage is{Ai | i, 1 ≤ i ≤ S}, where for eachAi,
i, 1 ≤ i ≤ S, is a set of phrases/sentences that describe activities and events to occur in the stage i, e.g., “first study-initiated contact for pre-implementation” and “first county response to first contact for pre-implementation planning”. The second data set,Dlog, is the collection of log notes with known classification into stages based on a human expert. This matrix is organized as follows: letLbe the number of distinct adoption efforts (i.e., the number of distinct counties in which the brokers made an attempt for
Fig. 2Schematic of the classification rule
adoption). Then,Dlog= {Bi|1≤i≤L}, where for eachi,
1≤i≤L,Bicomprises the time-stamped log notes from
theith adoption effort. For eachi, 1≤i≤L,Biis a series
of pairs{(tij,mij)}Tj=i1, whereTiis the total number of log
entries classified in stageiand for eachj, 1≤j≤Ti,tijis
the date and time the activity/event took place andmijits
text, whereti1<· · ·<tiTi.
The two data sets are processed in order, first Dstage and thenDlog. The stage data setDstage is processed for keyword selection. This is a process for selecting a set of “words” that are likely to occur in stage descriptions of only one stage. Since a word can take different forms (e.g., a verb and its third person singular form or its gerund), the descriptions are first processed for “stemming”— stripping each “word” to its stem (e.g., “tak-” is the stem for “take,” “taking,” “took,” and so on). For this purpose, the Porter stemmer [28] method is used. After stemming, the stems with the aforementioned discriminating power are selected using feature selection techniques [24] (see Section Keyword labeling via feature selection for details). Based on the descriptions and the keywords, one may be tempted to generate a keyword-to-stage mapping matrix, whoseijentry represents the importance of theith key-word in the log notes for the stage j. However, noting that those who generate the descriptions are unlikely to be those who generate the log notes, the use of such a matrix may result in inaccurate prediction of stages. Rather, the proposed method calculates this importance through training.
The training set of log notes, Dlog, is processed with keywords extracted as auxiliary input after scrubbing as described above. LetK be the number of keywords thus extracted and let W = {w1,. . .,wK} be the keywords.
Each log note in Dlog is processed for stemming as in the same manner as inDstageand then the occurrence of each keyword is counted. This produces a keyword-count vector of dimensionK. After normalizing the entries by dividing the total count, each count vector is reduced to a real vector of dimension K in which the entries are
non-negative and the total of the entries sum to 1. By assembling theseK-dimensional normalized keyword fre-quency vectors as rows, an L×K non-negative matrix
X = (xij) is obtained, in which xij is the entry
corre-sponding to thejth keyword in theith log note. Next, the keywordsWand the occurrence matrixX are processed with non-negative matrix factorization for the purpose of factorizing each row ofX as a linear combination of the rows of a stage-keyword matrix with non-negative coefficients. In an ideal situation, the descriptions are suf-ficient to characterize distinctions among the stages and so the keywords chosen are sufficient for computation-ally distinguishing among the stages of the log notes with no additional human input. Unfortunately, this is not the case, and so an assumption is made that a small fraction of the log notes are already labeled with their correspond-ing stage IDs by a domain expert and the decomposition of the log note vectors is carried out using this additional piece of information as a guide in a “semi-supervised” manner, which will be described in detail in the next section.
Keyword labeling via feature selection
Once the description-term representation has been obtained, keyword selection is made using the max-relevance and min-redundancy framework as presented in [24]. Here, the keywords are selected in sequence, one after the other, until the number of selected keywords has reached a target number. At each step, a new keyword is chosen so as to (a) minimize the resemblance of the new keyword to the keywords chosen in the previous steps and (b) maximize the representation of the documents in the collection when any other other than the previously cho-sen keyword and the new keyword are removed. The idea can be formulated as an optimization problem as follows: Suppose that the task is to select a set of keywords in sequence for stagei. LetAibe the stage descriptions for
stageiand let Pi be the set of all unique words
we have already selected k− 1 keywords. LetWk−1 be the set of thesek−1 keywords. Thekth keyword shall be selected from the remaining candidates for keywords; i.e.,
Pi−Wk−1. The selection is made using the following for-mula from [24] that attempts to minimize the redundancy and to maximize concordance:
max
wq∈Pi−Wk−1 ⎛
⎝sim(wq;Pi)−
1
k−1
wp∈Wk−1
sim(wq;wp)
⎞ ⎠.
(1)
Here sim is the similarity that utilizes the cosine similar-ity function. The function sim utilizes the cosine similarsimilar-ity function. The cosine similarity of for two r-dimensional vectors(x1,. . .,xr)and(y1,. . .,yr)by
x1y1+ · · · +xryr
x21+ · · · +x2
r
y21+ · · · +y2
r
.
For similarity, the first entry sim(wq;Pi)compares the
vector consisting of the number of occurrences ofwqin
the documents ofAiand the vector consisting of the total
number of words in the documents of Ai (if Ai has m
documents, both arem-dimensional). The second entry compares such vectors forwpand forwq.
The computational complexity of this incremental selection isO(kPi).
Semi-supervised non-negative matrix factorization In the semi-supervised learning model employed, it is assumed that a fraction of the log notes and a fraction of the keywords are labeled, each with its correct stage num-ber. The label of a log note comes from a domain expert who is able to assert that it belongs to a unique stage. The label of a keyword comes from the feature extraction process; that is, each keyword that uniquely appears in a single stage is designated as the labeled keywords, with the number of the stage in which they uniquely appear being the stage label. While the proportion of stage-labeled log notes is a feature determined by our design, the propor-tion of the other is a parameter that can be determined based on the choice of the keywords. That is, if there are no such uniquely occurring keywords, the proportion is necessarily 0. Of course, not all the keywords with unique association with a single stage should be used for this purpose, since those who provide the descriptions can be different from those who leave the log notes. Thus, the uniquely occurring keywords may be used for multiple stages by the log note takers.
The non-negative matrix factorization here computes two non-negative matrices:Fof dimensionL×SandGof dimensionK×S. Each row ofFsums to 1 and for each
j, 1 ≤ j ≤ S, thejth entry of the row represents the cal-culated probability that the log note corresponding to the
row belongs to stagej. Each row ofGsums to 1 and for each j, 1 ≤ j ≤ S, the jth entry of the row represents the probability that the keyword corresponding to the row belongs to stagej.
LetF0be theL×Smatrix that represents the partially assigned labels of the log notes. That is, for each i, 1 ≤
i≤L, if theith log note is not part of the labeled data, the
ith row ofF0is all 0, and if theith log note is part of the labeled data and is labeled as stagej, 1≤j≤S, theith row ofF0is a vector in which thejth entry is 1 and all the other entries are 0. LetG0be theK×Smatrix similarly defined for the keywords. That is, for eachi, 1≤i≤K, if theith keyword is not part of the labeled data, theith row ofG0 is all 0, and if theith keyword is uniquely associated with stagej, 1≤j≤S, the row is all 0 except for thejth entry which is 1. LetC0be theL×Ldiagonal matrix in which theith diagonal entry is 1 if theith log note is part of the labeled data and 0 otherwise. Similarly, letC1be theK×K diagonal matrix in which theith diagonal entry is 1 if the
ith keyword is part of the labeled data and 0 otherwise. The semi-supervised non-negative matrix factorization to be done can be formulated as the following optimiza-tion problem:
min
F,H,G
X−FHGT2
+α·trace (F−F0)TC0(F−F0)
+β·trace (G−G0)TC1(G−G0), (2) whereFisL×S,GisK×, andHisS×Sare nonnegative real matrices.
Also, α > 0 and β > 0 are parameters, which are used to define the extent to whichF ≈ F0andG ≈ G0 are enforced, and H is an S ×S matrix that represents correlations among the stages. In general, involving these parameters make the model more generic and it allows certain flexibility. For example, in some cases, if the man-ually labels are not very accurate or ambiguous, we can set a smaller α orβ so that the final results are not depen-dent onF0orG0too much. In our experiments, since the human labeler is very confident with the labels, we set α andβ to be 1. The solution of the above optimization problem, the computational algorithm, and the proof the convergence of the proposed algorithm are listed in the Appendix.
Results
Here, we present a brief description of the input data and findings of this method as applied to the CAL-40 study.
Data description and preprocessing
Each log note is labeled by a project coordinator with a stage number, ranging from 1 to 8 as follows:
• Stage 1—Agreement to consider implementation
• Stage 2—Pre-implementation
• Stage 3—Recruitment plan and review
• Stage 4—Training schedule
• Stage 5—Developer/administrator call
• Stage 6—Clinical meeting
• Stage 7—Implementation review
• Stage 8—MTFC symposium and certification application
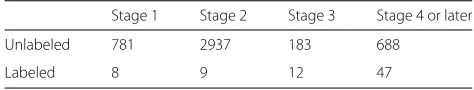
Of the 40 counties, 31 did not go beyond stage 3. The remaining 9 counties proceeded beyond stage 3. In addition to the 4589 log notes, we also used 76 stage description sentences which were incorporated into the log notes and used as the labeled data. Table 1 shows the detailed data distribution for labeled and unlabeled data. In the stage prediction experiments, we use four categories representing stages 1, 2, 3, and 4 or above.
As described in Section Keyword labeling via feature selection, a pre-designated number of keywords were selected to be used as labeled words. The number of keywords was chosen experimentally: we used a differ-ent number of keywords in the experimdiffer-ents and selected the solution producing the best results. Some typical key-words were “feasibility,” “pre-implementation,” “referral,” “initiate,” “certification,” etc.
Prediction accuracy
We use accuracy as the evaluation metric to compare the prediction performance of our non-negative matrix factorization-based classifier with other supervised learn-ers such as SVM and Naïve Bayes classifier. Accuracy was defined based on the proportion of correct classifications of the log notes.
Accuracy= Number_of_correct_predictions Total_number_of_log_notes
Number of keywords
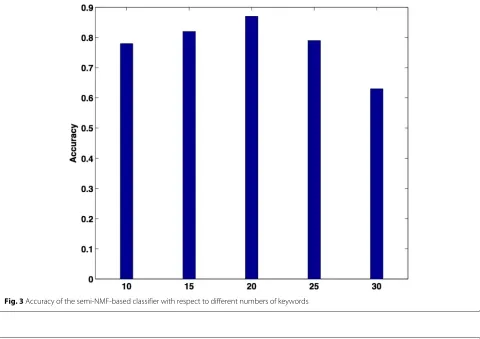
First, we compared the prediction accuracies using differ-ent numbers of keywords. From Fig. 3, we can see that 20 keywords produced the best prediction accuracy. Clearly, if the number of keywords is too small, there is not enough information carried by the keywords and so the accura-cies are low. Interestingly, it is not the case that the more keywords, the better results. The reason that the accuracy
Table 1Data distribution
Stage 1 Stage 2 Stage 3 Stage 4 or later
Unlabeled 781 2937 183 688
Labeled 8 9 12 47
peaks at 20 and then declines beyond 20 is perhaps that low-ranked keywords have the effect of confusing the classifiers.
Comparison of classification accuracy
For comparison, two alternative machine learning meth-ods are compared to the method we described in the previous section.
• Naïve Bayes: a Naïve Bayes classifier is a scalable and effective supervised learner.
• Support vector machines (SVM): SVM is one of the most widely used supervised learning model, and it is robust and effective to solve data classification problems [11]. In experiments, we use linear kernel which has been shown effective in text mining tasks.
• Semi-NMF: this does not reply on prior keyword knowledge. This uses partial log note labels in the aforementioned algorithm.
Figure 4 compares the accuracy of these three meth-ods. We observe that the semi-NMF with prior key-word knowledge model can produce 82.5 % in accuracy. It clearly outperforms SVM and Naïve Bayes classifiers because semi-NMF is a semi-supervised learner. The advantage of the method may also be in that it makes use of both labeled and unlabeled data for training a better model to predict the unknown labels.
Finding start and end dates of each stage
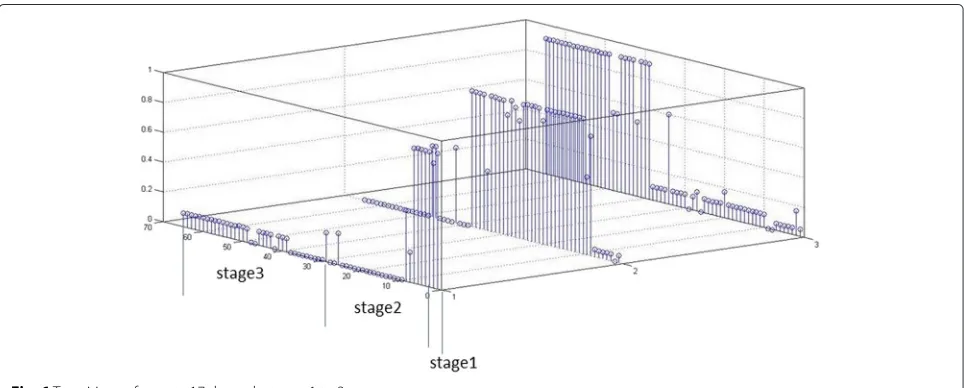
Since semi-NMF makes probabilistic assignments of log notes to stages, we can infer the start and end dates of a stage by detecting the change in the probabilities. Figure 5 shows the changes in the probability value of log notes being in stage 2 in the County 17 data. From the figure, we see that the probability suddenly increases on 6 Febru-ary 2008 and suddently decreases on 13 June 2008. It may be inferred from that County 17 may have be in stage 2 between 6 February 2008 and 13 June 13 2008. Comparing this to the human-labeled ground-truth (which is shown below the time axis in the figure), we find that 55 out of 65 log notes are correctly classified. Figure 6 shows the entire picture of the county 17 prediction.
As mentioned earlier, only nine counties arrived at stage 4 in the original implementation trial. By checking the pre-dicted stage label, we found that 7 of the 31 counties that had yet to reach stage 4 contained a log for which our clas-sifier asserted at least one log note was classified in stage 4. This results in an error rate of 7/31=22.6 % for stage 4 classification.
Transitions between states over time
Fig. 3Accuracy of the semi-NMF-based classifier with respect to different numbers of keywords
Fig. 5Example start and end date discovery on county 17 stage 2 data
Table 2 shows the confusion matrix generated using 120 samples covering stages 1–4. Overall accuracy is 83.3 %. While the accuracy in stages 3 and 4 appear lower than the other two, the performance on the first two appear high.
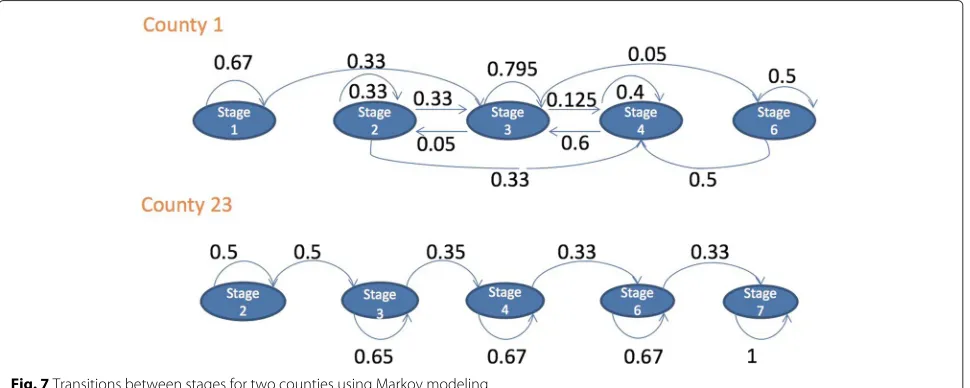
Ideally, these models produce estimates of remaining in a state or transitioning to another. Figure 7 shows widely different patterns of transition for two counties. County 1 is more likely than County 23 to remain in stage 1, based on its higher probability of 0.67 of remaining in stage 1 compared to that of County 23.
Discussion
For this proof of concept, we developed a computational approach for monitoring transitions of a health delivery system through identified stages of implementation. It relies on text information that can be collected readily and
used to provide feedback at appropriate levels from front line clinicians and facilitators to agency managers and to funding agencies. A novel semi-supervised machine learning algorithm was developed that used as input two types of information; the first involved text descriptions of each stage and the second consisted of log notes from an intermediary in which some were coded by a human expert. We provided brief illustrations of how such infor-mation could be used to provide summaries of implemen-tation progress involving single sites or comparisons of sites. Quantitatively, the accuracy of these automated clas-sifications has reached acceptable levels for a range of uses that we explored in the results section.
We recognize that some uses would likely require more accurate classifications. In particular, our over-projection of counties to have reached stage 4 suggests that in real
Table 2Confusion matrix
Classification results True labels
1 2 3 4
1 29 1 4 2
2 1 63 5 0
3 1 2 5 1
4 0 0 3 3
applications, there would need to be a tuning of the algorithm that takes into account to relative costs of omitted and committed classification errors. There are many possibilities for improving accuracy that we have not investigated yet. For example, our classifications of each log note are all done independently; combining the classifications across a proximal series of such notes can provide improved decision making, as we have demon-strated in another automated implementation project (Li, Y, Gallo, CG, Mehrotra, S, Liu, L, Brown, CH, Rec-ognizing emotion in speech for behavioral intervention studies, submitted). Furthermore, we have developed a general concept for using a long series of unobtrusive or lower quality measures involving complex human inter-actions and behaviors in place of highly accurate but costly measures observed by humans. These methodolog-ical approaches fall under the name of social systems informatics and can readily outperform human coding when large amounts of automatically coded data are available (Gallo, CG, Berkel, C, Mauricio, A, Sandler, I, Smith, JD, Villamar, JA, Brown, CH, Implementation Methodology from a Systems-Level Perspective: An Illus-tration of Redesigning the New Beginnings Program, in preparation).
We note several potential uses of this method. One challenge implementation scientists face is the successful scale up of effective interventions. The comparatively high
costs of human monitoring of implementation necessar-ily increase proportional to the number of sites involved when scaling up. But the costs of using a computational algorithm for automatic classification are virtually the same regardless of the number of sites, and the availability of additional log notes pertaining these sites should lead to improved classifications at a local level and more gen-eralizable knowledge as well. Monitoring of supervision and program fidelity could be aided by the methodology described here. In particular, a facilitator’s utterances can be transcribed computationally to text using existing tech-nology and used as input to an automated classification system [14]. Computational models characterizing the implementation process can be used as a guide for newly hired intervention delivery agents and serve to “alert” them to potential problems (i.e., drift) as defined by the intervention developer. A third challenging problem for implementation is to monitor and assist sites in sustaining the delivery of effective evidence-based programs espe-cially after federal or local funding ends. Indeed, many community-based organizations that are funded by local, tribal, state, or federal agencies are provided little fund-ing for infrastructure and therefore have limited capacity to detect or anticipate problems with the implementa-tion process or plan for long-term sustainment. Building a monitoring system that uses as input text from required reports of these organizations can be an ideal way to monitor steps they are taking (or not taking) towards sus-tainment throughout the grant period. Finally, such tools could be used as a first stage measure in randomized implementation trials [4, 6, 8, 22, 26, 37], backed up by a stratified sampling approach that adds more accurate human coding for large implementation evaluations.
This automated system is an example of a broader set of computational technologies that we believe could pro-vide important supports for successful implementation.
Brown and colleagues [5] describe a general model that identifies eight areas where computational and systems science methods can aid the scale up, dissemination, and sustainability of an effective program. These eight areas represent important points of entry where a technology, such as the proof of concept presented here. The compu-tational methods described by Gallo and colleagues [17] and Atkins and colleagues [2] can support the implemen-tation efforts of a service delivery agency. We note that Gallo and colleagues used computational linguistics and natural language programming to detect the component of “joining” from digitally recorded sessions of the Famil-ias Unidas program. The automatic detection of this key dimension of fidelity means that it is possible to shorten the time between when a session happens and the feed-back available for that session. Atkins and colleagues used computational linguistic methods to evaluate fidelity to motivational interviewing for a similar purpose.
Such a system could be scaled up with minimal effort and cost in several ways. First, that mimics the stage iden-tification in an implementation process typically rated observationally by a trained expert using the SIC. We make a bold assumption that to a large degree, the stage of implementation is represented in the words exchanged between the intervention developer and the intervention adopters and that pertinent information in these written exchanges can be recognized by an algorithm. The present study tests this assumption. The results of this proof of concept study support our assertion that the adoption and implementation process of an effective program can be supported through the use of computational science methods. We used a computational method where the communication log notes from a randomized implemen-tation trial of MTFC were used to successfully distinguish between implementation in the first three stages and beyond stage 4 of the SIC measure.
The work presented in this study is not intended to replace existing human monitoring of an implementation process. For those systems where expert implementa-tion specialists are monitoring key processes, and those where the SIC measurement system can be maintained, it is likely that they will continue being used effectively. There may be opportunities for blended systems where a first level automated system can focus human attention where needed. We envision computational methods exist-ing synergistically alongside human ratexist-ings to increase efficiency and reduce costs by analyzing large amounts of easy to collect data in an ongoing manner. There is also a great benefit in using quality measurements such as the SIC to specify the distinct stages relevant to an implemen-tation strategy. We foresee greater use of such measures as the SIC now that a Universal SIC is being developed [33].
Addressing this challenge is of particular importance for consumers of effective programs, like federal and state
service delivery agencies, as well as developers and pro-moters of effective interventions. Service delivery agen-cies commit resources in the adoption of an effective intervention expecting improved health outcomes for the people in the communities they serve. This is especially true given the proven success of programs based on pre-viously completed efficacy and effectiveness studies.
There are multiple potential applications of this method in HIV prevention that can be used by public health agen-cies and community-based health centers. For instance, public health departments who fund implementation of evidence-based prevention interventions across multiple sites often require routine progress reports to monitor implementation and achievement of health outcomes. This method could facilitate the monitoring of imple-mentation and decrease the time to review reports, thus allowing for closer to real-time feedback on program improvements.
Many community-based health centers clinics through-out the country are in the early stages of implementation of pre-exposure prophylaxis (PrEP), a medication with demonstrated impact on preventing HIV infection. Auto-mated monitoring of the progress of implementing PrEP within these community-based organizations as they are monitored by local public health departments could pro-vide one important application of the method propro-vided here. Also, these methods could be applied to individ-ual case notes. For example, computational methods that perform linguistic mining of notes in electronic medical records can also facilitate the monitoring of an individ-ual client’s progression along the PrEP continuum of care, routine clinical follow-up and monitoring, and adher-ence to PrEP medication. This method could also provide real-time feedback to program implementers of potential threats to adherence that could be prevented with timely information.
Our proof of concept had several limitations. Since our work only involving a single implementation study of MTFC measured by the SIC, we cannot be certain that this procedure will work with other measurement systems. With Saldana and colleagues’ development of a Universal SIC [33], the methods developed here will need to be fine-tuned for application across programs beyond this particular evidence-based program. Secondly, what successes this algorithm has had dependeds on the dis-tinctness of the stages, sufficient consistency in the way that the log notes are produced, and the quality and quan-tity of human coding of a portion of the log notes. Little information is available to guide others in deciding the magnitude of these important factors.
Conclusions
is of paramount concern for implementation scientists, policy makers, and practitioners [1, 3]. Federal and state agencies that invest in programs of research to develop effective programs, healthcare delivery systems charged with delivering the best available care, and the con-sumers and beneficiaries of such programs are also highly invested in supporting the adoption and implementation of effective programs. These agencies often do not have the capacity to detect or anticipate problems with the implementation process.
Appendix
Computational algorithm
To solve the optimization problem in Eq. 2 the following update rules adapted from [12] can be used.
• Construct anL×SmatrixFby setting for eachi,
1≤i≤L, and for eachj,1≤j≤S,
Fij ←Fij (
XGHT+αC0F0)ij
(FFTXGHT+αC
0F)ij
, (3)
and then setF toF.
• Construct anS×SmatrixHby setting for eachi,
1≤i≤S, and for eachj,1≤j≤S,
Hij ←Hij (
FTXG)ij
(FTFHGTG)ij, (4)
and then setH toH.
• Construct aK×SmatrixGby setting for eachi,
1≤i≤K, and for eachj,1≤j≤S,
Gij←Gij (
XTFH+βC1G0)ij
(GGTXTFH+βC
1G)ij
. (5)
and then setG toG.
The algorithm consists of an iterative procedure using the above update rules until convergence. The detail pro-cedure is shown in Algorithm 1.
Algorithm 1Iterative algorithm
Input: X : nonnegative message-term matrix
K : the number of stages
Output: F : message stage indicator matrix
G : term stage indicator matrix
1: Initialize F = F0; G = G0; H = (FTF)−1FTXG(GTG)−1.
2: repeat
3: UpdateFusing Eq. (3); 4: UpdateGusing Eq. (5); 5: UpdateHusing Eq. (4);
6: until converges.
Algorithm correctness and convergence
Updating F, G, andH using the rules above leads to an asymptotic convergence to a local minima. This can be proved using arguments similar to (Ding et al. 2006). We outline the proof of correctness for updatingFsince the squared loss term that involveF is a new component in our models.
TheoremAt convergence, the solution satisfies the Karuch, Kuhn, Tucker optimality condition (KKT condi-tion, for short), i.e., the algorithm converges correctly to a local optimum.
Proof of the Theorem 1 Following the theory of con-strained optimization (Nocedal and Wright, 1999), we minimize the following function
L(F) = X−FHGT2+α·trace[(F−F0)TC0(F−F0)]
+β·trace[(G−G0)TC1(G−G0)]
Note that the gradient of L with respect to F is,
∂L
∂F = −2XGH
T+2FHGTGHT+2αC1(F−F0). (6)
and a similar relation holds for G.
The KKT complementarity condition for the nonnegativ-ity of Fik gives
[−2XGHT+FHGTGHT+2αC0(F−F0)]ikFik =0. (7)
This is the fixed point relation that local minima for F must satisfy. Given an initial guess of F, the successive update of F using Eq. (3) will converge to a local minima. At convergence, we have
Fik =Fik (XGH
T+αC
0F0)ik
(FFTXGHT+αC
1F)ik
.
which is equivalent to the KKT condition of Eq. (7). The correctness of updating rules for G in Eq. (5) and H in Eq.(4) have been proved in [12]. Note that we do not enforce exact orthogonality in our updating rules since this often implies less accurate class assignments.
Acknowledgements
We thank the National Institute on Drug Abuse for their support. We are also grateful for the contributions from Drs. Patricia Chamberlain and Lisa Saldana and Ms. Courtenay Padgett for providing these data and suggestions. The content of this paper is solely the responsibility of the authors and does not necessarily represent the official views of the funding agencies.
Funding
This research was supported by the following grant: P30 DA027828, NIDA, U.S. PHS (PI: Brown).
Availability of data and materials
Authors’ contributions
CHB initiated the work. DW and MO developed the algorithm. CG conducted the data scrubbing. NB and CG provided information on applications to HIV. All authors wrote sections and reviewed and approved the manuscript.
Competing interests
The authors declare that they have no competing interests.
Consent for publication
The authors consent for this paper to be published.
Ethics approval and consent to participate
This project was approved by the IRB of the Oregon Social Learning Center and approved at Northwestern University as non-human research with a dataset that was scrubbed of identifiers.
Author details
1Department of Computer Science, Florida Atlantic University, 777 Glades
Road EE 403, Boca Raton, FL, USA.2Department of Computer Science and
Center for Computational Science, University of Miami, 1320 S. Dixie Highway, Miami, FL, USA.3Center for Prevention Implementation Methodology,
Department of Psychiatry and Behavioral Sciences, Feinberg School of Medicine Northwestern University, 750 N. Lake Shore Dr., Chicago, IL, USA.
4Department of Health Policy and Management, University of North Carolina,
Chapel Hill, 135 Dauer Drive, Chapel Hill, NC, USA.
Received: 18 November 2015 Accepted: 28 July 2016
References
1. Aarons GA, Hurlburt M, Horwitz SM. Advancing a conceptual model of evidence-based practice implementation in public service sectors. Adm Policy Mental Health Mental Health Serv Res. 2011;38(1):4–23. 2. Atkins DC, Steyvers M, Imel ZE, Smyth P. Scaling up the evaluation of
psychotherapy: evaluating motivational interviewing fidelity via statistical text classification. Implement Sci. 2014;9(1):49.
3. Brown CH, Chamberlain P, Saldana L, Wang W, Padgett C, Cruden G. Evaluation of two implementation strategies in fifty-one counties in two states: results of a cluster randomized implementation trial. Implement Sci. 2015;9:134.
4. Brown CH, Liao J. Principles for designing randomized preventive trials in mental health: an emerging developmental epidemiology paradigm. Am J Commun Psychol. 1999;27(5):673–710.
5. Brown CH, Mohr DC, Gallo CG, Mader C, Palinkas L, Wingood G, Prado G, Kellam SG, Pantin H, Poduska J, et al. A computational future for preventing hiv in minority communities: how advanced technology can improve implementation of effective programs. J Acquir Immune Defic Syndr. 2013;63(01):S72.
6. Brown CH, Ten Have TR, Jo B, Dagne G, Wyman PA, Muthén B, Gibbons RD. Adaptive designs for randomized trials in public health. Annu Rev Public Health. 2009;30:1.
7. Chamberlain P, Brown CH, Saldana L. Observational measure of implementation progress in community based settings: the stages of implementation completion (sic). Implement Sci. 2011;6(1):1–8. 8. Chamberlain P, Brown CH, Saldana L, Reid J, Wang W, Marsenich L,
Sosna T, Padgett C, Bouwman G. Engaging and recruiting counties in an experiment on implementing evidence-based practice in california. Adm Policy Mental Health Mental Health Serv Res. 2008;35(4):250–60. 9. Chamberlain P, Brown CH, Saldana L, Reid J, Wang W, Marsenich L,
Sosna T, Padgett C, Bouwman G. Engaging and recruiting counties in an experiment on implementing evidence-based practice in california. Adm Policy Mental Health Mental Health Serv Res. 2008;35(4):250–60. 10. Chamberlain P, Saldana L. Scaling up treatment foster care oregon: a
randomized trial of two implementation strategies In: Van Ryzin MJ, Kumpfer KL, Fosco GM, Greenberg MT, editors. Family-based prevention programs for children and adolescents: theory, research, and large-scale dissemination. New York: Psychology Press; 2015. p. 186–201.
11. Cortes C, Vapnik V. Support vector networks. Mach Learn. 1995;20(3):273–97. 12. Ding C, Li T, Peng W, Park H. Orthogonal nonnegative matrix
tri-factorizations for clustering. In: Proceedings of the 12th, ACM SIGKDD International Conference on Knowledge Discovery and Data Mining,
KDD ’06. Philadelphia, PA: Association for Computing Machinery; 2006. p. 126–35.
13. Fixsen DL, Naoom SF, Blase KA, Friedman RM. Implementation research: a synthesis of the literature. Tampa, FL: Tampa Florida University of South Florida Louis de la Parte Florida Mental Health Institute National Implementation Research Network; 2005.
14. I. of Medicine (IOM) and N. R. C. (NRC). Strategies for scaling tested and effective family-focused preventive interventions to promote children’s cognitive, affective, and behavioral health: workshop in brief: Washington, DC; 2014.
15. Fosco GM, Seeley JR, Dishion TJ, Smolkowski K, Stormshak EA, Downey-McCarthy R, Falkenstein CA, Moore KJ, Strycker LA. Lessons learned from scaling up the ecological approach to family interventions and treatment program in middle schools. In: Handbook of school mental health. Springer; 2014. p. 237–51.
16. Gallo C, Pantin H, Villamar J, Prado G, Tapia M, Ogihara M, Cruden G, Brown CH. Blending qualitative and computational linguistics methods for fidelity assessment: experience with the familias unidas preventive intervention. Adm Policy in Mental Health Mental Health Serv Res. 2015;42(5):574–85.
17. Gallo C, Pantin H, Villamar J, Prado G, Tapia M, Ogihara M, Cruden G, Brown CH. Blending qualitative and computational linguistics methods for fidelity assessment: experience with the familias unidas preventive intervention. Adm Policy Mental Health. 2015;42(5):574–85. 18. Hansen WB, Berkel C, McBride Murry V, Roulston KJ, Brody GH.
Understanding the art and science of implementation in the saaf efficacy trial. Health Educ. 2013;113(4):297–323.
19. Horwitz SM, Chamberlain P, Landsverk J, Mullican C. Improving the mental health of children in child welfare through the implementation of evidence-based parenting interventions. Adm Policy Mental Health Mental Health Serv Res. 2010;37(1-2):27–39.
20. Kitzman HJ, Cole R, Yoos HL, Olds D. Challenges experienced by home visitors: a qualitative study of program implementation. J Commun Psychol. 1997;25(1):95–109.
21. Korfmacher J, O’Brien R, Hiatt S, Olds D. Differences in program implementation between nurses and paraprofessionals providing home visits during pregnancy and infancy: a randomized trial. Am J Public Health. 1999;89(12):1847–51.
22. Landsverk J, Brown CH, Reutz JR, Palinkas L, Horwitz SM. Design elements in implementation research: a structured review of child welfare and child mental health studies. Adm Policy Mental Health Mental Health Serv Res. 2011;38(1):54–63.
23. Leve LD, Fisher PA, Chamberlain P. Multidimensional treatment foster care as a preventive intervention to promote resiliency among youth in the child welfare system. J Personal. 2009;77:1869–902.
24. Liu H, Motoda H. Feature selection for knowledge discovery and data mining, volume 454. New York: Springer Science & Business Media; 2012. 25. Olds DL, Hill PL, O’Brien R, Racine D, Moritz P. Taking preventive
intervention to scale: the nurse-family partnership. Cogn Behav Pract. 2003;10(4):278–90.
26. Palinkas LA, Holloway IW, Rice E, Brown CH, Valente TW, Chamberlain P. Influence network linkages across implementation strategy conditions in a randomized controlled trial of two strategies for scaling up
evidence-based practices in public youth-serving systems. Implement Sci. 2013;8(133):1–11. BioMed Central Ltd.
27. Pisani AR, Wyman PA, Mohr DC, Perrino T, Gallo C, Villamar J, Kendziora K, Howe GW, Sloboda Z, Brown CH. human subjects protection and technology in prevention science: selected opportunities and challenges: Prevention Science; 2016, pp. 1–14.
28. Porter MF. An algorithm for suffix stripping. Program. 1980;14(3):130–7. 29. Saldana L. The stages of implementation completion for evidence-based
practice: protocol for a mixed methods study. Implement Sci. 2014;9(1):43. 30. Saldana L, Chamberlain P. Supporting implementation: the role of
community development teams to build infrastructure. Am J Commun Psychol. 2012;50(3-4):334–46.
31. Saldana L, Chamberlain P, Wang W, Brown C. Predicting program start-up using the stages of implementation measure. Admin Policy Mental Health Mental Health Serv Res. 2012;39(6):419–25. 32. Saldana L, Chamberlain P, Wang W, Brown CH. Predicting program
33. Saldana L, Schaper H, Campbell M, Chamberlain P. Web-based feedback to aid successful implementation: the interactive stages of
implementation completion tool. In: The title of the book. Seattle, WA: Paper presented at the 3rd Biennial Meeting of the Society for Implementation Research Collaboration; 2015.
34. Sanders MR. Development, evaluation, and multinational dissemination of the triple p-positive parenting program. Annu Rev Clin Psychol. 2012;8: 345–79.
35. Schoenwald S, Garland A, Chapman J, Frazier S, Sheidow A, Southam-Gerow M. Toward the effective and efficient measurement of implementation fidelity. Admin Policy Mental Health Mental Health Serv Res. 2011;38(1):32–43.
36. Spoth R, Guyll M, Lillehoj CJ, Redmond C, Greenberg M. Prosper study of evidence-based intervention implementation quality by
community–university partnerships. J Commun Psychol. 2007;35(8): 981–99.
37. Spoth R, Rohrbach LA, Greenberg M, Leaf P, Brown CH, Fagan A, Catalano RF, Pentz MA, Sloboda Z, Hawkins JD, et al. Addressing core challenges for the next generation of type 2 translation research and systems: the translation science to population impact (tsci impact) framework. Prev Sci. 2013;14(4):319–51.
38. Squicciarini A, Bhargav-Spantzel A, Czeskis A, Bertino E. Traceable and automatic compliance of privacy policies in federated digital identity management. In: Privacy Enhancing, Technologies. Berlin and Heidelberg, Germany: Springer-Verlag; 2006. p. 78–98.
39. Szapocznik J, Duff J, Schwartz S, Muir J, Brown C. Brief strategic family therapy treatment for behavior problem youth: theory, intervention, research, and implementation In: Sexton T, Lebow J, editors. Handbook of family therapy: the science and practice of working with families and couples. Routledge: Abingdon; 2015.
40. Wang W, Saldana L, Chamberlain P, Brown C. To proceed or not to proceed: predicting implementation success. In: 4th Annual NIH Conference on the Science of Dissemination and Implementation. Washington, DC: National Institutes of Health and Academy Health; 2011. 41. Webb EJ, Campbell DT, Schwartz RD, Sechrest L. Unobtrusive measures: nonreactive research in the social sciences. Chicago: Rand McNally; 1966. 42. Winkler WE. Data cleaning methods. In: Proceedings ACM SIGKDD
workshop on data cleaning, record linkage, and object consolidation. Washington, D.C.: American Computing Machinery; 2003.
• We accept pre-submission inquiries
• Our selector tool helps you to find the most relevant journal
• We provide round the clock customer support
• Convenient online submission
• Thorough peer review
• Inclusion in PubMed and all major indexing services
• Maximum visibility for your research
Submit your manuscript at www.biomedcentral.com/submit