An Efficient Approach for the Classification of
Medicinal Leaves using BFO and FRVM
V Padma Supriya M.E.
Dept. of Electronics and Instrumentation Engg.
National Engineering College, Kovilpatti, Tamil Nadu-628 503, Email: [email protected] Dr.S.Manikandan M.E.., Ph.D
Professor
Dept. of Bio medical Engineering
Saveetha Engineering College, Thandalam Chennai – 602 105, Email: [email protected] Dr.T.Ramakrishnan M.E.., Ph.D
Assistant Professor (S.G)
Dept. of Electronics and Instrumentation Engg.,
National Engineering College, Kovilpatti, Tamil Nadu-628 503, Email: [email protected] Dr. P.Radha M.Sc., Ph.D
Research Officer (Botany) Siddha Clinical Research Unit (SCRU)
Government Siddha Medical College Campus, Palayamkottai, Tamil Nadu-627002 (Central Council for Research in Siddha- CCRS, Ministry of AYUSH, Govt of India)
Email: [email protected] ---ABSTRACT---Herbal plants have been used for medicinal purposes since the ages. These plants also play a major role in medicines, food, perfumes and cosmetics. At present, the identification of herbal plants is purely based on the human perception of their knowledge. It may be probability of human error occurring. An efficient herb species classification system should be automatic and a convenient recognition of herbal plants which reduces the human error. The present research aims to predict the herbal plants in a very convenient and accurate way. This approach is based on the leaf shape, texture, color and its feature. Bacteria Foraging Optimization (BFO) for feature selection and Fuzzy Relevance Vector Machine (FRVM) for the classification of herbal plants are used in the proposed system. The data required for classification are computed using the MATLAB software. In the present work, ten different types of herbal leaves and twenty samples of each have been considered for the process and the classification accuracy is achieved as maximum with an efficient intelligence technique. The efficiency of the proposed method of classifying the different herbal plants gives better performance.
Keywords – Detection, GLCM texture feature extraction, BFO, FRVM classifier.
--- Date of Submission: May 21, 2019 Date of Acceptance: June 13, 2019 ---
I.
INTRODUCTION
M
edicinal plants are considered as a rich resources of ingredients which can be used in different medicinal system which required detecting and identifying the different kind of medicinal plants. The leaves of the medicinal plants play a vital role in the human life. Leaf recognition is very demanding in medicinal and agricultural fields. In present scenario, the World Health Organization (WHO) encouraging the developed countries to use herbal medicines. The use of herbs has been increased in many countries such as India and China and also greatly in Western countries. For efficient usage of herbs, identification of species is an important aspect especially using the leaf character as a key. Thus, present study is aimed to identify the leaves using soft computing techniques in MATLAB. Leaves of different medicinal plants are collected from Palayamkottai, Tamil Nadu and scanned image of the leaves are stored in JPEG format. The analyses of the medicinal leaves are done by using the image processing technique. The proposed approach canbe used to classify different types of leaves using different features.
II.
L
ITERATURE SURVEYOrientations Gradients (PHOG) which is a spatial pyramid extension of the histogram of gradients. Then the local model has been extracted from manifold. Chaki and Parekh [3] proposed plant leaf recognition using texture and shape features with neural classifiers. Texture of the leaf is exhibited using Gabor filter and Gray Level Co-occurrence Matrix (GLCM). The shape of the leaf is captured using a set of curvelet transform. The preprocessing step is applied to feature extraction to make corrections for varying translation, rotation and scaling factors. There are two classifiers such as Neuro- Fuzzy Controller (NFC) and feed- forward back-propagation, Multi-Layered Perceptron (MLP). Aakif and Khan [4] proposed automatic classification of plants using leaves. They used three steps such as for classification has preprocessing, feature extraction and classification. Leaf features are morphological features and Fourier descriptors which are newly proposed shape-defining features. These extracted features become the input vector of the Artificial Neural Network (ANN) with back propagation. The accuracy achieved was good compared with another classifier. Sinan Kayaligil and Tulin Inkaya [5] proposed the ant colony optimization-based clustering methodology. The author focused on spatial clustering. The number of clusters is unknown and clusters may have arbitrary shapes and density differences. They introduced novel based clustering methodology based on ant colony optimization and yield a set of non- dimensional solutions. The execution time is relatively higher. Mohammad Ali Jan Ghasab and Shamsul Khamis [6] proposed feature decision making ant colony optimization for an automated recognition of plant species. The input features are extracted based on shape, morphology, texture and color. The extracted features are given as an input to Ant Colony optimization (ACO) which acts as a feature decision making algorithm used for recognition of different species through its leaf images. The selected features are given as input to Support Vector Machine (SVM) for classifying the species. The drawbacks of SVM classification technique is that it lacks in transparency, lacks in choosing the type of kernel for processing, and SVM is slow in training and testing the features. Vijayalakshmi and Vasudev Mohan [7] proposed the classification of medicinal plant leaves using texture, shape and color properties. An original plant leaf is pre-processed initially, using the cellular automata filter to minimize the noise. For enhancing the contrast and quality of the image, the histogram equalization and ROI segmentation are applied respectively. The GLCM and LBP systems are introduced for the extraction of feature. In this paper, the feature comprises of Haralick texture-based feature, Gabor features, shape features and color features. The features are extracted from each leaf image, which increases the time complexity, the kernel based PSO is presented to overcome the above issue of selecting the optimum features. Finally, the Fuzzy Relevance Vector Machine is employed to characterize the type of leaves. The experimental analysis showed better results. Thus, in the proposed method, the Fuzzy- Relevance Vector Machine (FRVM) based classification is employed. This FRVM
classifier is a popular method used for classification leaves, legume leaves and in agriculture field which offers some benefits over the SVM [8-10].
III.
MATERIALS
AND
METHODOLOGY
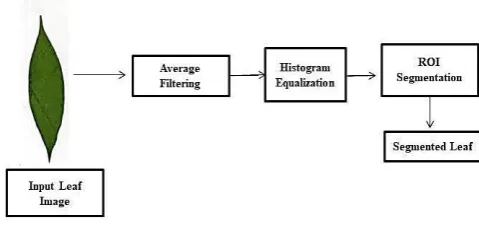
Leaves of the medicinal plants in various stages have been collected from Palayamkottai and identified. The work is initiated with the collection of leaves from data bases and real time images. The overall block diagram of the proposed method is shown in Fig. 1
Fig. 1 Overall block diagram of the proposed methodology The proposed method has the following four stages:
Preprocessing and segmentation. Feature Extraction.
Feature Selection. Classification.
3.1 Preprocessing and segmentation
The collected leaf images are required the preprocessing steps due to noise obtained during the image acquisition. The leaf images are obtained from standard environmental situations, which distract the excellence of the image. In this work, the noises present in the herbal plants images are removed using average filter. This step is applied to minimize the degradation due to noise. Figure 2 illustrate the flow chart of preprocessing stage.
Fig. 2 Flow chart of the preprocessing stage
segmentation. This process is employed to separate the Region of Interest (ROI) of the leaf from its background. It is usually determined on the basis of pixel intensity values or user determined areas. The segmentation process of a leaf image is a challenging task due to the presence of distinct regions of texture and color with varying backgrounds.
3.2 Feature Extraction
Generally, the leaf images are varying with its shape, color, vein arrangement(venation) and texture. So, the processed images are evaluated using several features like texture, shape and color features.
3.2.1 Texture Features
The texture feature is extracted using GLCM (Gray Level Co-occurrence Matrix). Gray-level spatial co-occurrence matrix 𝑝(i, j) based features are defined as second order histogram-based features. These features are based on the joint probability distribution of pairs of pixels. Texture features can be described using this co-occurrence matrix. The parameters considered for texture features are Contrast, Homogeneity, Correlation, Energy and Entropy.
Contrast:𝐶 = ∑𝐺−1𝑖=0 ∑𝐺−1𝑗=0(𝑖 − 𝑗)2𝑃[𝑖, 𝑗] (1) Homogeneity:∑ ∑ 𝑃[𝑖,𝑗]
1+|𝑖−𝑗| 𝐺−1 𝑗=0 𝐺−1
𝑖=0 (2)
Energy:𝐸 = ∑𝐺−1𝐼=0∑𝐺−1𝑗=0[𝑝(𝑖, 𝑗)]2 (3) Correlation:𝑅 = ∑ ∑ 𝑖𝑗𝑝(𝑖,𝑗)−𝜇𝑥𝜇𝑦
𝜎𝑥𝜎𝑦
𝐺−1 𝑗=0 𝐺−1
𝑖=0 (4) Entropy:𝐻 = − ∑𝐺−1𝑖=0∑𝐺−1𝑗=0𝑝(𝑖, 𝑗)𝑙𝑜𝑔2[𝑝(𝑖, 𝑗)] (5) 3.2.2 Shape Features
The shape features of the proposed system are the area, centroid, eccentricity, equivalent diameter, extent, major axis length, minor axis length and perimeter. The values are computed based on shape feature extraction by applying the shape-based features for a single leaf using the Region props. The major axis length can be measured as the major axis passes through the center of mass of the object corresponding to the minimum rotational energy of the shape. The minor axis length can be measured as the minor axis passes through the center of mass of the object and is always perpendicular to the major axis.
Area: 𝐴 = ∑ 𝑎𝑝 (6) Centroid: 𝐶𝑥= ∑ 𝐶∑ 𝐴𝑖𝑥 ∑ 𝐴𝑖
𝑖 , 𝐶𝑦 =
∑ 𝐶𝑖𝑦 ∑ 𝐴𝑖
∑ 𝐴𝑖 (7) Eccentricity:𝑒 =sin 𝛼
sin 𝛽 , 0 < 𝛼 < 90𝑜, 0 ≤ 𝛽 ≤
90𝑜 (8)
Equivalent diameter: 𝑋𝐴= √4𝐴
𝜋 (9)
Extent: 𝜀 = Δ𝑛𝑖
𝜈𝑖 (10)
Perimeter: 𝑃 = 𝜋
𝑁∑ 𝐼𝜋𝛼 𝛼𝑑𝑙 (11)
where, ∑ 𝑎𝑝is the sum of each individual pixel value, 𝐶𝑖𝑥, 𝐶𝑖𝑦 are the distance to the local centroid from the x and y axis, 𝛼 is the angle between the cone's slant
generator and the horizontal, 𝛽 is the angle between the plane and the horizontal, A is the area, 𝑋𝐴 is the area-equivalent diameter, Δ𝑛𝑖= number of equilibrium difference the number of initial of an image, 𝜈𝑖 is the weight, 𝐼𝛼 is the number of intercepts, 𝑑𝑙 is the series of parallel lines with spacing.
3.2.3 Color Features
The color histograms and color co-occurrence matrices are used for evaluating the similarity between two leaf images. The color spaces are used for creating the color histograms. Each color is characterized as a mixture of the three primary color channels (Red, Green and Blue) in the RGB color space. The RGB color space is converted into the HSV (Hue, Saturation and Intensity) color model, which separates the intensity from the chromaticity. Six color features are employed in the proposed work:
Mean and standard deviation for H colour space Mean and standard deviation for S colour space Mean and standard deviation for V colour space Moments are calculated for each of these channels in an image. We will define the 𝑖𝑡ℎ color channel at the 𝑗𝑡ℎ image pixel as𝑃𝑖𝑗. The three color moments can be defined as:
Mean: 𝐸𝑖 = ∑ 1 𝑁 𝑖=1
𝑁 𝑃𝑖𝑗 (12)
Standard Deviation: 𝜎𝑖= √(1
𝑁 ∑ (𝑃𝑖=1𝑁 𝑖𝑗 − 𝐸𝑖)2) (13) 3.2.4 Feature selection
In machine learning and statistics, feature selection is also known as variable selection. In this process is selecting a subset of relevant features (variables, predictors) for use in model construction. Feature selection techniques are used for three reasons:
• Simplification of models to make them easier to interpret by researchers/ users,
• Shorter training times,
• Enhanced generalization by reducing over fitting (formally, reduction of variance).
Feature selection techniques should be distinguished from feature extraction. A feature selection algorithm can be seen as the combination of a search technique for proposing new feature subsets, along with an evaluation measure which scores the different feature subsets. This work implemented Bacteria Foraging Optimization (BFO) based feature selection.
3.2.4.1 Bacteria Foraging Optimization
mimicking chemo taxis movement of virtual bacteria in the problem search space.
In BFO, the position updating which simulates the chemo taxis procedure is used in equation (15), 𝜃𝑖𝑡 presents the position of the 𝑖𝑡ℎ bacteria in the 𝑡𝑡ℎ chemo taxis step. 𝑐(𝑖) is the step length during the 𝑖𝑡ℎ chemo taxis. 𝜙(𝑖) is a unit vector which stands for the swimming direction after a tumble. It can be generated by equation (16), where Δ𝑖 is a randomly produced vector with the same dimension of the problem:
𝜃𝑖𝑡+1= 𝜃𝑖𝑡 + 𝐶(𝑖)𝜙(𝑖) (15)
𝜙(𝑖) = Δ𝑖 √Δ𝑇𝑖Δ𝑖
(16) Pseudo code for Bacteria Foraging Optimization
Initialization For i=1: 𝑁𝑒𝑑
For j=1: 𝑁𝑟𝑒 For k=1: 𝑁𝑐
For n=1:S j last =j(n)
Generate a tumble angle for bacterium n; Update the position of bacterium n by (15); Recalculate the j(n)
m=0
While (m < 𝑁𝑠) If j(n) < j last
J last =j(n);
Run one more step using (15); Recalculate the j(n);
m=m+1; Else
m=𝑁𝑠; Else if End while End for
Sort the population according to j; For m=1: 𝑠⁄2
Bacterium(k + 𝑠⁄2 ) = Bacterium (k); End for
End for For l=1:s
If (rand < 𝑃𝑠)
Move bacterium l to a random position End if
End for End for
3.3 Classification
Classification includes a broad range of decision theoretic approaches to the identification of images.in this work, FRVM classifier is implemented in order to classify the herbal plants.
3.3.1 Fuzzy Relevance Vector Machine (FRVM) In this paper, the FRVM classifier is mainly used to classify the type of leaf images among the 10 categories of leaves. The FRVM classifiers are made to learn based on the training features and the labels are assigned to the leaf images using the machine learning techniques. The multi class RVM is used to train the classifier using the concepts of machine learning.
The machine learning is used for the classification of the types of plant leaf images. The classifiers are made to learn by assigning labels. The training features and the labels are given as input to the classifiers and effective leaf types are given as output by the classifiers.
RVM given a set of data{𝑎𝑖 , 𝑏𝑖}𝑖𝑛= 1, the output of RVM is illustrated as follows,
𝑏(𝑎) = ∑ 𝜈𝑖 𝑛
𝑖=1
𝑓(𝑎, 𝑎𝑖) + 𝜐0 (17) where, 𝑎𝑖 is the input vector and 𝑏𝑖 is their corresponding output. Herein, 𝜐 = [𝜐0, … . 𝜐𝑖] represents the weight vector and 𝑓(𝑎, 𝑎𝑖) denotes the kernel function. In RVM, Gaussian kernel is used as the encountered kernel, which is expressed as follows,
𝑓(𝑎, 𝑎𝑖) = 𝑒𝑥𝑝 [−‖𝑎− 𝑎𝑖‖
2
2𝜎2 ] (18)
Here, 𝜎 is the Gaussian kernel. The likelihood of the data set can be expressed using the formula,
𝑝(𝑏|𝜐, 𝜎2) = (2𝜋𝜎2)−𝑛2 𝑒𝑥𝑝 [− 1 2𝜎2 ‖𝑏 −
𝑝(𝑎𝑖)‖2]
(19) where, 𝑝(𝑎𝑖) = [1, 𝑓(𝑎𝑖, 𝑎1), 𝑓(𝑎𝑖, 𝑎2), … . . 𝑓(𝑎𝑖, 𝑎𝑛)] An explicit prior probability distribution over the weights to improve the generalized ability of RVM model, which is defined as follows,
𝑝(𝜐|𝑎) = ∏𝑛𝑖=1𝑁 (𝜐𝑖|0, 𝑎𝑖−1) (20) Thus, a classifier function of RVM can be expressed by,
𝑦(𝑎) = 𝜌′(𝑥)(∑ 𝑥𝜌(𝑎 𝑖) 𝑛
𝑖=1 ) (21) where x represents a hyper-parameter vector. The major advantage of RVM classification is that the size of a training feature improves its computational complexity. In the proposed method, the classification is performed using fuzzy based RVM. Some of the fuzzy rules are introduced in the proposed method to provide better classification results. The rules of FRVM are defined as 𝑅1, 𝑅2,……… 𝑅𝑛 denote the range of the training features.
𝑅1 : If 𝑡𝑓1 is within the range of 𝑡𝑓1 to 𝑡𝑓1𝐷 Then leaf = “Class 1 leaf”
𝑅2: If 𝑡𝑓2 is within the range of 𝑡𝑓2 to 𝑡𝑓2𝐷 Then leaf = “Class 2 leaf”
𝑅𝑛: If 𝑡𝑓𝑛is within the range of 𝑡𝑓𝑛 to 𝑡𝑓𝑛𝐷
Then leaf = Class 1 leaf+ Class 2 leaf+…..N number of
leaf.
IV.
RESULTS
AND
DISCUSSION
In this work, the ten different types of herbal plants were selected from various data bases and real time images. The leaf collected from the nature was dried and scanned to produce image for classification propose. Seven leaf images are collected from data bases [9] and three leaf images are collected in real time. The size of the input image is in 1150 450 pixels. Figure 3 shows the different types of herbal plants and its name.
Citrus lemon Aristolochia
indica
Ginkgo biloba
Vinca rosea
Nerium oleander Hibiscus
rosa-sinensis
Azardirachta
indica Lawsonia
inermis
Piper beetle
Fig.3 Different types of herbal plants
Nyctanthes arbor-tristis
The preprocessing step is applied to the input RGB image. The RGB image is then converted into gray scale image. Then average filter is applied to remove the unwanted noise. After removing the noise from gray scale image, for enhancing the image and to increase the contrast of the filtered image histogram equalization step. The histogram equalization is used to convert it into a binary image and the edge of the test leaf image is captured. By applying inverted binary process on the leaf image, the background will become zero and the leaf image alone will be represented. The next step is to separate the Region of Interest (ROI) of the leaf from its background. The ROI image is obtained by multiplying the binary image with original image. For extracting texture feature, the binary image is multiplied with RGB original image and for extracting the color feature binary image is multiplied with HSV. Figure 4 shown the preprocessing stages of an input image.
Fig. 4 (a) Original image (b) Filtered image (c) Histogram equalization (d) Binary image (e) Segmented image (f)
HSV image.
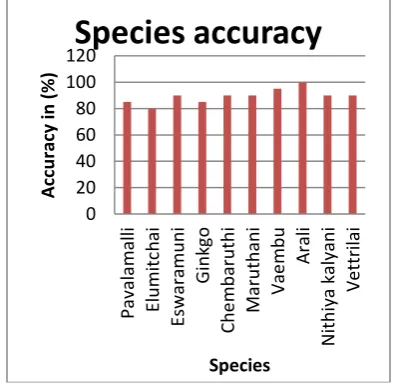
The color, texture and shape features are extracted from the preprocessed images and the minimum; maximum levels of each feature are tabulated in the following table1 and table 2. The extracted features are given for the feature selection process. In this stage, the bacteria foraging optimization algorithm selects the best 6 features from the extracted features. The BFO algorithm has selected the best features from shape, color and texture. The selected optimal features it is given for the classifier in order to recognize the type of leaf. After classifying with the help of proposed FRVM classifier, the maximum accuracy is obtained as 100% for Nerium and 93% for Vembu.
4.1 Performance Analysis
Performance analysis procedure was done by comparing the classification results to the target label. There are four values resulted from the validation procedure, True Positive (TP), False Positive (FP), True Negative (TN), False Negative (FN). For evaluation purpose, all the parameters are determined for each image in the data set. Sensitivity, Specificity, Error Rate, Positive Predictive Value, Negative Predictive Value and Accuracy are used as performance measures. Confusion matrix is a table that is often used to describe the performance of a classification model on a set of test data for which the true values are known. Table 3 shows the confusion matrix. The above classifier is done on ten samples and the accuracy is plotted in the graph as shown in the figure 5. Table 4 describes the value of the performance measures for all different leaf species.
Sensitivity = 𝑇𝑃
(𝑇𝑃+𝐹𝑁) (22)
Specificity = 𝑇𝑁
(𝐹𝑃 +𝑇𝑁) (23)
Error rate = (𝐹𝑃 +𝑇𝑁)𝑇𝑁 (24)
Positive Predictive Value = (𝑇𝑃+𝐹𝑃)𝑇𝑃 (25) Negative Predictive Value = (𝑇𝑁+𝐹𝑁)𝑇𝑁 (26) Accuracy = (𝑇𝑃+𝐹𝑃+𝑇𝑁+𝐹𝑁)𝑇𝑃+𝑇𝑁 (27)
(a) (b) (c)
Table 4. Performance measures for the ten species
Fig. 5 Accuracy Analysis
TABLE 1 Maximum and Minimum Value for Shape and Texture Features 0
20 40 60 80 100 120
Pa
v
al
a
m
al
li
E
lu
m
itc
h
ai
E
sw
ar
amu
n
i
G
in
k
g
o
Che
m
b
ar
u
th
i
Maru
th
an
i
Vae
m
b
u
Aral
i
N
ith
iy
a
ka
ly
an
i
Ve
tt
ri
lai
A
cc
u
rac
y
in
(
%
)
Species
Species accuracy
S.No. Parameters Value (%)
1 Classification Accuracy 98.6
2 Error rate 10.5
3 sensitivity 92
4 Specificity 98.3
5 Positive Predictive Value 84 6 Negative Predictive Value 97
Classes
Shape Texture
Area (cm) Perimeter Contrast Homogeneity
Max. Min. Max. Min. Max. Min. Max. Min.
Citrus limon (Elumitchai) 5678 5596 5484 5484 0.258 0.103 0.937 0.823
Aristolochia indica (Eswaramuni)
5913 5596
5484 5484 0.035 0.012 0.856 0.198
Ginkgo biloba (Ginkgo) 5604 1 5484 5484 0.176 0.057 0.949 0.889
Hibiscus rosa-sinensis
(Chembaruthi) 6423
1
5484 5484 0.289 0.125 0.937 0.878
Azadirachta indica (Vaembu) 5837 5596 5484 5484 0.091 0.020 0.909 0.817
Nerium oleander(Arali) 5599 5596 5484 5484 0.039 0.014 0.869 0.732
Vinca rosea (Nithyakalyani) 1029 5596 5484 5484 0.127 0.062 0.948 0.928
Nyctanthes arbor-tristis
(Pavalamalli) 4604 1
13168 3472 1.340 0.442 0.799 0.438
Piper beetle (Vetrillai) 1373 1 6565 3241 0.637 0.116 0.949 0.738
Lawsonia inermis (Maruthani)
TABLE 2 Maximum and minimum values of color features
TABLE 3 Confusion matrix of ten species
V.
C
ONCLUSIONIn this paper, the classification of medicinal plant leaves using FRVM with BFO for feature selection is presented. The proposed method identifies the medicinal herbs which are widely used for various medicinal purposes. The manual identification of herbal leaves require domain knowledge and it causes misidentification in some of the cases. Ten different types of herbal leaves of twenty each (total 200 leaves) are used for training, validation and testing. The preprocessing, feature extraction, feature selection and classification tasks were
performed using MATLAB software. The extracted features are tabulated and given as input to the feature selection process. The extracted features are tabulated and given as input to the feature selection process. For selecting the best features, BFO algorithm is used. The selected features are given as input to the FRVM classifier in order to classify the different types of herbal plants. The efficiency of the proposed method in classification of the different herbal plants assures better performance.
Classes
Color
Std. of Hue Std. of Saturation Std. of Value
Max. Min. Max. Min. Max. Min.
Citrus limon 0.048 0.029 0.154 0.073 0.078 0.041
Aristolochia indica 0.074 0.065 0.184 0.154 0.104 0.066
Ginkgo biloba 0.059 0.025 0.149 0.074 0.104 0.055
Hibiscus rosa-sinensis 0.059 0.049 0.178 0.104 0.099 0.064
Azardirachta indica 0.054 0.039 0.160 0.100 0.108 0.073
Nerium oleander 0.051 0.033 0.083 0.050 0.079 0.045
Vinca rosea 0.050 0.019 0.152 0.080 0.116 0.024
Nyctanthes arbor-tristis 0.050 0.027 0.168 0.090 0.058 0.075
Piper beetle 0.051 0.012 0.116 0.042 0.156 0.047
Lawsonia inermis 0.058 0.021 0.176 0.121 0.121 0.126
Citrus limon
Arsitolochi a indica
Ginkgo biloba
Hibiscus rosa-sinensis
Azardirachta indica
Nerium oleander
Vinca rosea
Nyctanthes arbor- Tristis
Piper beetle
Lawsonia inermis
Citrus limon 16 0 3 0 0 0 1 0 0 0
Aristolochia
indica 0 18 0 0 2 0 0 0 0 0 Ginkgo
biloba 2 0 17 0 1 0 0 0 0 0 Hibiscus
rosa-sinensis 0 0 1 18 0 0 0 0 0 1 Azardirachta
indica 1 0 0 0 19 0 0 0 0 0 Nerium
oleander 0 0 0 0 0 20 0 0 0 0 Vinca rosea 0 0 1 1 0 0 18 0 0 0
Nyctanthes
arbor-tristis 0 0 0 0 0 0 0 17 0 3 Piper beetle 0 0 1 0 0 0 0 0 18 1
Lawsonia
In future, the proposed system can be extended to classify a greater number of plant species by considering leaves at different stages of growth.
ACKNOWLEDGEMENTS
Authors are thankful to the Principal, National
Engineering College, Kovilpatti and Dr. A. Kanagarajan, A.D (S), Siddha Clinical Research Unit, Palayamkottai for their constant support and encouragement.
REFERENCES
[1] YG Naresh, H.S. Nagendraswamy, ‘Classification of medicinal plants: An approach using modified LBP with symbolic representation’, Neurocomputing, (17), 2016, 89-97.
[2] Ji-Xiang Du, Mei-Wen Shao, ‘Recognition of leaf image set based on manifold–manifold distance’, Neurocomputing, (188), 2016, 131-138.
[3] Jyotismita Chaki, Ranjan Parekh, ‘Plant leaf recognition using texture and shape with neural classifiers, Pattern Recognition Letters, (58),2015, 61-68.
[4] Aimen Aakif, Muhammad Faisal Khan, ‘Automatic classification of plants based on their leaves’, Science Direct, (139),2015, 66-75.
[5] Sinan Kayaligil, Tulin Inkaya,’Ant colony
optimization based clustering
methodology’Appl.Soft.Comp,(28),2015,301-311. [6] Mohammad Ali Jan Ghasab, Shamsul Khamis,
‘Feature decision-making ant colony optimization system for an automated recognition of plant species’, Expert systems with applications, (23), 2015, 61-70.
[7] Balasubramanian Vijayalakshmi, Vasudev Mohan,
‘Kernel-based PSO and FRVM: An automatic plant leaf detection using texture, shape and color features’, Computers and Electronics in Agriculture, (125), 2016, 99-112.
[8] Ji-xiang du, Chuan-Min, ‘Recognition of plant leaf image based on fractal dimension features’,Neurocomputing, (116), 2013,150-156. [9] G.Monica, Larese, Rafael Namias, Automatic
classification of legumes using leaf vein image features, Pattern Recognition, (47),2014, 158-168. [10] K. Prakash, Saravanamoorthi P, Sathiskumar R,
Parimala M, A study of image processing in agriculture. Int. J. Advanced Networking and applications, (9):1, 2017, 3311-3315.