http://www.ijcmph.com pISSN 2394-6032 | eISSN 2394-6040
Original Research Article
A cross sectional study to assess the satisfaction level among people
living with HIV/AIDS in a hilly state of northern India
Sunita, D. S. Dhadwal, Anmol Gupta, Anjali Mahajan, Amit Sachdeva*
INTRODUCTION
Patient’s satisfaction is the patient’s perception of care received compared with the care expected by them.1 Its
measurement helps in understanding patient’s
experiences of health care, identifying their problems and evaluation of health care. If patient satisfaction increases, it leads to increase patient retention and decreases medical malpractice claims. Furthermore, a satisfied patient is more likely to develop a longer lasting rapport with their health care provider, leading to better
compliance and continuity of care. Dissatisfied patients may have worse outcomes as they may not follow the required treatment plans.2
Patient satisfaction has also been considered as an important part when evaluating the health outcomes and quality of care.3 Measurements of patient satisfaction could not only help to assess the performance of health care services and predict treatment adherence and
outcomes, Besides it will enhance appropriate
communication and build stronger health worker–patient
ABSTRACT
Background: Patient satisfaction is the patient’s perception of care received compared with the care expected. Measurement of patient satisfaction helps in understanding patients’ experiences of health care, identifying problems and evaluation of health care. Increased patient satisfaction leads to increased patient retention and decreases medical malpractice claims. Dissatisfied patients may have worse outcomes as they may not follow treatment plans. The objective of the study was to determine the satisfaction level among people living with HIV/AIDS visiting ART Centre IGMC Shimla.
Methods: A cross sectional study was conducted among >15 years from September 2016 to August 2017 in ART Centre IGMC Shimla and satisfaction level was assessed by using the PSQ18 instrument.
Results: Total 160 participants were enrolled in study among which 71.9% were males while 92.5% were above 30 years of age. Most of the patients were asymptomatic (currently not ill) at the time of consultation and their mode of disease transmission was sexual. The mean scores of PSQ-18 domains i.e. general satisfaction, technical quality, interpersonal manner, communication, financial aspects, time spent with doctor, accessibility and convenience was calculated. Highest score in interpersonal manner, time spent with doctor (3.99±0.12) and lowest score in general satisfaction (3.77±0.54). There was no statistically significant difference between overall satisfaction in relation to different socio demographic and clinical variables found in our study.
Conclusions: Our study reflects that patients were much satisfied with the way health care providers were treating them and spent time with them while they were dissatisfied with something about the health care they were receiving.
Keywords: HIV, AIDS, Satisfaction level, PSQ18
Department ofCommunity Medicine, IGMC, Shimla, Himachal Pradesh, India
Received: 27 February 2018
Revised: 02 May 2018
Accepted: 03 May 2018
*Correspondence:
Dr. Amit Sachdeva,
E-mail: [email protected]
Copyright: © the author(s), publisher and licensee Medip Academy. This is an open-access article distributed under the terms of the Creative Commons Attribution Non-Commercial License, which permits unrestricted non-commercial use, distribution, and reproduction in any medium, provided the original work is properly cited.
relationship based on identified gaps and barriers to effective performance of HIV/AIDS prevention and control programs from the patients’ perspective.4,5
Survey of patient’s satisfaction is an important tool to get feedback from the people. Also it is a means of measuring the effectiveness of health care delivery in a particular area.6 This data about patient satisfaction can serve as a tool in decision-making and learning. It can also serve as a means of holding health care providers accountable. Thus the issues/aspects of satisfaction and dissatisfaction can be explored which may draw attention of the health care providers and administrators in order to monitor performance, determine patient’s needs, plan the development of services and provide evidence to support applications for financial support and expenditure.7
Much of the published data about this topic has been obtained from the studies conducted in the Western part of world. There is limited information about satisfaction studies among people living with HIV (PLHIV) in India.8 Considering the fact that, there is paucity of literature and low prevalence rate of HIV/AIDS in our state, this study was planned to determine the level of satisfaction among people living with Immune suppressed state attending outdoor patient settings at Indira Gandhi Medical College, Shimla.
METHODS
The present cross-sectional study was conducted at the Anti-retroviral therapy (ART) centre of IGMC Shimla among people living with immune suppressed state. Patients attending out-patient department (OPD) services at the ART centre, IGMC Shimla constituted the study population. The study included people living with immune suppressed state whose age >15 yrs and duration on ART >6 months, who had been presented to the OPD within the study period September 2016 to August 2017. All the consecutive patients seeking treatment at ART centre IGMC Shimla were included for the purpose of the study. In depth interviews were conducted in a separate room so that confidentiality of information, privacy and anonymity of participants was maintained.
The data was collected and entered into MS Excel sheet following which the same was transferred to statistical software EPI info v7. Means±SD was calculated for continuous variables. The categorical data was analysed
with chi square or fisher exact test whichever was applicable. The differences between mean scores of various domains of PSQ18 were analysed using ANOVA test.
The approval for the above study was sought from Institutional Ethical committee and HPSAC through principal IGMC Shimla. Data was collected according to the guidelines set up by ICMR (1994) and Helsinki declaration (modified 2000). Patients were informed of the aims, methods, the anticipated benefits and potential risks and written informed consent were obtained from all the patients before being included in the study with a right to abstain from participation in the study or to withdraw consent to participate at any time of the study. In patients age <18 years, written informed consent was obtained from the guardians.
Inclusion criteria
Inclusion criteria were all people living with Immune suppressed state whose age >15 yrs visiting ART centre at IGMC Shimla; duration on ART >6 months.
Exclusion criteria
Exclusion criteria were terminally ill patients and who had other co-morbid disorders like tuberculosis, hepatitis, cancers, cognitive impairment, etc. were excluded; patients who refused to participate in the study.
RESULTS
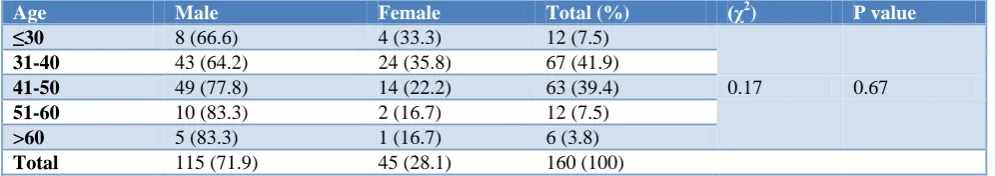
Total 160 patients were enrolled in study among which 115 (71.9%) were males and majority of participants 67 (41.9%) were in the age group of 30-40 years. Mean age of the patients was 41.69±8.86 years (Table 1).
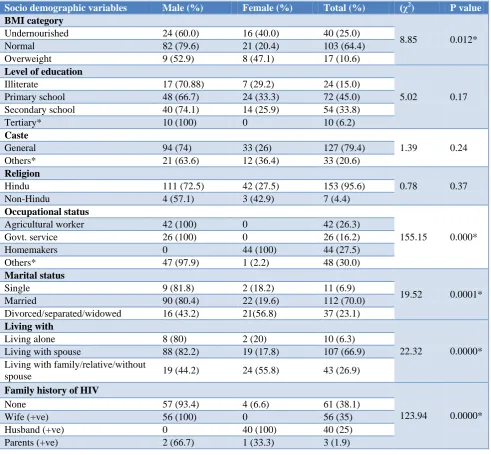
Among the total patients, 103 (64.4%) were of normal BMI. Majority of males were of normal BMI, general category, Hindu by religion and working as farmers or in government services while majority of females were overweight, of other category i.e. OBCs/STs/STs, minorities (i.e. Christians, Muslims, and Buddhists) by religion and home makers by occupation. 45% patients had primary level of education and 15.0% patients were illiterate. Only 6.2% patients had tertiary level of education i.e. post-graduation or above and all are males none of them were female (Table 2).
Table 1: Age and gender distribution of the study participants.
Age Male Female Total (%) (χ2) P value
≤30 8 (66.6) 4 (33.3) 12 (7.5)
0.17 0.67
31-40 43 (64.2) 24 (35.8) 67 (41.9)
41-50 49 (77.8) 14 (22.2) 63 (39.4)
51-60 10 (83.3) 2 (16.7) 12 (7.5)
>60 5 (83.3) 1 (16.7) 6 (3.8)
Table 2: Various socio-demographic variables of study participants.
Socio demographic variables Male (%) Female (%) Total (%) (χ2) P value
BMI category
8.85 0.012*
Undernourished 24 (60.0) 16 (40.0) 40 (25.0)
Normal 82 (79.6) 21 (20.4) 103 (64.4)
Overweight 9 (52.9) 8 (47.1) 17 (10.6)
Level of education
5.02 0.17
Illiterate 17 (70.88) 7 (29.2) 24 (15.0)
Primary school 48 (66.7) 24 (33.3) 72 (45.0)
Secondary school 40 (74.1) 14 (25.9) 54 (33.8)
Tertiary* 10 (100) 0 10 (6.2)
Caste
1.39 0.24
General 94 (74) 33 (26) 127 (79.4)
Others* 21 (63.6) 12 (36.4) 33 (20.6)
Religion
0.78 0.37
Hindu 111 (72.5) 42 (27.5) 153 (95.6)
Non-Hindu 4 (57.1) 3 (42.9) 7 (4.4)
Occupational status
155.15 0.000*
Agricultural worker 42 (100) 0 42 (26.3)
Govt. service 26 (100) 0 26 (16.2)
Homemakers 0 44 (100) 44 (27.5)
Others* 47 (97.9) 1 (2.2) 48 (30.0)
Marital status
19.52 0.0001*
Single 9 (81.8) 2 (18.2) 11 (6.9)
Married 90 (80.4) 22 (19.6) 112 (70.0)
Divorced/separated/widowed 16 (43.2) 21(56.8) 37 (23.1)
Living with
22.32 0.0000*
Living alone 8 (80) 2 (20) 10 (6.3)
Living with spouse 88 (82.2) 19 (17.8) 107 (66.9)
Living with family/relative/without
spouse 19 (44.2) 24 (55.8) 43 (26.9)
Family history of HIV
123.94 0.0000*
None 57 (93.4) 4 (6.6) 61 (38.1)
Wife (+ve) 56 (100) 0 56 (35)
Husband (+ve) 0 40 (100) 40 (25)
Parents (+ve) 2 (66.7) 1 (33.3) 3 (1.9)
Table 3: Various clinical variables of study participants.
Clinical variables Male (%) Female (%) Total (%) (χ2) P value
Currently ill
1.15 0.28
Yes 9 (60) 6 (40) 15 (9.4)
No 106 (73.1) 39 (26.9) 145 (90.6)
Duration on ART
2.63 0.26
6 months – 1 year 14 (58.3) 10 (41.7) 24 (15.0)
1-5 years 55 (73.3) 20 (26.7) 75 (46.9)
>5 years 46 (75.4) 15 (24.6) 61 (38.1)
Staging
4.25 0.24
Stage I (>500/mm3) 26 (61.9) 16 (38.1) 42 (26.3)
Stage II (350-99/mm3) 39 (78) 11 (22) 50 (31.3)
Stage III (200-349/mm3) 23 (67.6) 11 (32.4) 34 (21.2)
Stage IV (<200/mm3) 27 (79.4) 7 (20.6) 34 (21.2)
Clinical variables Male (%) Female (%) Total (%) (χ2) P value Mode of transmission
23.71 0.0000*
Don’t know 57 (93.4) 4 (6.6) 61 (38.1)
Sexual 54 (58.1) 39 (41.9) 93 (58.1)
MTC 2 (66.7) 1 (33.3) 3 (1.9)
IDU 1 (100) 0 1 (0.6)
Blood products 1 (50) 1 (50) 2 (1.3)
Table 4: Various domains of patient satisfaction questionnaire (PSQ-18).
Sr. no. Domain score Mean±SD
1 Domain 1 General satisfaction 3.77±0.54
2 Domain 2 Technical quality 3.89±0.21
3 Domain 3 Interpersonal manner 3.99±0.12
4 Domain 4 Communication 3.85±0.34
5 Domain 5 Financial aspects 3.68±0.52
6 Domain 6 Time spent with doctor 3.99±0.12
7 Domain 7 Accessibility and convenience 3.96±0.15
8 Composite score 70.01±2.83
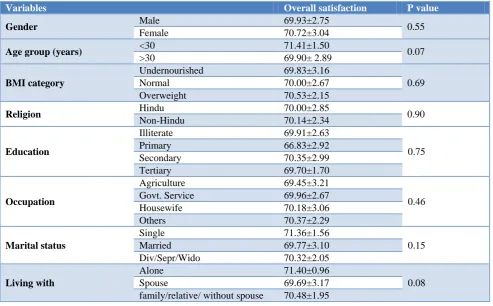
Table 5: Comparison of mean scores of patients overall satisfaction according to socio-demographic characteristics.
Variables Overall satisfaction P value
Gender Male 69.93±2.75 0.55
Female 70.72±3.04
Age group (years) <30 71.41±1.50 0.07
>30 69.90± 2.89
BMI category
Undernourished 69.83±3.16
0.69
Normal 70.00±2.67
Overweight 70.53±2.15
Religion Hindu 70.00±2.85 0.90
Non-Hindu 70.14±2.34
Education
Illiterate 69.91±2.63
0.75
Primary 66.83±2.92
Secondary 70.35±2.99
Tertiary 69.70±1.70
Occupation
Agriculture 69.45±3.21
0.46
Govt. Service 69.96±2.67
Housewife 70.18±3.06
Others 70.37±2.29
Marital status
Single 71.36±1.56
0.15
Married 69.77±3.10
Div/Sepr/Wido 70.32±2.05
Living with
Alone 71.40±0.96
0.08
Spouse 69.69±3.17
family/relative/ without spouse 70.48±1.95
112 (70%) of the study participants were married. Majority of the males were living with their spouses and had no family history of HIV while female living with their family/relative without spouses and their husbands had positive history of HIV (Table 2).
Most of the male patients were asymptomatic (currently not ill), on ART for last 1-5 years, in stage II at the time of consultation and sexual as their mode of disease
transmission. Majority of females were asymptomatic and on ART for less than 1 year, in stage I and sexual as their mode of disease transmission (Table 3).
3.99±0.12, 3.85±0.34, 3.68±0.52, 3.99±0.12 and 3.96±0.15 respectively. The composite score was 70.01±2.83. So highest score in interpersonal manner and time spent with doctor (3.99±0.12) which reflects that patients were much satisfied with the way health care
providers were treating them and spent time with them and lowest score in general satisfaction (3.77±0.54) which shows that patients were dissatisfied with something about the health care they were receiving (Table 4).
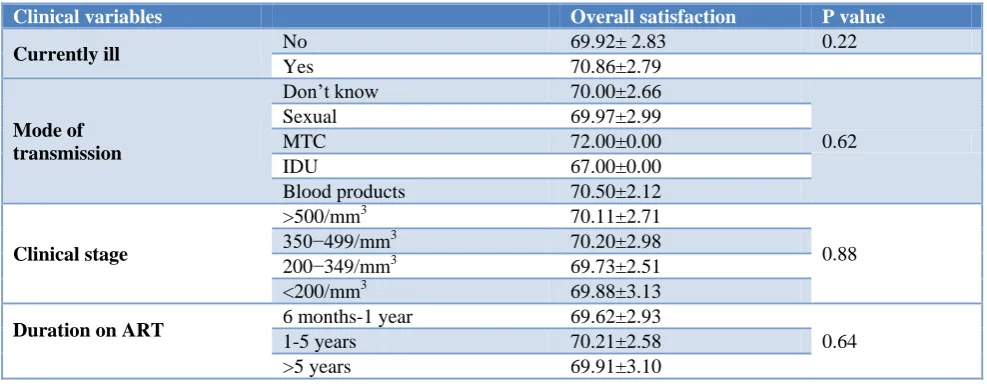
Table 6: Comparison of mean scores of patients overall satisfaction according to clinical characteristics.
Clinical variables Overall satisfaction P value
Currently ill No 69.92± 2.83 0.22
Yes 70.86±2.79
Mode of transmission
Don’t know 70.00±2.66
0.62
Sexual 69.97±2.99
MTC 72.00±0.00
IDU 67.00±0.00
Blood products 70.50±2.12
Clinical stage
>500/mm3 70.11±2.71
0.88
350−499/mm3
70.20±2.98
200−349/mm3 69.73±2.51
<200/mm3 69.88±3.13
Duration on ART 6 months-1 year 69.62±2.93
0.64
1-5 years 70.21±2.58
>5 years 69.91±3.10
It was found that there was no statistically significant difference between overall satisfaction in relation to different socio demographic and clinical variables i.e. genders, age group, BMI category, education, marital status, currently ill, religion, occupational status, living status, routes of transmission, clinical stage and duration on ART (p>0.05), which shows there is no effect of different socio demographic and clinical variables on the satisfaction of patients (Table 5 and 6).
DISCUSSION
In our study, out of the total patients, majority (71.9%) were males. This might be due to the fact that most of them worked away from their homes and indulged in unsafe sexual practices. This finding is similar to the studies conducted by Liping et al which also observed that males were more as compared to females.9 Most of the patients (92.5%) were above 30 years of age. Charles et al also observed the similar age groups in their study.10 In our study, nearly 2/3rd of the patients had normal BMI while one-fourth were undernourished. However, a study conducted by Deshmukh et al observed that 32.8% patients in their study were undernourished.11 In our study, most of the patients (90.6%) were asymptomatic and only (9.4%) were symptomatic (currently ill) at the time of study. This was the result of free access to treatment which enhanced the proportion of persons under treatment leading to a better health status, without symptoms. Karkashadze et al and Bakiono et al also noted that majority of patients were asymptomatic at the time of study which is quite similar to our study.12,13
In our study, more than half (58.1%) patients had the disease due to sexual route of transmission while 38.1%
patients don’t know their mode of transmission. It is likely that they were unaware of the mode of transmission because of low literacy and lack of knowledge about the different routes of transmission of HIV. Similar to our study, Bakiono et al and Naik et al in their studies noted that the main mode of transmission was heterosexual intercourse.12,14
In the present study, about 1/3rd of the patients (31.3%) belonged to stage II and about 1/4th (26.3%) of the patients belonged to stage I. Equal number of patients (21.2%) were present in stage III & IV. Similarly, Liping et al noted that 31.6% patients belonged to stage II.9 However study conducted by Sonani et al found that 60.6% of their patients belonged to stage I and 18.9% patients belonged to stage II.15 In our study, Mean time since initiation of ART was 4.87±3.49. Similar to our study, Bakiono et al in their study noted that the mean time since initiation of ART was 5.0±3.1 years.12
satisfaction is the highest for general satisfaction and least in time spent with doctor.6 Vahab et al found that the mean scores of PSQ-18 domains was highest in technical quality & interpersonal manner (4.77±0.26) and lowest in accessibility and convenience was (3.20±0.72), respectively.8 Rai et alnoted the mean scores was highest in general satisfaction and lowest score in accessibility and convenience score.16 Holikatti et al observed the mean scores of PSQ-18 domains highest in interpersonal manner and lowest in communication.17
In our study no statistically significant difference was found between overall satisfaction in relation to different socio demographic and clinical variables i.e. genders, age group, BMI category, education, marital status, currently ill, religion, occupational status, living status, routes of transmission, clinical stage and duration on ART (p>0.05). It means there is no effect of different socio demographic and clinical variables on the satisfaction of patients. Only the mean score of overall satisfaction was found to be statistically significant with cast of the study participants. Patients whose caste was other than general had higher overall score (71.18±2.29) than general (69.70±2.88). Holikatti et al also observed that overall satisfaction scores were not significantly different between any of the socio-demographic groups.17
CONCLUSION
Majority of the patients were of normal weight, general caste, Hindu by religion. Mostly working as others
(MGNREGA, student, shopkeeper, drivers and
unemployed), married, living with spouses, no family history of HIV, asymptomatic, >5 years of duration on ART, stage II and didn’t know their mode of disease transmission. About 3/4th patients were quite satisfied with their health status. The satisfaction score was. Highest for interpersonal manner and time spent with doctor while it was lowest for general satisfaction. There was no statistically significant difference found between overall satisfaction scores in relation to different socio demographic and clinical variables.
Limitations
Though conducted with a relatively sound methodology, this study nonetheless has few limitations. A smaller study sample due to a time bound project may limit the utility of this study in interpreting clinico-demography of HIV for a diverse population like India, so the findings of this study need to be corroborated in larger sample studies.
Funding: No funding sources Conflict of interest: None declared
Ethical approval: The study was approved by the Institutional Ethics Committee
REFERENCES
1. Aiello A, Garman A, Morris BS. Patient satisfaction with nursing care: A multilevel analysis. J Quality Management in Health Care. 2000;312(3):187–91. 2. Mindaye T, Taye B. Patient’s satisfaction with
laboratory services at antiretroviral therapy clinics in public hospitals, Addis Ababa, Ethiopia. BMC Res Notes. 2012;5:184-7.
3. Andaleeb SS, Siddiqui N, Khandakar S. Patient satisfaction with health services in Bangladesh. Health Policy Plan. 2007;22:263–73.
4. Ware Je JR, Davies AA, Stewart AL. The
measurement and meaning of patient satisfaction. Health Med Care Serv Rev. 1978;1:3–15.
5. Fitzpatrick R. Surveys of patient satisfaction: designing a questionnaire and conducting a survey. Br Med J. 1991;302:1129–32.
6. Chakraborty SN, Bhattacherjee S, Rahaman MA. A
cross-sectional study on patient satisfaction in an Urban Health Care Centre of Siliguri Municipal Corporation, Darjeeling, West Bengal. Med J DY Patil Univ. 2016;9:325-30.
7. Suryakantha AH. Community Medicine with Recent
Advances. 2nd ed. Bengaluru (India): Jaypee Brothers Medical Publishers (P) Ltd.2010;3:591. 8. Vahab SA, Madi D, Ramapuram J, Bhaskaran U,
Achappa B. Level of Satisfaction Among People Living with HIV (PLHIV) Attending the HIV Clinic of Tertiary Care Center in Southern India. J Clin Diagnos Res. 2016;10(4):8-10.
9. Liping M, Peng X, Haijiang L, Lahong J, Fan L. Quality of Life of People Living with HIV/AIDS: A Cross-Sectional Study in Zhejiang Province, China. PLoS ONE. 2015;10(8):0135705.
10. Charles B, Jeyaseelan L, Pandian AK, Sam AE, Thenmozhi M, Jayaseelan V. Association between stigma, depression and quality of life of people living with HIV/AIDS (PLHA) in South India – a community based cross sectional study. BMC Public Health. 2012;12:463:1-11.
11. Deshmukh NN, Deshmukh JS, Borkar AM,
Khamgaonkar MB. Depression in people living with HIV/AIDS: A Prevalence study in Anti-Retroviral Therapy Centre. J Acad Indust Res. 2013;2(5):262-4.
12. Bakiono F, Ouédraogo L, Sanou M,
Samadoulougou S, Guiguemdé PW,
Samadoulougou FK, et al. Quality of life in people living with HIV: a cross-sectional study in Ouagadougou, Burkina Faso. Springer plus. 2014;3:372-7.
13. Karkashadze E, Gates MA, Chkhartishvili N, DeHovitz J, Tsertsvadze T. Assessment of quality of life in people living with HIV in Georgia. Int J STD AIDS. 2017;28(7):672–8.
14. Naik AB, Naik AB. Emergence and Social
15. Sonani HP, Undhad AM, Savani GT. Clinical and socio-demographic profile of patients registered at art centre, smimer, Surat. National J Community Med. 2011;2(1):130-2.
16. Rai S, Yesikar V, Dixit S, Sharma SS, Saroshe S, Patel J, Assessment of client satisfaction among HIV/AIDS patients attending selected ART centers of Indore and Ujjain division of Madhya Pradesh. Public health Rev: Int J Public health Res. 2016;3(2):59-64.
17. Holikatti PC, Kar N, Mishra A, Shukla R, Swain SP, Kar S. A study on patient satisfaction with
psychiatric services. Indian J Psychiatry.
2012;54:327-32.