Soft Computing Stock Market Price Prediction for
the Nigerian Stock Exchange
Mbeledogu N.N.
1, Chiemeke S.C.
2, Imianvan A.A.
3, Ekuobase G.O.
41 Computer Science Dept., Nnamdi Azikiwe University, Awka, Anambra State, Nigeria. 2, 3, 4
Computer Science Dept., University of Benin, Benin, Edo State, Nigeria.
Abstract— Forecasting the price movements in stock
market has been a major challenge for common investors, businesses, brokers and speculators because Stock Prices are considered to be very dynamic and susceptible to quick changes. As more and more money is being invested, the investor gets anxious of the future trends of the stock prices in the market and thus, creates a high desirable need for a more’ intelligent’ prediction model. Two soft computing models- Artificial Neural Network (ANN) and Fuzzy Artificial Neural Network (FANN) hybrid model were used to forecast the next day’s closing price. The historical trading data was obtained from the Nigerian Stock Exchange for Dangote Sugar Refinery Plc . The results showed the power of Soft Computing techniques (SC) in stock Price Prediction.
Keywords— Artificial Neural Network (ANN), Fuzzy Artificial Neural Network (FANN) Model, hybrid method, Soft Computing (SC).
I. INTRODUCTION
Close price represents the most up-to-date valuation of a security until trading commences again on the next trading day [3]. It provides a useful marker for investors to assess changes in stock prices over time. The closing price of one day can be compared to the previous closing price in order to measure market sentiment for a given security over a trading day. Undoubtedly, forecasting this stock price is difficult because of stock market dynamism that needs to be captured in used and implemented models.
II. LITERATURE REVIEW
Soft Computing is a family of computing techniques particularly adapted to cope with a class of problems for which other techniques were not quite well suited [5]. The
Fuzzy Logic (FL)
Fuzzy logic is a logical system that aims at formalization of approximate reasoning. It can be thought of as the application side of fuzzy set theory dealing with well thought out real world expert values for a complex problem, uncertainty and imprecision [4].
Figure1: Structure of a fuzzy Logic system.
In Figure 1, the measured or control variable from the preprocessing (often a crisp value) becomes the controller’s input . The process at which the degree of measurability of ‘x’ is described by set A, μA (x), in the universe Z’ is known
as fuzzification. In the fuzzy set, the membership function of A is assigned a value between 0 and 1, including 0 and 1, to each value in X. The logic operations such as AND and OR can be implemented with the different membership functions to generate a resultant membership function. This step involves regulating a process output around a desired set point or reference value using the IF-THEN rule format. The inference engine looks up the corresponding membership values as defined by the condition of the rule and maps it to the appropriate output membership function to be defuzzified. Without defuzzification, the final output from the inference stage would remain a fuzzy set. In this step, a fuzzy set is reduced to a single numbered output.
Artificial Neural Network (ANN)
Figure 2: Model of a single neuron
The mapping of single unit perceptron can be expressed as:
= (∑ + ) (1)
Where are the individual weights, are the inputs and is the bias.
PROBABILISTIC REASONING (PR)
The basic interest of probabilistic reasoning is uncertainty. It has a range of techniques including belief networks, genetic algorithms and chaotic systems.
However, Lotfi Zadeh proposed the idea of fusing these methodologies into one multidisciplinary field so that the merits of one technique can offset the demerits of another. The use of one of those methodologies still falls into the category of Soft Computing.
III. METHODOLOGY
Data Acquisition: Historical Stock data was collected for a
two years continuous day trade for food and beverage sector (January 2, 2008 to December 31, 2009). The motivation for this criteria is to study a continuous pattern of daily stock prices.
Software Tools: Matlab and Minitab were used to build
both models and pre-process the data respectively.
Data Pre-processing: Data was preprocessed using
Principal Component Analysis (PCA) due to the fact that historical stock market data is of multivariate nature as shown in Table 1. The quoted daily trading pricelist is comprised of variables (technical indicators) which include Open price, High price, Low price, Close price, Change (difference between the Open price and Close price), Chg (difference between High price and Low price), Volume and Values. Using the entire variables will lead to the curse
of dimensionality. To avoid this, there was a need to reduce
the number of variables. Our aim in its reduction was to select variables that best features the generality of the entire stock data for forecasting as the input. The variables were categorized from 1 to 9 respectively.
Table.1: Principal Component Analysis (Dangote Sugar) Eigen analysis of the Correlation Matrix
Eigen value 5.1538 1.8692 1.5743 0.3578 0.0232 0.0085 0.0064 0.0050 0.0018 Proportion 0.573 0.208 0.175 0.040 0.003 0.001 0.001 0.001 0.000 Cumulative 0.573 0.780 0.955 0.995 0.998 0.999 0.999 1.000 1.000
Variable PC1 PC2 PC3 PC4 PC5 PC6 PC7 PC8 PC9 Open 0.410 0.207 -0.148 -0.125 0.706 -0.028 0.136 -0.173 -0.452 High 0.410 0.190 -0.184 -0.140 -0.118 -0.645 -0.153 -0.263 0.468 Low 0.412 0.216 -0.134 -0.097 0.106 0.569 -0.096 0.421 0.485 Close 0.408 0.196 -0.190 -0.095 -0.689 0.160 0.185 -0.053 -0.461 Change 0.197 -0.579 -0.329 0.025 0.026 -0.330 0.081 0.619 -0.135 Chg 0.141 -0.617 -0.341 0.027 0.009 0.352 -0.098 -0.575 0.133 Deals -0.346 -0.001 -0.239 -0.906 -0.006 0.026 -0.019 0.033 -0.014 Volume -0.292 0.216 -0.534 0.232 0.038 -0.008 0.688 -0.044 0.227 Value -0.252 0.271 -0.568 0.265 0.005 0.005 -0.652 0.064 -0.203
. 9 8 7 6 5 4 3 2 1 5 4 3 2 1 0
C o m p o n e n t N u m b e r
E ig e n v a lu e
Figure 3: Scree plot
From the scree plot, Open Price, High Price, Low Price and Close Price had high eigen values and were selected while the variables with principal components 5 – 9 leveled off (the elbow) and were not selected. The four extracted technical indicator variables are the stock inputs for the model.
ANN Design: A Multi-layer perceptron model (MLP)
trained with Levenberg Marquardt back propagation algorithm. was used. The MLP comprised of four layers. The Log-sigmoid and Purelin activation functions were deployed within the two hidden layers and last respectively. Optimum performance experimentation was carried out to determine the number of hidden neurons as shown in Table 2. The layer that returned the least Mean Square Error (MSE) for the number of neurons was selected.
Table.2: Optimum Performance for number of hidden neurons
FANN Design: This is a hybrid model that fused Fuzzy
and ANN Models together as shown in Figure 4. The raw stock data are fuzzified using Gaussian Membership function:
( , , ) = exp −( ) (2) Where is the mean value, the standard deviation for a
given membership function and is the input. The number of rules were generated using
= ! (3) Where N is the number of rules, R is the number of process
state variables and " is the number of control variable.The fuzzy set used for the input stock classifiers were BestBuy (BB), Buy (B), Sell (S) and BestSell (BS) and mapped on a scale of 5-50. Center of Gravity was employed for its defuzzification.
.
1000Epochs Number of
Neurons % Training Time MSE 4-10-5-1 1.9 9.92647e-006 4-20-5-1 3.2 9.861e-006 4-30-5-1 2.1 9.9529e-006 4-40-5-1 5.5 9.78957e-006
4-50-5-1 1.4 7.66117e-006
4-60-5-1 4.9 9.86415e-006
Ann Block Fuzzy Block
Stock Inputs output
IV. IMPLEMENTATION
The stock data series were first partitioned into three disjoint sets: the training set, the validation set, and the test set. 60% of the stock data was used for training, 20% for validation and 20% for testing. These stock data were stored in the MATLAB workspace. Both models were implemented with results as shown in Table 3 and Figure 5.
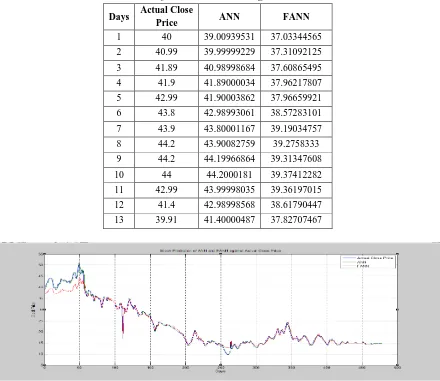
Table.3: Price Prediction for ANN and FANN as against the Actual Close Price.
Days Actual Close
Price ANN FANN
1 40 39.00939531 37.03344565 2 40.99 39.99999229 37.31092125 3 41.89 40.98998684 37.60865495 4 41.9 41.89000034 37.96217807 5 42.99 41.90003862 37.96659921 6 43.8 42.98993061 38.57283101 7 43.9 43.80001167 39.19034757 8 44.2 43.90082759 39.2758333 9 44.2 44.19966864 39.31347608 10 44 44.2000181 39.37412282 11 42.99 43.99998035 39.36197015 12 41.4 42.98998568 38.61790447 13 39.91 41.40000487 37.82707467
Figure 5: Graphical representation of the models against the Actual close price
V. PERFORMANCE METRICS
The Root Mean Square Error (RMSE) was used (Table 4):
#$% = &∑0+12('()*,+ ',(-./,+) (4)
Where 3456, is observed values and 3 4789, is modeled values at time.
Table.4: Comparative Performance Evaluation
Model RMSE
ANN 1.586
VI. RESULTS
It can be observed that soft computing techniques demonstrated good predictive ability in handling non-linearity, complexity and imprecision in stock price forecasting. ANN showed better prediction than FANN model as presented in Figure 5 and Tables 3 and 4 as it returned a lesser RMSE value than FANN model .
VII. CONCLUSION
The experimental results showed the ability of soft computing techniques to predict future stock price. Whether hybrid or single, each technique can handle non-linear and complex problem to provide a predictable and better solution in the field of intelligent systems than the other.
REFERENCES
[1] Aggrawal, .S, Jindal, .M and Pillai, .G (2010). Momemtum Analysi based Stock Market prediction using Adaptive using Adaptative Neuro-Fuzzy Inference System, Proceedings of the International MultiConference of Engineers and Computer Scientists, Vol 1.
[2] Huang,Y., Lan,Y., Thomson,S., Fang,A., Hoffmann,W. & Lacey,R.(2010). Development of soft computing and applications in agricultural and biological engineering. Computers and electronics in agriculture, 71, pp 107-127
[3] Investopedia (2013). Stock Market. Retrievedfromwww.investopedia.com/terms/s/stockma rket.asp#axzz2IjJu5E13.