Original Research Article
Prevalence of hearing impairment in Aligarh: a community based study
Mohammad Asif Khan
1, Najam Khalique
2*, Zulfia Khan
2, Abrar Hasan
3INTRODUCTION
To hear somebody talk or speak and to be able to understand and communicate to one another is very essential in the development of one’s knowledge, intelligence, wisdom and finally of a good personality.1
As a result of not conferring to a uniform definition of hearing impairment a wide variability in prevalence of hearing impairment is seen. Hearing loss means any reduction or difficulty in hearing. Hearing impairment means any level or grade of hearing loss. According to
W.H.O pure tone average threshold of more than 25 dB for frequencies of 0.5, 1, 2 and 4 KHz is defined as hearing impaired.2
According to National Sample Survey Organization (2002) hearing impairment contributed to 16.55% of total disability in India. The prevalence of hearing impairment in India is 10.7% in rural areas and 6.8% in urban areas.3
In the national health interview survey (1997-2002) in U.S.A found that the prevalence of hearing impairment was 13.1%.4 Borchgrevink found in a study in Nord Trendelag Norway reported a prevalence rate of 27.2%.5
ABSTRACT
Background: Hearing impairment is a very complex phenomenon, which has many and serious consequencesfor people and involves many factors and issues that should becarefully examined. The objective of the study were to estimate the prevalence of hearing impairment in the study population.
Methods: Study design was a community based cross sectional study. Setting was on field practice areas of the urban and rural health training centers, Department of Community Medicine, Jawaharlal Nehru Medical College, Aligarh Muslim University, Aligarh, Uttar Pradesh. No. of Participants was 422 study subjects age 18 and above 18 years; Systematic random sampling and proportionate to population size method (PPS). Statistical analysis was carried out using SPSS version 13; Chi-square.
Results: Overall prevalence in present study population was found to be 23.1%. The prevalence in the rural areas (24.8%) was found to be higher than that of the urban areas (20.5%). The age specific prevalence showed that the maximum prevalence was in the age group of more than 70 years (66.6%). In the rural areas the prevalence was highest in the >70 year age group(75%) while in the urban areas it was maximum in the 61-70 year age group(61.5%). The prevalence was least in the 31-40 year age group in both urban (5.4%) as well as rural areas (14.5%). The association of hearing loss with age was found to be highly significant.
Conclusions: A high prevalence of hearing impairment was found in the study. Increasing prevalence of hearing impairment was observed with advancing age.
Keywords: Hearing impairment, Prevalence, Age specific, Urban, rural
Department of Community Medicine, 1KMCT Medical College, Khozikode, Kerala, 2J N Medical College, AMU, Aligarh, Uttar Pradesh, India
3
Department of ENT, J N Medical College, AMU, Aligarh, Uttar Pradesh, India
Received: 04 April 2018
Accepted: 08 May 2018
*Correspondence:
Dr. Najam Khalique,
E-mail: [email protected]
Copyright: © the author(s), publisher and licensee Medip Academy. This is an open-access article distributed under the terms of the Creative Commons Attribution Non-Commercial License, which permits unrestricted non-commercial use, distribution, and reproduction in any medium, provided the original work is properly cited.
Hearing impairment is the most common disability worldwide and also the most neglected one. The exact prevalence is unknown in most parts of the world. Reliable, standardized, population-based data on the causes of hearing impairment are scarce. Most of the countries of the world do not have any national program in place for prevention, control and rehabilitation of hearing impaired. India has recently launched its National Program for Prevention and Control of Deafness in 2007.
There are still many lacunae in the knowledge about hearing impairment at the local, state and national level. There is paucity of data on the prevalence of hearing impairment in the Indian population in general and that of Aligarh in particular. Hence this study was carried out with the following objectives to ascertain the prevalence of hearing impairment in the study population of Aligarh.
METHODS
The present community based cross sectional study entitled “Prevalence of Hearing Impairment in Aligarh- A Community based Study” was conducted in the field practice areas of the urban and rural health training centers, Department of Community Medicine, Jawaharlal Nehru Medical College, Aligarh Muslim University, Aligarh, Uttar Pradesh.
The study subjects aged 18 and above years included in the study were residents of four registered areas of the urban health training center (Total population 12288) and seven registered villages of rural health training centre (Total population 14600). The study period was one year i.e. from July 2006 to June 2007. Systematic random sampling and proportionate to population size method (PPS) were used.
Taking the I.C.M.R study as reference the sample size was calculated for an anticipated prevalence of 10% (average) using the formula
N = Z21-α × P (1-P) / d2
= (1.96)2 × 0.1 × 0.9 / 0.03 × 0.03 = 384
Considering a non response rate / non-co-operation from the participants, the sample size was increased by 10% and the total was calculated to be
N = 384 + 384 × 0.1 = 422 households.
Method of selection
Out of the total of 4076 households in the registered areas, 422 households (U.H.T.C – 179, R.H.T.C- 243) were selected for the study by probability proportionate to size sampling (PPS). From the list of households of each area the required number of households was selected by systematic random sampling with a sampling interval
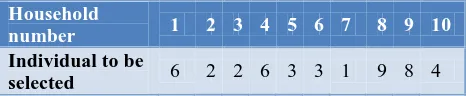
From each household one individual aged 18 years and above was selected randomly as a study unit. In the household if there were more than one individual aged more than 18 years then random number table given below was used to select the study subject.
Table 1: Study subject selection.
Household
number 1 2 3 4 5 6 7 8 9 10
Individual to be
selected 6 2 2 6 3 3 1 9 8 4
Inclusion criteria
Inclusion criteria were individuals aged 18 years and above, should be a resident of a household registered with the urban or rural health training center; the individual giving informed verbal consent for interview and examination.
Exclusion criterion
Exclusion criterion was people not giving consent to participate in the study.
History
Inquiry was made regarding particulars of the individual selected for the study viz. age, sex, religion, marital status, type of family, education and occupation, socio economic status according to the modified Prasad classification 2002. Information regarding hearing status was collected by asking the question “do you have hearing problem at present”. Irrespective of the answer being yes or no the person was subjected to Hearing Handicap Inventory in which 10 question were asked to assess the level of handicap perceived by the person. Inquiry was made regarding the duration of hearing loss and the type of onset (insidious or sudden).
Examination
General and systemic examination. Rinnes and Weber’s tuning fork test were performed using a tuning fork of 256 Hz.
Data analysis
Data entry and statistical analysis was carried out using SPSS 13.0. Univariate analysis was carried out by Chi- square test computed using SPSS 13.0. A p value of less than 0.05 was taken as significant.
RESULTS
Table 2: Distribution of study population according to age and gender.
Age (years)
Residence
Total
Rural Urban
Male (%)
Female (%)
Total (%)
Male (%)
Female (%)
Total (%)
Male (%)
Female (%)
Total (%) 18-30 36 (32.7) 50 (43.1) 86 (38) 21 (45.7) 43 (40.9) 64 (42.4) 57 (36.5) 93 (42.1) 150 (39.8)
31-40 34 (30.9) 35 (30.2) 69 (30.5) 9 (19.6) 28 (26.7) 37 (24.5) 43 (27.6) 63 (28.5) 106 (28.1)
41-50 16 (14.5) 11 (9.5) 27 (11.9) 4 (8.7) 14 (13.3) 18 (11.9) 20 (12.8) 25 (11.3) 45 (11.9)
51-60 12 (10.9) 11 (9.5) 23 (10.2) 5 (10.9) 13 (12.4) 18 (11.9) 17 (10.9) 24 (10.9) 41 (10.9)
61-70 6 (5.5) 7 (6.0) 13 (5.8) 6 (13.0) 7 (6.7) 13 (8.6) 12 (7.7) 14 (6.3) 26 (6.9)
>70 6 (5.5) 2 (1.7) 8 (3.5) 1 (2.2) 0 1 (0.7) 7 (4.5) 2 (0.9) 9 (2.4)
Total 110 (100) 116 (100) 226 (100) 46 (100) 105 (100) 151 (100) 156 (100) 221 (100) 377 (100)
Table 3: Socio demographic profile of the study population.
Characteristics Rural Urban Total
Number % Number % Number %
Religion
Islam 48 21.2 130 86.1 178 47.3
Hinduism 178 78.6 10 6.6 188 49.9
Others 0 0 11 7.3 11 2.9
Total 226 100 151 100 377 100
Social class
I 0 0 0 0 0 0
II 1 0.4 0 0 1 0.3
III 0 0 0 0 0 0
IV 12 5.3 12 7.9 24 6.4
V 213 94.2 139 92.1 352 93.4
Total 226 100 151 100 377 100
Education
Illiterate 103 45.6 104 68.9 207 54.9
I-V (Primary) 24 10.6 20 13.2 44 11.7
V-VIII (Middle) 28 12.4 9 6.0 37 9.8
IX-XII 54 23.9 17 11.3 71 18.8
Graduate and above 17 7.5 1 0.7 18 4.8
Total 226 100 151 100 377 100
Housing
Pucca 59 26.1 57 37.7 116 34.4
Semipucca 142 62.8 86 57.0 228 67.6
Kutcha 25 11.1 8 5.3 33 8.7
Total 226 100 151 100 377 100
Occupation
Professional 0 0 0 0 0 0
Government servant 15 6.6 4 2.6 19 5.0
Shop owner 27 11.9 10 6.6 37 9.8
Farm owner 30 13.3 0 0 30 7.9
Laborer 32 14.2 36 23.8 68 18.0
Housewife 94 41.6 86 57.0 180 47.7
Others 28 12.3 15 9.9 43 11.3
Total 226 100 151 100 377 100
The remaining study population 140 was referred to their respective health centers (UHTC and RHTC) for otoscopic and audiometric examination.123 of those referred actually reported for examination. Overall complete information was not available for 45 persons and these were excluded from statistical analysis. Analysis was done for the remaining 377 adults.
In the study population 156 were males 46 in the urban areas and 110 in the rural areas. Of the 221 females 105 were from the urban areas and 116 from rural areas. Majority of the study population were Hindus (49.9%) followed by Muslims (47.3%). Most of the people residing in urban areas were Muslims (86.1%), Hindus were 6.6%, while 7.3% followed other religions. In the rural areas Hindus were predominant accounting for
78.6% of the study population while Muslims formed the remaining 21.2%. Most of the study population (93.4%) belonged to social class V according to the modified Prasad classification (2002). In the rural areas 94.2% of the people belonged to social class V while 5.3% were of social class IV. In the urban areas 92.1% of the population were in social class V while remaining 7.9% were of class IV.
Table 4: Age wise distribution of hearing impairment in the study population.
Age Rural Urban Total
Hearing impairment Hearing impairment Hearing impairment
Yes (%) No (%) Total (%) Yes (%) No (%) Total (%) Yes (%) No (%) Total (%)
18-30 19(22.1) 67(77.9) 86(100) 12(18.8) 52(81.2) 64(100) 31(20.7) 119(79.3) 150(100)
31-40 10(14.5) 59(85.5) 69(100) 2(5.4) 35(94.6) 37(100) 12(11.3) 94(88.7) 106(100)
41-50 5(18.5) 22(81.5) 27(100) 2(12.5) 16(87.5) 18(100) 7(15.6) 38(84.4) 45(100)
51-60 11(47.8 12(52.2) 23(100) 7(38.9) 11(61.1) 18(100) 18(43.9) 23(56.1) 41(100)
61-70 5(38.5) 8(61.5) 13(100) 8(61.5) 5(38.5) 13(100) 13(50.0) 13(50.0) 26(100)
>70 6(75) 2(25.0) 8(100) 0 1(100) 1(100) 6(66.7) 3(33.3) 9(100)
Total 56(24.8) 170(75.2) 226(100) 31(20.5) 120(79.5) 151(100) 87(23.1) 290(76.9) 377(100)
Χ2
=45.64, d.f=5, p<0.01.
The largest proportion of the study population was illiterate (54.9%). In the urban and rural areas 68.9% and 45.6% respectively were illiterate. Those who had attended school up to primary, middle and High school or intermediate level constituted 11.7%, 9.8% and18.8% of the population. Only 4.8% were graduates or had received higher education. The greater part of the study population consisted of housewives (47.7%) followed by labourers (18.0%). 9.8% shop owners, 7.9% farm owners, 5% had government jobs and 11.1% of the population consisted of others which included students, retired and unemployed people (Table 3).
Overall prevalence in present study population was found to be 23.1%. The prevalence in the rural areas (24.8%) was found to be higher than that of the urban areas (20.5%).
The age specific prevalence showed that the maximum prevalence was in the age group of more than 70 years (66.6%) while it was minimum in 31-40 year age group (11.3%). In the rural areas the prevalence was highest in the >70 year age group (75%) while in the urban areas it was maximum in the 61-70 year age group (61.5%). The prevalence was least in the 31-40 year age group in both urban (5.4%) as well as rural areas (14.5%). The association of hearing loss with age was found to be highly significant (χ2=45.64, d.f=5 and p<0.01) (Table 4).
It is inferred from the age specific prevalence rates that there is a rising trend in prevalence of hearing loss with increasing age with a steep increase beyond 50 years of age. The only exception to this trend was 18-30 year age group.
DISCUSSION
Majority of the study population (39.8%) belonged to 18-30 year age group while the least contribution (2.4%) was of those aged more than 70 years. The elderly population (>60 year) in our study was slightly higher than the 2001 census figure of 7.2% for Aligarh.
Overall the literacy rate in the study population was 45.1% which is below the national average of 65.3%.. The literacy status was poor in urban areas as compared to the rural areas because of the fact that most of the urban population consists of Muslims. According to national census 2001 literacy status among Muslims is lower as compared to other communities
The overall prevalence of this study is similar to the findings of Wilson et al who in a study in Australian adults aged more than 15 years reported a prevalence rate of 22.2%.6 Pal in a study on 4528 individuals in Lucknow reported that the prevalence in more than 15 year population was 23.5%.7
In contrast to this study other authors have reported lower prevalence. Liu have reported a prevalence rate of 3.28% in general population of Sichuan province of china.8
In a study carried out by Job et al on young army recruits aged 18-24 years. The prevalence of hearing loss was 9% at medium frequencies (0.5-2 kHz) and 15% at high frequencies (4-8 kHz).9
rates of 10.7% and 6.8% for rural and urban areas respectively. In studies conducted at Aligarh prevalence rate.11
13.78% was reported by Hasan in industrial workers. The reason for the observed difference may be because of selection of different age groups.12
The prevalence higher than that of the present study was reported by Borchgrevink. They reported a prevalence rate of 27.2% in the worse ear for a hearing threshold of >25 dB, averaged over 0.5, 1, 2 and 4 kHz.5
N.S.S.O has reported that the prevalence in 20-24 years age was 200 per 100000 in urban and 118 per 100000 in rural areas while in the age group of 60 and above was 1551 and 1368 per 100000 in urban and rural areas respectively.10
A multicentric study conducted by I.C.M.R, it was observed that the prevalence of hearing loss in rural areas was 10.7% as compared to 6.8% in urban areas.11
In contrast to the finding of this study that hearing impairment is more in rural areas as compared to urban areas, Kameswaran has reported that the prevalence of deafness was 23.7% in the urban areas of Virdhunagar while in the rural areas of Varichiyur it was 11.7%.13
CONCLUSION
It can be concluded from our study that a high prevalence of hearing impairment was found in the study. Increasing prevalence of hearing impairment was observed with advancing age.
ACKNOWLEDGEMENTS
I would like to express my profound gratitude to all the participants.
Funding: No funding sources Conflict of interest: None declared
Ethical approval: The study was approved by the Institutional Ethics Committee
REFERENCES
1. Das C, Sanasam JC, Chukhu N, Bimol N. A study of the incidence and causation of deafness among the children in the tribal population of Manipur and its prevention. IJO HNS. 1999;51:11-5.
2. WHO. Factsheet on prevalence and causes of
hearing impairment. 2006.
3. ICMR. Primary and secondary prevention of
hearing impairment in rural areas. ICMR Bulletin. 1993;23:15-20.
4. Lee DJ, Caban AJ, Marin OG, Lam BL, Zheng DD.
Prevalence of hearing and visual impairment in US adults: the national health interview survey, 1997-2002. Am J Public Health. 2005;95:1940-2.
5. Borchgrevink HM, Tambs K and Hoffman HJ. The
Nord Trendelag Norway audiometric survey 1996-98: Unsceened thresholds and prevalence of hearing impairment for adults >20 years. Noise and Health. 2005;7:1-15.
6. Wilson DH, Walsh PG, Sanchez L, Taylor AW, Tucker G, Meagher I. The epidemiology of hearing impairment in an Australian adult population. International J Epidemiol. 1999;28:247-52.
7. Pal J, Bhatia ML, Prasad BG, Dayal D, Jain PC. deafness among the urban community- An epidemiological survey at Lucknow (U.P). Indian J Med Res. 1974;62:862-7.
8. Liu XZ, Xu LR, Hu Y, Nance WE, Sismanis A, Zhang SL, et al. Epidemiological studies on hearing impairment with reference to genetic factors in Sichuan, China. Ann Otol Rhinol Laryngol. 2001;110:356-63.
9. Job A, Raynal M, Tricoire A, Signoret J, Rondet P. Hearing status of French youth aged from 18 to 24 years in 1997: a cross-sectional epidemiological study in the selection centres of the army in Vincennes and Lyon. Rev Epidemiol Sante Publique. 2000;48:227-37.
10. National sample survey organization. Disability status in India 58th round report, 2002.
11. ICMR. Collaborative study on the prevalence and aetiology of hearing impairment. Indian council of medical research and department of science and technology, New Delhi, 1983.
12. Hasan SA, Hashmi SF, Hussain ND, Ashraf M. Noise induced hearing loss- An occupational hazard. Indian J Otol. 2005;11:17-21.
13. Kameswaran S. Hearing studies in Madurai. II all India workshop on speech and hearing problems in India, 1967.