Original Research Article
Nutritional status of the pre-school children in UHTC area of
Santhiram Medical College, Nandyal, Kurnool district
B. S. Isaac Ebenezer, Marupuri Sushma*, M. A. Mushtaq Pasha,
Afsar Fatima, D. K. Veereshappa
INTRODUCTION
As per WHO ―Malnutrition refers to deficiencies, excesses, or imbalances in a person‘s intake of energy and/or nutrients.1‖
The term malnutrition covers 2 broad groups of conditions. One is ‗under nutrition‘—which includes stunting (low height for age), wasting (low weight for height), underweight (low weight for age) and micronutrient deficiencies or insufficiencies (a lack of important vitamins and minerals). The other is overweight, obesity and diet-related non communicable
diseases (such as heart disease, stroke, diabetes and cancer).
Malnutrition affects people in every country. Around 1.9 billion adults worldwide are overweight, while 462 million are underweight. An estimated 41 million children under the age of 5 years are overweight or obese, while 159 million are stunted and 50 million are wasted. Adding to this burden are the 528 million or 29% of women of reproductive age around the world affected by anaemia, for which approximately half would be amenable to iron supplementation.1
ABSTRACT
Background: Malnutrition is one of the major problems in the world which suffers middle income countries in the world, malnutrition is mainly of two types over weight and underweight, the present topic is concerned to the underweight of the children among the age group between 3 yrs to 6 yrs. The aims and objectives of the study were to assess the nutritional status of children among 3-6 yrs in UHTC area of SRMC Nandyal and to identify the influence of education, occupation, and socio economic status on the nutritional status of preschool children.
Methods: Community based on cross sectional study. Sampling method used is 4pq/l2. Sample size was 210.
Results: Total numbers of participants in the study are 210 members. 58% are males and 42.4% are females. Among the participants 42.4% fathers and 53.8% mothers are illiterates who occupy the majority. In occupation majority of the fathers and mothers are working as unskilled labour i.e. 61.4% and 53.3%. Among the participants majority of them belong to class IV i.e. 48.6%. When we see the grading of malnutrition 51% of them are moderately malnourished. Significance difference has been observed among the educational status of the mother and the nutritional status of the baby.
Conclusions: In the present study most the children malnourished are boys. Education of mother played major role in degree of malnutrition higher the educational status lowers the malnutrition.
Keywords: Urban health training center, Malnutrion, Pre-school children, Under weight
Department ofCommunity Medicine, Santhiram Medical College, Nandyal, Kurnool, Andhra Pradesh, India
Received: 04 February 2018
Accepted: 07 March 2018
*Correspondence:
Dr. Marupuri Sushma,
E-mail: [email protected]
Copyright: © the author(s), publisher and licensee Medip Academy. This is an open-access article distributed under the terms of the Creative Commons Attribution Non-Commercial License, which permits unrestricted non-commercial use, distribution, and reproduction in any medium, provided the original work is properly cited.
Even malnutrition is considered both under weight and overweight mainly the affected people are the under nourished groups only.1
Children health status mainly resembles the nutrition of the country and also the economic condition.1
In 2016, an estimated 155 million children under the age of 5 years were suffering from stunting. Around 45% of deaths among children under 5 years of age are linked to under nutrition. These mostly occur in low- and middle-income countries.1
Women, infants, children and adolescents are at particular risk of malnutrition. Optimizing nutrition early in life—including the 1000 days from conception to a child‘s second birthday—ensures the best possible start in life, with long-term benefits.1
Poverty amplifies the risk of, and risks from, malnutrition. People who are poor are more likely to be affected by different forms of malnutrition. Also, malnutrition increases health care costs, reduces productivity and slows economic growth, which can perpetuate a cycle of poverty and ill health.1
Aims and objectives
To assess the nutritional status of children among 3-6yrs in UHTC area of SRMC Nandyal.
To identify the influence of education, occupation, and socio economic status on the nutritional status of preschool children.
METHODS
Study design
This study was community based cross sectional study among the preschool children residing in the UHTC area of Santhiram medical college,Nandyal.
Study period
August 2017 to September 2017, sample size is 210.
Study area
Urban Health Training Centre Area of Santhiram Medical College, Nandyal, Kurnool, Andhra Pradesh.
Sampling method
Preschool children in UHTC area, 4pq/l2 according to NFHS IV prevalence in urban area of Andhra Pradesh 15.5%. P=prevalence, q=(1-p), l= allowable error (5%). Sample size is 210.
Questionnaire included the socio demographic components, anthropometric measurements.
Data collection is done under the guidance of respective mother/ guardian with informed consent.
Statistical analysis
The collected data were entered in MS excel sheet and data analysis was done using SPSS – 22 software. Data were expressed in frequencies and percentages.
Inclusion criteria
Inclusion criteria were children under the age group between 3 years to 6 years; participants who are willing to do the study.
Exclusion criteria
Exclusion criteria werechildren who are severely ill and lost the weight since 1 month are not included; who are not willing to participate.
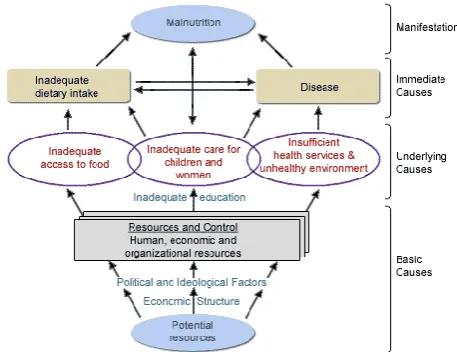
Figure 1: Conceptual framework of the causes of malnutrition in the society.
Source: UNICEF,1998.
RESULTS
Table 1: Age distribution.
Years Frequencies (n) Percentage (%)
3 yrs 46 21.9
4 yrs 107 51
5 yrs 57 27
Total 210 100
The study participants finally involved 210 participants 21.9% belongs to 3 years, 51% belongs to 4 years, 27.1% belong to 5 yrs.
Table 2: Fathers education.
S.no Education status
Frequency (n)
Percentage (%) 1. Illiterate 89 42.4
2. Primary school 28 13.3
3. Middle school 44 21.0
4. High school 10 4.8
5. Intermediate 18 8.6
6. Degree 21 10 Total 210 100
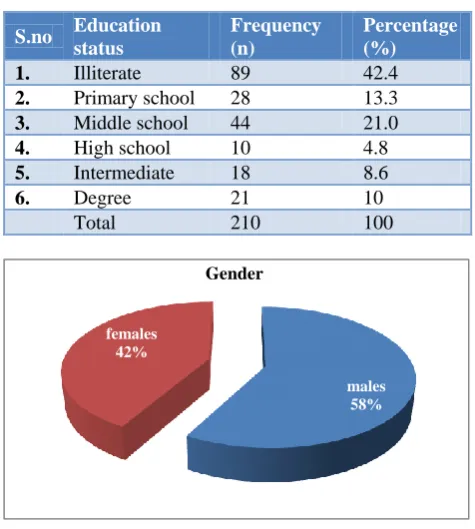
Figure 2: Gender distribution.
Among the gender distribution 58% are males and females 42%.
Among the participants mothers education illiterate are 53.8%, followed with intermediate 25.7%, primary school 10.5%, middle school 2.4%, high school 7.6%.
Table 3: Mothers education.
S.no Education status
Frequency (n)
Percentage (%) 1. Illiterate 113 53.8
2. Primary school 22 10.5
3. Middle school 5 2.4
4. High school 16 7.6
5. Intermediate 54 25.7
Total 210 100
Among all the participants 61.4% father‘s occupation is unskilled labour, 14.8% are skilled labour, 12.4% are doing business, 5.2% are professionals, 2.9% are unemployed, 2.4% are semi professionals, only 1% are farmers (Table 4).
In given participants 53.3% are unskilled labour, unemployed are 31.4%, semi profession are 8.1%, business are 2.4% (Table 5).
Among the 210 participants, Class IV are 48.6% followed with class III are 29%, 12.9% belongs to class I, class II belongs to 8.6%,only 1% belongs to class V.
Table 4:Father occupation.
S.no Occupation Frequency (n)
Percentage (%) 1. Unemployed 6 2.9
2. Unskilled labour 129 61.4
3. Skilled labour 31 14.8
4. Farmer 2 1.0
5. Semi profession 5 2.4
6. Profession 11 5.2
7. Business 26 12.4
Total 210 100.0
Table 5:Mothers occupation.
S.no: Occupation Frequency (n)
Percentage (%) 1. Unemployed 66 31.4
2. Unskilled labour 112 53.3
3. Skilled labour 10 4.8
4. Semi profession 17 8.1
5. Business 5 2.4
Total 210 100.0
Table 6: Distribution among the socio economic class.
S.no Socio economic class
Frequency (n)
Percentage (%) 1. Class I 27 12.9
2. Class II 18 8.6
3. Class III 61 29.0
4. Class IV 102 48.6
5. Class V 2 1.0
Total 210 100.0
Table 7: Distribution of participants depending on grading.
S.No Malnutrition grading
Frequency (n)
Percentage (%) 1. Normal 9 4.3
2. Mild 84 40.0
3. Moderately 107 51.0
5. Severely 10 4.8
Total 210 100
In the present study among the 210 participants 51% belong to moderately malnourished.
Mothers education plays major role in the nutritional status of the children is clearly seen in the above table, in illiterate mothers 75 members are moderately malnourished, among primary school educated mothers 28 members are mildly malnourished and 18 members are moderately malnourished, among high school educated mothers 13 members are mildly and only 3 members are moderately malnourished, among
males 58% females
42%
intermediate mothers 2 members are mildly malnourished and 3members are moderately malnourished.
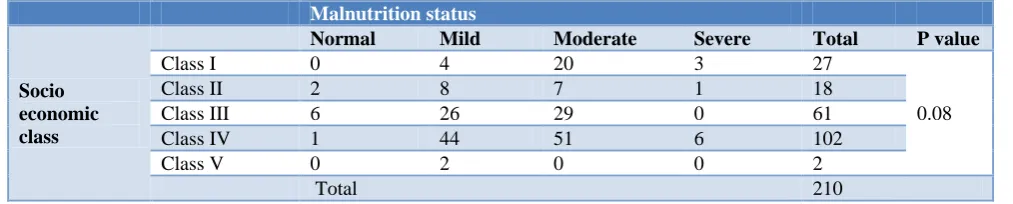
In the present study majority of the moderately malnourished children are seen in class IV i.e. 102
members and p value is 0.08 which does not show gross significance but definitely socio economic status have effect on the nutritional status of children. Socio economic status has been classified depending on the modified Kuppuswamy classification.
Table 8: Influence of mothers education on malnutritional status.
Educational status Normal(n) Mild (n) Moderate Severe P value
Illiterate 4 29 75 5
<0.01
Primary school 3 28 18 5
Middle school 0 13 3 0
High school 2 12 08 0
Intermediate 0 02 03 0
Table 9:Effect of socio economic status on the nutritional status of the children.
Malnutrition status
Socio economic class
Normal Mild Moderate Severe Total P value
Class I 0 4 20 3 27
0.08
Class II 2 8 7 1 18
Class III 6 26 29 0 61
Class IV 1 44 51 6 102
Class V 0 2 0 0 2
Total 210
DISCUSSION
Our study mainly evaluates malnutrition among preschool children in UHTC area of SRMC, Nandyal. In this study we noted the socio demographic profile of study participants are noted and the significance difference was found among the factors of mothers education and mal nutrition. In the present study among 210 participants the socio demographic profile 51% are 4yrs old children, males are 58% females are 42%,father & mother education 42.4%,53.2% are illiterates, in father occupation 61.4% are unskilled labour, mother occupation 53.3% are unskilled labour, in socio economic status majority of them belongs to class IV. Significance difference has been observed among educational status of the mother and nutritional status, when the mother has better educational status there is decreased severity of malnutrition.
In the study conducted by the Yadav in Haryana urban and rural areas children among the 750 participants, 23.6% belong to age group of 3-4 years.3 About the age it is similar to our study. Female children are majority among 3-4yrs i.e. 29.4% among male child 24.1% belongs to 2-3yrs of age group. Among the fathers education 30% are having graduate and post graduate degree, in mothers education, 24.4% belong to middle school completion, socio economic status majority of them belong to 41.9% class IV. About the fathers education it contrast differs from the present study, and among the socio economic class there is difference. In malnutrition 45.6% belongs to mild malnutrition among
the age group of 1-2yrs, severe malnutrition 16% of them belong to same age group3.
In study conducted in northern part of West Bengal, conducted by Tigga et al among 1222 participants among them boys are 589, girls are 633 between age group of 1-5 years.4 The overall and age specific mean (MUAC) mean upper arm circumfrence was observed to be greater among boys than girls, except in case of 1 year and 4 years (p<0.05). The sex specific mean MUAC differences were also statistically significant (p=0.05). The overall age-specific prevalence of wasting did not indicate any general trend, but the prevalence of moderate and severe wasting was greater among 5 years. The association of Children of illiterate mothers and those of mothers with primary education had 1.64 times and 1.51 times greater risks of wasting (p<0.05) which is similar to our study. However, the odds of wasting were insignificantly greater in children belonging to the illiterate fathers and fathers with primary education, manual worker group and those having no electricity and toilet facilities (p>0.05). The above findings are similar to our study.4
48.20%, 10.60% and 48.30% were stunting, wasted and underweight, respectively.
Recommendations
1. Child health status represents the family & country socio economic, education and also the healthy practices.
2. In the family mother plays key role in every aspect especially the knowledge of mother and education status of mother shows significance difference among the nutrition of the children.
3. Of all these socio economic status also plays a major role.
4. Even though government is trying to provide basic nutrition to the BPL families through many programmes, like ICDS it is not reaching to the core extents.
5. Regular monitoring and repeated awareness programmes should be conducted to teach the mothers about the nutrition of the child.
Funding: No funding sources Conflict of interest: None declared
Ethical approval: The study was approved by the Institutional Ethics Committee
REFERENCES
1. WHO. Available at: http://www.who.int/ media-centre/factsheets/malnutrition/en/. Accessed on 3 August 2017.
2. Unicef conceptual work in 1998.
3. Yadav SS, Yadav ST, Mishra P, Mittal A, Kumar R, Singh J. An epidemiological study of malnutrition among the under five of rural and urban areas of Haryana. J Clin Diagn Res. 2016;10(2):7–10. 4. Tigga PL, Sen J, Mondal N. Association of some
socio-economic and socio- demographic variables with wasting among pre- school children of North Bengal, India. Ethiop J Health Sci. 2015;25(1):63-72.
5. Biswas S, Bose K, Mukhopadhyay A, Bhadra M. Prevalence of undernutrition among pre-school children of Chapra, Nadia District, West Bengal, India, measured by composite index of anthropometric failure (CIAF). Anthropol Anz. 2009;67(3):269-79.
6. Barkley J, Newton C, Maitland K. Severe malnutrition assessment in children in rural Kenya. JAMA. 2005;294:2577.
7. Maiti S, De D, Ali KM, Ghosh A, Ghosh D, Paul S. Evaluation of Nutritional Status by Mid-Upper Arm Circumference amongst affluent children. J Nepal Paediatr Soc. 2012;32:113-6.