Original Research Article
Construction of nuptiality tables for the hilly rural population of
Uttarakhand: 1931-2000
Shubham Pandey*, Ankit Singh, Saumya Awasthi, Supreet Kaur
INTRODUCTION
Marriage is an important social event from which a person starts his/her marital union. Marriage can protect mental health by giving people a greater sense of emotional support and care in their lives and allowing them to fill multiple social roles.1 Married people have higher levels of psychological and physical well-being than individuals who are single, separated or divorced.2 The life table, an analytical model which follows a birth cohort through life and through the never married, presently married, widowed and divorced statuses, is developed and applied to the data from the hilly rural
areas of Uttarakhand.3 Hajnal 's (1953), singulated mean age at marriage (SMAM) which estimates the timing and incidence by utilising proportions single in a census.4 The singulate mean age at marriage of females in 1961 was 16 and is above 22 years today.5 In the past, the primary role of women was to bear and raise children. Today, this role is still central, but has been modified somewhat given the increasing participation of women in higher education and in the labour force.6 Legislation relating to the above policy was enacted by the Parliament in February 1978. Contravention of the child marriage Act became cognizable offence from October 1978. The Act rose the marriageable age from 15 to 18 years for girls and from 18 to 21 for boys. Though the legal age at marriage is
ABSTRACT
Background: Nuptiality has a strong association with socio demographic and socio economic change in society. So, it has immense importance to study the female age at marriage in society. In order to study the nuptiality pattern in rural areas of Uttarakhand State, India, a number of measures like crude marriage rate, age sex specific marriage rates and similar other rates are used in the nuptiality tables.
Methods: This paper deals with the study on the change in the nuptiality pattern through the life table approach in the seven cohorts 1931-40, 1941-50, 1951-60, 1961-70, 1971-80, 1981-90 and 1991-2000. It is observed that the rates are changing with time. We also calculate expected number of years of single life remaining to a single person at age x. It is also observed that the age at marriage is increasing as the time passes. The data for this has been collected through the primary collection technique and the paper includes all the nuptiality tables for the seven cohort systems.
Results: It is observed that the rates are changing with time. No significant time trend has been observed in the nuptiality rates among the single population of hilly rural area of Uttarakhand. From the table we can see that initially, at the age group 10 the rate is small and it increases rapidly till it reaches to maximum at the age group 20.
Conclusions: In the field of marriage for the Indian population, it is suggested that development and examination of nuptiality tables over various periods would constitute a distinct progression in the investigation of Indian nuptiality.
Keywords: Nuptiality, Life table, Hilly rural population
Department ofBio-statistics, Himalayan Institute of Medical Sciences, SRHU, Dehradun, Uttarakhand, India
Received: 29 December 2017
Accepted: 02 February 2018
*Correspondence:
Dr. Shubham Pandey,
E-mail: [email protected]
Copyright: © the author(s), publisher and licensee Medip Academy. This is an open-access article distributed under the terms of the Creative Commons Attribution Non-Commercial License, which permits unrestricted non-commercial use, distribution, and reproduction in any medium, provided the original work is properly cited.
raised, early marriages continue to persist in Indian Society.7
This study aims to review the trends and changes in the female nuptiality over the period 1931- 2000. It has been performed not only on the married but the unmarried too. This work attempts to examine the scenario of marriage in Uttarakhand state of India. The aim of current work is to construct nuptiality estimation for hilly rural settings of Uttarakhand by the context of life table approach. The aim of this study is to examine and compare the methods of nuptiality estimation by comprehending the nature and magnitude of changes in the age at marriage of females. This study also focuses on the context about what degree early marriages occur violating the legitimate stipulation of law in the hilly rural population of Uttarakhand.
METHODS
The study was conducted in hilly rural areas of Uttarakhand which includes the subjects of the study as local residents of selected hilly rural population of Uttarakhand state. Women, who were ever married and unmarried and born in between 1931 to 2000, were included in the study and those who are born before 1931 and after 2000, who are unable to give their history because of mental illness, physical disability and who were not signing the informed consent are excluded from the study.
Data and methodology
The data for the study has been collected through the primary data collection technique. `The collection of data has been done for each cohort by the process of household survey using designed questionnaire. The birth cohorts have been taken from the tenure 1931-2000 with decade differences. The data has been be analyzed by using SPSS 21.0 version software. The method followed for the estimation of Nuptiality rates for a decade was adopted from that of Mertens (1965).4
We assume the incidence of mortality to be the same for the single as for the total population and the single population to be depleted by two modes of decrement, namely, marriage and death. The following symbols has been used:
x: Age at years;
nMx: central marriage rate. lx: Number single at age x.
nLx: Number of years lived as never married in the year of age (x, x+n)
Tx: Number of years lived as never married above age x. ex0: Expected number of years of single life remaining to a single person at age x.
Ethical approval
The study has been approved by the Ethics Committees of Swami Rama Himalayan University, Jolly Grant, Dehradun. Informed consent in the local language had been taken from subjects during filling designed questionnaire, in written.
RESULTS
The gross nuptiality tables for female nuptiality of rural population of Uttar Pradesh, India for the periods 1931-40, 1941-50, 1951-60, 1961-70, 1971-80, 1981-90 and 1991-2000 have been constructed in the Table 1-7 respectively.
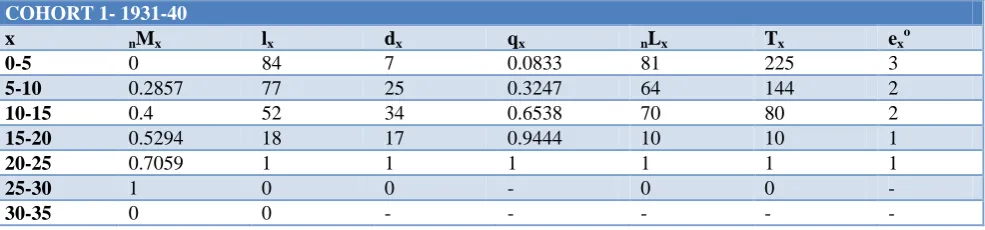
It is observed from the above table that the central marraige rate (nMx) is in an increasing trend till age of 25 but it declines as it moves to age group of 35. The survivorship decreases from the consecutive age group 0-5 to 30-30-5. The expected number of years of single life remaining to a single person at age x for the cohort 1931-40 and other two periods 1951-60 and 1961-7- are found to be the same.
The second cohort 1941-50 unlike the period 1931-40 shows a decline in survivorship lx and in the proportion of marriage. The person-years life remaining decreases as the age groups increases. We can clearly see that expected number of single life to a single person at age x is low for the period 1941-51 and high for the period 1991-00 i.e. clearly indicating that the age at marriage is increasing as the time passes, the female marriage pattern exhibits wider variations from state to state in India with regard to magnitude and direction. But from the following table it was observed that in rural Uttarakhand highest frequency occurs in 0-5 age group.
Table 1: Table for nuptiality estimation for 1931-40.
COHORT 1- 1931-40
x nMx lx dx qx nLx Tx exo
0-5 0 84 7 0.0833 81 225 3
5-10 0.2857 77 25 0.3247 64 144 2
10-15 0.4 52 34 0.6538 70 80 2
15-20 0.5294 18 17 0.9444 10 10 1
20-25 0.7059 1 1 1 1 1 1
25-30 1 0 0 - 0 0 -
Table 2: Table for nuptiality estimation for 1941-50.
COHORT 2 (1941-50)
x nMx lx dx qx nLx Tx exo
0-5 0 137 8 0.0583 133 298 2
5-10 0.25 129 35 0.2713 112 187 1
10-15 0.6 94 64 0.6809 32 165 2
15-20 0.7189 30 25 0.8333 18 22 1
20-25 0.84 5 4 0.8 3 4 1
25-30 1 1 0 0 1 1 1
30-35 0 1 - - - - -
Table 3: Table for nuptiality estimation for 1951-60.
COHORT 3 (1951-60)
x nMx lx dx qx nLx Tx exo
0-5 0 209 4 0.0191 207 558 3
5-10 0.5 205 41 0.2 186 351 2
10-15 0.6579 164 105 0.6287 115 165 1
15-20 0.8190 59 46 0.7419 39 50 1
20-25 0.7826 13 13 0.8125 10 11 1
25-30 0.7692 0 0 1 2 2 1
30-35 1 0 - - - - -
Table 4: Table for nuptiality estimation for 1961-70.
COHORT 4 (1961-70)
x nMx lx dx qx nLx Tx exo
0-5 0 210 1 0.0076 210 715 3
5-10 1 209 13 0.0622 203 505.5 2
10-15 0.6923 196 110 0.5612 241 303 2
15-20 0.8818 86 70 0.8140 51 62 1
20-25 0.9 16 13 0.8125 10 11 1
25-30 0.9286 3 0 0 2 1.5 1
30-35 1 0 - - - - -
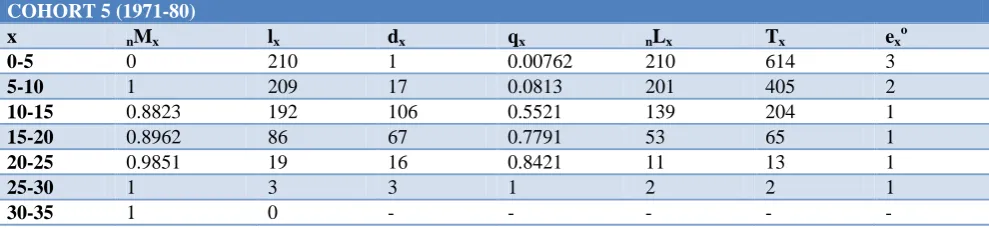
Table 5: Table for nuptiality estimation for 1971-80.
COHORT 5 (1971-80)
x nMx lx dx qx nLx Tx exo
0-5 0 210 1 0.00762 210 614 3
5-10 1 209 17 0.0813 201 405 2
10-15 0.8823 192 106 0.5521 139 204 1
15-20 0.8962 86 67 0.7791 53 65 1
20-25 0.9851 19 16 0.8421 11 13 1
25-30 1 3 3 1 2 2 1
30-35 1 0 - - - - -
On comparing the two nuptiality tables for the two cohorts 1951-1961, we observe that the rates decline in the period 1961-1971 for all the respective age groups when compared with the time period 1951-1961. This similarity in trend is also observed for all the period under consideration. The expected number of years of single life remaining to a single person at age x are same.
For the periods 1931-1940, 1951-61, 1961-1971, 1981-1991 Although, expected number of years increase for the further consecutive periods which indicates that as the time passes, the age at marriage increases slowly but still it is more or less same at age of 20 and 25.
the seven consecutive decades 1931-40, 1941-50, 1951-60, 1961-70, 1971-80, 1981-90 and 1991-2000. It is observed that the rates are changing with time. No significant time trend has been observed in the nuptiality
rates among the single population of hilly rural area of Uttarakhand. From the table we can see that initially, at the age group 10 the rate is small and it increases rapidly till it reaches to maximum at the age group 20.
Table 6: Table for nuptiality estimation for 1981-90.
COHORT 6 (1981-90)
x nMx lx dx qx nLx Tx exo
0-5 0 210 0 0 210 659 3
5-10 0 210 7 0.0333 206.5 449 2
10-15 1 203 94 0.4631 156 242 1
15-20 0.9681 109 84 0.7706 67 86 1
20-25 1 25 20 0.8 15 19 1
25-30 1 5 2 0.4 4 4 1
30-35 1 3 - - - - -
Table 7: Table for nuptiality estimation for 1991-2000.
COHORT 7(1991-2000)
x nMx lx dx qx nLx Tx exo
0-5 0 210 0 0 210 819 4
5-10 0 210 3 0.0143 209 609 3
10-15 0.6667 207 61 0.2947 177 400 2
15-20 0.9677 146 46 0.3151 123 224 2
20-25 0.9783 100 1 0.01 100 101 1
25-30 1 99 0 0 1 1 0
30-35 - 99 - - - - -
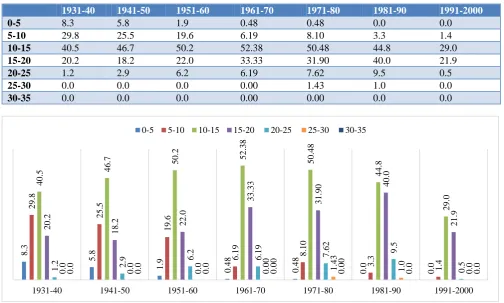
Table 8: Proportion of female nuptiality during the period of cohorts 1931-2000.
1931-40 1941-50 1951-60 1961-70 1971-80 1981-90 1991-2000
0-5 8.3 5.8 1.9 0.48 0.48 0.0 0.0
5-10 29.8 25.5 19.6 6.19 8.10 3.3 1.4
10-15 40.5 46.7 50.2 52.38 50.48 44.8 29.0
15-20 20.2 18.2 22.0 33.33 31.90 40.0 21.9
20-25 1.2 2.9 6.2 6.19 7.62 9.5 0.5
25-30 0.0 0.0 0.0 0.00 1.43 1.0 0.0
30-35 0.0 0.0 0.0 0.00 0.00 0.0 0.0
Figure 1: Trend in female nuptiality.
8.
3
5.
8
1.
9
0.
48
0.
48
0.
0
0.
0
29.
8
25.
5
19.
6
6.
19 8.10
3.
3
1.
4
40.
5 46.
7 50.2 52.
38
50.
48
44.
8
29.
0
20.
2
18.
2 22.
0
33.
33
31.
90 40.
0
21.
9
1.
2 2.9 6.
2
6.
19 7.62 9.5
0.
5
0.
0
0.
0
0.
0
0.
00 1.43
1.
0
0.
0
0.
0
0.
0
0.
0
0.
00
0.
00
0.
0
0.
0
1931-40 1941-50 1951-60 1961-70 1971-80 1981-90 1991-2000
DISCUSSION
On comparing with the study by Trussell, we observed that the principal finding of an analysis of the comparative static and dynamic aspects of changing nuptiality was that the greater the degree of duration-dependent fertility control, the less the permanent change in total fertility produced by nuptiality change, and the more pronounced the transient change.8 Trends and changes in fertility during the last two decades have been reviewed in the paper “Effects of marital fertility and nuptiality on fertility transition”.9 This study of construction of nuptiality helps us to determine the extent to which the marriage and the probability of marrying has been fluctuating over time. It determines about how the changes in the mean age of marriage over time and to what extent the proportion of women who ever marry might have been fluctuating with time.
It is contrary to the earlier study by Yie et al, as women married before age have high risk of divorce than those married at the later ages.10 It may also help us to assess the average number of years for a single life that was expected to be live before marriage and to compare the trend over time.
Historically changes in the nuptiality pattern has played very significant role with respect to demographic transitions in many of the European countries.11 Female age at marriage is becoming an important demographic variable due to its influence on fertility and population growth, especially in countries like Oman where rates of contraceptive use are still low.12 To further examine the changes in nuptiality in urban and rural sectors, direct estimates of mean age at marriage of females are obtained from the retrospective responses of individual-level survey data could probably be due to mis-statement of the age at marriage by older rural women, they having been married in the distant past.13 Modernization and the family planning program may have opposite effects on fertility. Under these circumstances, fertility levels among women in different states in India must be analysed separately, for older and younger age groups, using different indexes to measure overall fertility, marriage rates, marital fertility, and contraceptive use in relation to selected social and economic factors.14 Evidences are on the rise in recent years too, to support the argument that nuptiality reductions produce a retarding effect on fertility by analyzing the data from several Asian countries, Cho and Retherford, demonstrated that marital factors have contributed substantially towards the reduction of fertility.15 Lestheghe analyzed the impact of nuptiality on fertility and growth rates of a series of populations from developing nations where extra marital fertility was negligible and found that nuptiality changes can produce the same effect on birth and growth rates as changes in marital fertility.16 The results of the study are consistent with the findings of other studies which indicate that
educational attainment and employment reduce women’s’ likelihood of early marriage.17-19 Lestheghe analyzed the impact of nuptiality on fertility and growth rates of a series of populations from developing nations where extra marital fertility was negligible and found that nuptiality changes can produce the same effect on birth and growth rates as changes in marital fertility.17
In this study, a detailed examination of nuptiality pattern and differentials in hilly rural areas of Uttarakhand has been explained. The main focus is on age of entry into marital union, marital stability and pregnancy outcome among cultural groups in rural Uttarakhand.
This study may shed important light on impact of government rules, act and policy on fertility differential such as drastic reduction in marital fertility; discourage early marriage and early initiation of childbearing.
It is observed that nuptiality is changing with time. The female nuptiality as observed in the graph explains the decline in the number of marriages in age group 0-5 as the time increases. In the early cohort of 1931-40, about 8% of marriages were under process representing the higher trend, but as the tenure of the cohort increased the system gradually declined.
CONCLUSION
In the field of marriage for the Indian population, it is suggested that development and examination of nuptiality tables over various periods would constitute a distinct progression in the investigation of Indian nuptiality. A relative investigation of nuptiality tables over various periods may help us to decide the degree to which marriage rates with probabilities of wedding and the changing example of mean ages at marriage. In perspective of the over, this examination inspects nuptiality status in rural population of Uttarakhand, with specific reference to changes in marriage age after some time.
Funding: No funding sources Conflict of interest: None declared Ethical approval: Not required
REFERENCES
1. Burton RPD. Global integrative meaning as a mediating factor in the relationship between social roles and psychological distress. J Health Social Behavior. 1998;39(3):201-15.
2. Horowitz, Allan V, McLaughlin J, White HR. How the negative and positive aspects of partner relationships affect the mental health of young married people. J Health Social Behavior, 1997;39(2):124-36.
4. Hajnal J. Acje at Marriage and Proportions Marrying. Population Studies. 1953;7(2):111-33. 5. NIPS. Pakistan Ferility and Family Planning
Survey: 1996-97: Preliminary Report. National Institute of Population Stdies. Islamabad, 1998. 6. Eickelman C. Oil, Fertility, and Women’s Status in
Oman. In: Bowen DA, Early EA, editors. Everyday Life in the Muslim Middle East. Bloomington, Indiana: Indiana University Press; 2002: 128–135. 7. Pathak KB. Law and Age at Marriage for Females
in India. Social Work. 1980;49(4):407-16.
8. Wlter M. Methodological Aspects of the Construction of Nuptiality Tables. Demography. 1965;2:317-48.
9. Trussell J, Menken J, Coale A. A general model for analyzing the effect of nuptiality and fertility, in Nuptiality and Fertility: Proceedings of a Conference, edited by L. Ruzicka. Liege (France): Ordina Editions; 1981: 7–26.
10. Abbasi-Shavazi MJ. Demography Program Research School of Social Sciences; Effects of Marital Fertility and Nuptiality On Fertility Transition in the Islamic Republic of Iran, 1976-1996.
11. De Walle V, Etienne. Marriage and Marital Fertility. In: D. V. Glass and Roger Revelle (eds.), Population and Social Change. Edward Arnold, 1972.
12. Zeng Y, Schultz, Paul T, Wang D, Danan, Gu D. Association of divorce with socio demographic covariates in China, 1955-1985: Event history analysis based on data collected in Shanghai, Hebei, and Shaanxi. Demographic Res. 2002;7(11):407-32.
13. Al-Riyami A, Afifi M, Mabry RM. Women’s autonomy, education and employment in Oman and their influence on contraceptive use. Reprod Health Matter. 2004;12:144–54.
14. Naushin M, Ali SM. Nuptiality Patterns in Pakistan. Islamabad: Pakistan Institute of Development Economics. Studies in Population, Labour Force and Migration, Report No. 2, 1984.
15. Srinivasan K. Natural fertility and nuptiality patterns in India: historical levels and recent changes. Population transition in India. In: Singh SN, Premi MK, Bhatia PS, and Bose A, eds. Delhi, India, B.R. Publishing, 1989: 173-92.
16. Cho-lee-Jay, Retherford RD. Comparative Analysis of Recent Fertility Trends in EastAsia. International Population Conference, Liege, 1973;2:163-81. 17. Ron L. Nuptiality and Population Growth.
Population Studies, 1971;25(4):416-33.
18. Choe MK, Thapa S, Mishra V. Early marriage and early motherhood in Nepal. J Biosoc Sci. 2004;37:143–62.
19. Fargues P. Women in Arab countries: Challenging the patriarchal system? Reprod Health Matter. 2005;13:43–8.