Original Research Article
Assessment of nutritional status of primary school children in urban
field practice area, Vijayapura
Sandeep G. Yankanchi, Praveen Ganganahalli*, Rekha Udgiri, Shailaja S. Patil
INTRODUCTION
Children are future citizens and their health is nation‟s wealth. There is a meaningful saying that “nation marches on tiny feet of young children and no nation without due love and attention paid to its children will lead to social and economic development.” Health
promotion of children will strengthen the development of the family, nation and world.1
Nearly half of all deaths in under five children are attributable to under nutrition, about 3 million young lives a year. Under nutrition puts children at greater risk of increase the frequency, severity and dying from
ABSTRACT
Background: Children are nature`s gift and fountain of life. They are future citizens and their health is nation`s wealth. There is a meaningful saying that „nation marches on tiny feet of young children and no nation without due love and attention paid to its children will lead to social and economic development. By promoting their good health we will be strengthening the development of the family, nation and world. As per National Family Health Survey IV, 38.4% children in India are stunted, 21% wasted and nearly 35.7% are under weight. Karnataka has a prevalence of stunting (36.2%), wasting (26%) and underweight (35.2%). The objective was assessment of nutritional status of primary school children of urban field practice area.
Methods: A cross-sectional study was conducted in Maddy primary school located in Dorgalli, Urban field practical
area, Chandabowdi, dept. of Community Medicine, Shri B.M. Patil medical college hospital and Research centre, Vijayapura. All children were assessed for nutritional status by taking anthropometric measurement like Height, Weight and also for nutritional deficiency disorders by detailed general physical examination. Analysis was done using frequency distribution, calculation of height for age, weight for age, weight for height and classified malnutrition according to IAP and Water low‟s classification.
Results: Around 57% of primary school children were found to be having less weight and/or height with respect to
their age and sex.
Conclusions: The present finding is going to affect the growth and development primary school age children who are
more vulnerable for vicious cycle of malnutrition and infection. Regular monitoring of growth of primary school children and health education session for the mothers is going to be effective in prevention of malnutrition among the children.
Keywords: Malnutrition, Height, Weight, Primary school children
Department of Community Medicine, B.L.D.E University Shri B.M. Patil Medical College, Hospital and Research Centre, Vijayapura, Karnataka, India
Received: 18 December 2017
Revised: 12 January 2018
Accepted: 13 January 2018
*Correspondence: Dr. Praveen Ganganahalli,
E-mail: [email protected]
Copyright: © the author(s), publisher and licensee Medip Academy. This is an open-access article distributed under
the terms of the Creative Commons Attribution Non-Commercial License, which permits unrestricted non-commercial use, distribution, and reproduction in any medium, provided the original work is properly cited.
common infections and such infections contributes to delayed recovery. The interaction between infection and under nutrition can create a lethal cycle of worsening illness and deteriorating nutritional status. Poor nutrition in the first 1,000 days of a child‟s life can lead to stunted growth, which is associated with impaired cognitive ability and reduced school performance.
Globally, one quarter of under five children are stunted. South Asia particularly has a high percentage of wasting (16%), high prevalence of stunting (35.8%) and overweight (4.3%) compared to other regions in the world.2 As per National Family Health Survey IV, 38.4% children in India are stunted, 21% wasted and nearly 35.7% are under weight. Karnataka has a prevalence of wasting (26%), stunting (36.2%) and underweight (35.2%) as per National Family Health survey IV.3
METHODS
A cross sectional study was conducted to assess the nutritional status of children among primary school student of Mady primary school located in urban field practice area (Dohra galli) of Community Medicine department, Shri B.M. Patil Medical College, Vijayapura. All children of selected school were enrolled in to the study after obtaining permission from Head of the school and informed verbal consent from the parents. Approval from the Institutional Ethics Committee was obtained. Weight for age, Height for age was calculated by comparing observed weight and height with standard expected weight and height for that age and sex (WHO Reference 2007).4
Weight
Weight was measured accurately using a digital scale. The scale was placed on firm flooring, the child without shoes and heavy clothing stand with both feet in the centre of the scale and the weight was recorded to the nearest decimal fraction of 0.1 kg.
Height
Height was measured accurately by making child to remove shoes, bulky clothing, and hair ornaments interfere with the measurement on flooring against a flat surface. The child was made to stand with feet flat together against the wall with legs straight, arms at sides, and shoulders at level. Mark was made where the bottom of the head piece meets the wall. Then by using a metal tape height was measured from the base on the floor to the wall to the nearest 0.1 centimetre.5
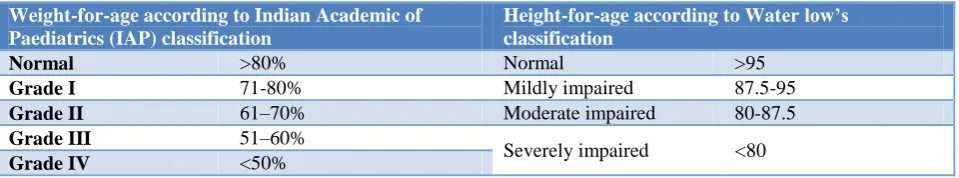
The important signs looked for during clinical examination are pallor, hair changes (sparse hair/depigmentation of hair), eye changes (conjunctival xerosis, bitot‟s spots, corneal xerosis, corneal ulceration, keratomalacia) cheilosis/angular stomatitis, Teeth changes (enamel mottling, caries, delayed eruption), Skeletal changes, goiter, skin changes (dry skin, flaky paint dermatosis, crazy pavement dermatosis) and koilonychia. All the information was entered in to the excel sheet and analysed for frequency distribution, Calculation of height for age, weight for age, weight for height and comparison with standards.IAP classification of weight for age and water low‟s classification for height for age were used to assess the grades of under nutrition and stunting respectively.6
Table 1: Classification used for grading under nutrition and stunting.
Weight-for-age according to Indian Academic of Paediatrics (IAP) classification
Height-for-age according to Water low’s classification
Normal >80% Normal >95
Grade I 71-80% Mildly impaired 87.5-95
Grade II 61–70% Moderate impaired 80-87.5
Grade III 51–60%
Severely impaired <80
Grade IV <50%
RESULTS
Total 89 children were enrolled into the study during the study period showed around 24% of under nutrition and 49% less height compared to standards.
The proportion of underweight in class-2 was more compared to other classes and the stunting was more in class-1 compared to other classes as shown in Table 2. About 9% undernourished children were having pallor
carries but there was no statistical significance was observed between grades of under nutrition and pallor, dental caries (Table 3).
Around 57% of primary school children were found to be having less weight and/or height with respect to their age and sex. There was no significant difference found in association between Weight for age and height for age (Table 4).
(60.7%) were boys and 35 (39.3%) were girls as shown in Figure 1.
The proportion of underweight in boys was 26% which was more compared to girls (20%) as shown in the Figure 2.
Table 2: Class wise distribution of children according to under nutrition and stunting.
Class Weight for age (IAP) Height for age (Waterlows)
Normal (%) Undernourised (%) Normal (%) Stunting (%)
1 28 (41) 1 (5) 15 (34) 14 (32)
2 7 (10) 12 (57) 13 (30) 6 (14)
3 13 (19) 4 (19) 7(16) 10 (23)
4 12(18) 0 (0) 3 (7) 9 (20)
5 8(12) 4 (19) 7 (16) 5 (11)
Total 68 (76) 21(24) 45(51) 44(49)
Table 3: Association between grades of under nutrition and pallor, dental caries.
Pallor Dental carries
Weight for age Present (%) Absent (%) Present (%) Absent (%)
1 30 (91) 38 (68) 13 (72) 55 (77)
2 2 (6) 9 (16) 3 (17) 8 (11)
3 1 (3) 6 ( 11) 1 (6) 6 (8)
4 0 (0) 3 (5) 1 (6) 2(3)
5 0 (0) 0 (0) 0 (0) 0 (0)
Total 33 (37) 56 (63) 18 (20) 71 (80)
Χ2=6.4 (p=0.09 ) Χ2=0.86 (p=0.83 )
Table 4: Distribution of children according to Wt for age and Ht for age.
IAP classification Weight for age
Total
Water low’s classification >80 (%) 71-80 (%) 61-70 (%) 51-60 (%)
Height for age
>95 38 (56) 5 (45) 2 (29) 0 (0) 45 87.5 TO 95 29 (43) 5 (45) 5 (71) 3 (100) 42 80 TO 87.5 1 (1) 1 (9) 0 (0) 0 (0) 2
Total 68 (76) 11 (12) 7 (8) 3 (3) 89
Chi-Square value Χ2=8.2 (p=0.21).
Figure 1: Class and gender wise distribution of children.
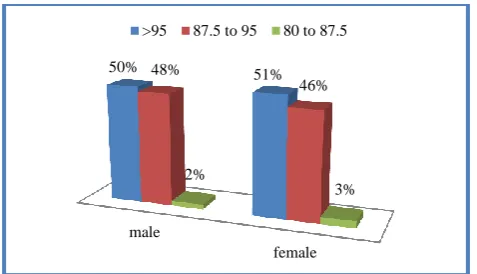
The proportion of stunting in boys was 50% which was more compared to girls (49%) as shown in the Figure 3.
Figure 2: Gender wise distribution of children according to weight for age.
The proportion of stunting in class-3 (59%), class-4 (75%) which was more compared to 1 (48%), class-2 (3class-2%), class-5 (4class-2%) as shown in the Figure 4.
1 2 3 4 5
62% 63% 59%
58% 58%
38% 37% 41% 42% 42%
male
80% 71-80% 61-70% 51-60% <50%
74%
9% 13%
4%
0% 80%
17%
0% 3% 0%
Figure 3: Gender wise distribution of children according to height for age.
Figure 4: Class wise distribution of children according to according to different grades of stunting
(Waterlow’s).
Figure 5: Class wise distribution of children according to according to different grades of under nutrition
(IAP).
The proportion of underweight in class-2 (63%), class-5 (34%) which was more compared to 1 (3%), class-3(24%), class-4 (0%) as shown in the Figure 5.
DISCUSSION
Present study showed around 24% of under nutrition and 49% less height compared to standards and around 57% of primary school children were found to be having less weight and/or height with respect to their age and sex.
was more compared to girls (49%). Fazili et al, reported a prevalence of 11.1%, 9.25% 12.3% and 29% for underweight, stunting, wasting and thinness respectively. In all the age groups more males were found to be underweight than females (p<0.01).7 In a study by Kamath et al, found that 82 children (5.03%) were found to be undernourished, 37 (2.3%) were overweight and 16 (1%) were obese. Undernourishment was more prevalent in boys (6.87%) than in girls (3.12%).8 Shivprakash et al, found overall prevalence of underweight 30.3% (147) and stunting 27.9% (135).9 In a study by Chandramohan et al, undernourishment was observed in 39 (51%) children, while overweight in only one male student (2%) respectively, Undernourishment was seen more common in boys (55%) than in girls (47%).10 In a study by Amruth et al, found that the prevalence of malnutrition among the surveyed primary school children is 26.5% and the prevalence of underweight is 26.5%. It is more among boys (31.3%) than girls (21.3%). The prevalence of stunting is 19.2%. It is more among boys (22.4%) than girls (15.7).11 In a study by Singh et al,found that 90 (30%) children were found underweight for their age, 55 (18.33%) were found overweight and 4(1.33%) were found obese. The overall prevalence of malnutrition (including underweight, overweight and obesity) was found to be 49.67%.12 In a study by Masthi et al, found that overall 64.2% were found to be normal, 9.1% were found to have severe thinness, 20.9% thinness, 4.4% overweight and 1.4% obesity. Severe thinness was found to be highest among 12 years i.e., 12.1%, thinness among 10 years i.e., 24.9%, overweight among 14 years i.e., 8.4% and obesity among 11, 14 and 15yrs i.e., 1.8%. Thinness and severe thinness were higher among males (24.2% and 12.5%) compared to females (17.6% and 5.6%).13
Present study showed that about 9% undernourished children was having pallor and 29% undernourished children were having dental carries but there was no statistical significance was observed between grades of under nutrition and pallor, dental caries. In a study by Shivprakash et al, found that Pallor was noted in 123 (25.4%). Teeth changes were noted in the form of dental caries in 137 (28.3%) and enamel mottling in 19 (3.9%).9 In a study by Amruth et al found that most of the children had dental caries (47.2%).11
CONCLUSION
Around 57% of primary school children were found to be having less weight and/or height with respect to their age and sex. As primary school age group is more vulnerable for vicious cycle of malnutrition &infection, thus present finding is going to affect their growth and development. Regular monitoring of growth of primary school children and health education session for the mothers is going to be effective in prevention of malnutrition among the children.
male
female
50% 48% 51%
46%
2%
3% >95 87.5 to 95 80 to 87.5
CLASS 1 CLASS 2 CLASS 3 CLASS 4 CLASS 5 52%
68%
41%
25%
58% 45%
32%
53%
75%
42%
3% 0 6% 0 0
>95 87.5 -95 80-87.5
CLASS 1 CLASS 2 CLASS 3 CLASS 4 CLASS 5 97%
37%
76%
100%
67%
0%
37%
12%
0%
17% 3%
21%
0% 0%
17%
0% 5%
12%
0% 0%
Funding: No funding sources Conflict of interest: None declared
Ethical approval: The study was approved by the Institutional Ethics Committee
REFERENCES
1. Shamanewadi AN, Kondagunta N. Malnutrition in Children below 6 Years in Nalgonda District, Telangana. National J Community Med. 2016;7(4):257-61.
2. Monitoring the Situation of children and women, Unicef; 2017 Available at: http://www.childinfo. org/malnutrition_status.html. Accessed on 2 May 2017.
3. International Institute of Population Sciences (IIPS). National Family Health Survey (NFHS-4); 2015-2016. Available at: http://www.rchiips.org/nfhs. Accessed on 14 June 2017.
4. Onis M de, Onyango AW, Borghi E, Siyam A, Nishidaa C, Siekmann J. Development of a WHO growth reference for school-aged children and adolescents. WHO Bull 2007;85:660–7.
5. Ganganahalli P, Tondare MB, Durgawale PM. Nutritional Assessment of Private Primary School Children in Western Maharashtra :A Cross-Sectional Study. National J Community Med. 2016;7(2):7–10.
6. Ghai OP. Essential Peadiatrics: Nutrition. 8th edition. Delhi-92;CSB Publi: 2009:88-109.
7. Fazili A, Mir AA, Pandit IM, Bhat IA, Rohul J, Shamila H. Nutritional status of school age children (5-14 years) in a rural health block of North India (Kashmir) using WHO Z-score system. Online J Heal Allied Sci. 2012;11(2):11–3.
8. Kamath R, Kumar M, Pattanshetty S, Kamath A. Nutritional status assessment of school children in Mangalore city using the multicenter growth reference study WHO 2007 Z-scores. Int J Nutr Pharmacol Neurol Dis. 2012;2(3):233-6.
9. Shivprakash NC, Joseph RB. Nutritional Status of Rural School-Going Children (6-12 Years) of Mandya District, Karnataka. Int J Scientific Study. 2014;2(2):39–43.
10. Chandramohan S, Khan J, Jain Raj. R. Nutritional Status Assessment of Primary school children in Udupi District Karnataka: A Cross Sectional Study. Int J Applied Res Studies. 2015;4(3):1-6.
11. Amruth M, Kumar S, Kulkarni A, Kamble S, Ismail I. A study on nutritional status and morbidity pattern among primary school children in Sullia town, South India. Indian J Basic Applied Med Res. 2015;4(4):100–12.
12. Inkhiya S, Bika MS, Shekhawat K et al. A cross-sectional study to assess prevalence of malnutrition in school children 6-12 years of age of Bikaner, Rajasthan. International Journal of Advanced Research. 2016;2(5):867–70.
13. Ramesh Masthi NR, Madhusudan M, Gangaboraiah. Nutritional status of school age children (6-15 years) using the new WHO growth reference in a rural area of Bangalore, South India. National J Res Community Med. 2017;6(2):144-50.
Cite this article as: Yankanchi SG, Ganganahalli P,