www.ijaera.org 2017, IJA-ERA - All Rights Reserved 689 raw milk’s quality if certain basic quality tests are carried out at various stages of transportation of
milk from the producer to the processor and finally to the consumer. In our project, we are carrying out several methods for checking the quality of milk one such method is with the help of digital pH meter and displaying it in LabVIEW through image processing technique. Another test involves lactometer test comprising a level indicator and finally displaying the quality check results in LabVIEW.
Keywords: LabVIEW, pH Meter, Image Processing, IMAQ Module
I. INTRODUCTION
Milk being made up of 87% water is prone to adulteration by money motivated persons and unfaithful farm workers. But, due to its high nutritive value makes it an ideal medium for the rapid multiplication of bacteria, particularly under unhygienic production at ambient temperatures. It is known that, if a processor should make good dairy products, good quality raw materials are essential. A quality control system will test milk and milk products for quality, and ensure that milk processors, collectors and marketing agencies follow the correct methods [1-4]. This system would cost a lot of money. But it is very important to have a good system, because it is beneficiary to everyone involved in the dairy industry. Milk producers with a good quality controlling system will ensure farmers to get a fair price for their milk. Milk processors who pays the farmer can be sure that the milk is of good quality and is suitable for making various dairy products. Consumers will pay a fair price e.g. moderate price for medium quality, high price for excellent quality. Government agencies with a good system, the government can help in the protection of consumer’s health, prevent contaminated and sub-standard products, and assures that everyone pays or receives a fair price [5]. All this is possible only if we have a strict system for considering the quality testing and assurance, which conforms to international or nationally acceptable standards.
II. EXPERIMENTATION AND SIMULATIONS
A) Experimentation
www.ijaera.org 2017, IJA-ERA - All Rights Reserved 690 Figure 1: Setup Used in present work.
Yellowish with small lumps or completely coagulated. Sour milk
Lilac and it may be mastitis milk. Clots and flakes too, indicate mastitis milk. Alkaline milk
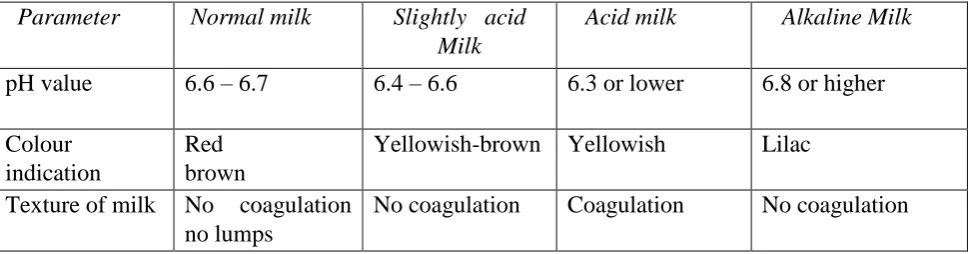
Table 1. Tabulation Related to Different Parameters in Milk
Parameter Normal milk Slightly acid Milk
Acid milk Alkaline Milk
pH value 6.6 – 6.7 6.4 – 6.6 6.3 or lower 6.8 or higher
Colour indication
Red brown
Yellowish-brown Yellowish Lilac
Texture of milk No coagulation no lumps
No coagulation Coagulation No coagulation
B) Basic pH measurement from PH Meter
The most important measurement in various liquid chemical processes such as industrial, pharmaceutical, manufacturing, food production, etc. is the pH measurement: the measuring of hydrogen ion concentration in a liquid solution. It is stated that a solution with a low pH value is called an “acid,” while the one with a high pH is called a “caustic” or “base.” The common pH scale extends from 0 (strong acid) to 14 (strong caustic), pure water (neutral) has a pH value of 7, which is in the middle as shown below in figure 2.
Figure: 2. The pH scale.
pH is defined as follows: the lower-case letter “p” in pH stands for the common negative (base ten) logarithm, the upper-case letter “H” stands for the element hydrogen. Thus, pH is defined as a logarithmic measurement of number of moles of hydrogen ions (H+) in 1 liter of solution. Incidentally, the “p” prefix is also used with another type of chemical measurements where a logarithmic scale is preferred, pCO2 (Carbon Dioxide) and pO2 (Oxygen) being two such examples [2-5].
www.ijaera.org 2017, IJA-ERA - All Rights Reserved 691 here. The most important thing to understand here is that these two electrodes generate a voltage
directly proportional to the pH of the solution.
C) Acquiring Data from meter using LabVIEW:
The reading in the PH meter is got from the display screen directly and is to be used in the LabVIEW processing. To do either A USB cable connecting the pH meter with the PC has to be connected. But instead of opting for the connecting cable, we have used the vision and motion acquisition module of LabVIEW 2013 and acquired it from the LCD display of the meter.
The image in the “image out” of the block with be showing the captured image of the camera, while the Vision Assistant is used to train the digital 7 segment display of the number before the execution.
The processing of the captured image is done and finally the number is display in the numerical indicator of LabVIEW front panel. Thus, the value from an external pH device is got and other processing is enabled using the LabVIEW software.
III. SIMULATION
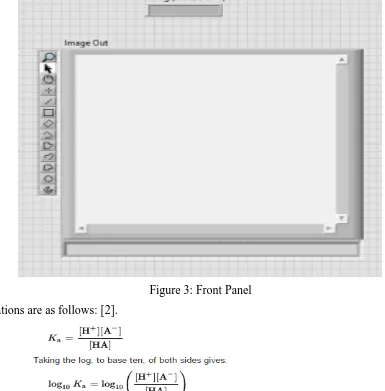
The block diagram in figure 3, is simulated to acquire data from the digital pH meter through image processing. By using vision acquisition technique, we can transfer the data in the LabVIEW environment. The output is displayed in the front display.
www.ijaera.org 2017, IJA-ERA - All Rights Reserved 692 Figure 3: Front Panel
The equations are as follows: [2].
Conflict of interest: The authors declare that they have no conflict of interest.
Ethical statement: The authors declare that they have followed ethical responsibilities.
REFERENCES
[1] Raman Chemical Imaging System for Food Safety and Quality Inspection. Published by the American Society of Agricultural and Biological Engineers, St. Joseph, Michigan
www.asabe.org.Citation: Transactions of the ASABE. 53(6):
www.ijaera.org 2017, IJA-ERA - All Rights Reserved 693 Institute, Kaunas University of Technology, Barsauskost.59, Kaunas LT-51368, Lithuania.