Active Learning Method for Interactive Image
Retrieval
Varsha Hole
1, Bhumi Dave
2, Sumitra Gauda
3, Priyanka Gawas
41Professor, Computer Engineering Department, Smt. Indira Gandhi College of Engineering,
Mumbai, Maharashtra, India
2,3,4Student, Computer Engineering Department, Smt. Indira Gandhi College of Engineering,Mumbai, Maharashtra, India
Abstract — With many possible multimedia applications, content-based image retrieval (CBIR) has recently gained more interest for image management and web search. CBIR is a technique that utilizes the visual content of an image, to search for similar images in large-scale image databases, according to a user’s concern. In image retrieval algorithms, retrieval is according to feature similarities with respect to the query, ignoring the similarities among images in database. To use the feature similarities information, this paper presents the k-means clustering algorithm to image retrieval system. This clustering algorithm optimizes the relevance results by firstly clustering the similar images in the database. In this paper, we are also implementing wavelet transform which demonstrates significant rough and precise filtering. We also apply the Euclidean distance metric and input a query image based on similarity features of which we can retrieve the output images. The results show that the proposed approach can greatly improve the efficiency and performances of image retrieval.
Keywords — CBIR, Clustering, Filtering, Similarity measures, K-means, Euclidean distance metric.
I. INTRODUCTION
1.1 IMAGE RETRIEVAL
In today’s world the expansion of internet and multimedia technologies has increased, a huge amount of multimedia data in the form of audio, video and images has been used in many fields like medical treatment, satellite data, digital forensics, surveillance system, etc. This has created a fragmentary demand of systems that can store and retrieve multimedia data in an effective way.
In recent years, rapid increase in the size of digital image database has been seen. Image Retrieval is concerned with the searching, finding and retrieving of digital image from a set of images or image database. To search an image from this large increasing database requires special concentration. Image Retrieval has been an active research area since 1970's. A proper structured database provides effective browsing and searching capability. Database management and computer vision are two research communities working on this area. These two
research areas provide two major techniques for searching an image.
1.2 TEXT BASED IMAGE RETRIEVAL
The most common retrieval systems are Text Based Image Retrieval (TBIR) systems, where the search is based on automatic or manual annotation of images. In Text Based Image Retrieval, text data represents the image features. Most existing image retrieval systems are text based. Depending upon the image objects, characteristics and features some keywords are indexed to the database to search an image.
A conventional TBIR searches the database for the similar text nearby the image as given in the query string. The commonly used TBIR system is Google Images. The text based systems are fast as the string matching is computationally less time consuming process. However, it is sometimes difficult to express the whole visual content of images in words and TBIR may end up in producing irrelevant results. In addition annotation of images is not always correct and consumes a lot of time. 1.3 CONTENT BASED IMAGE RETRIEVAL
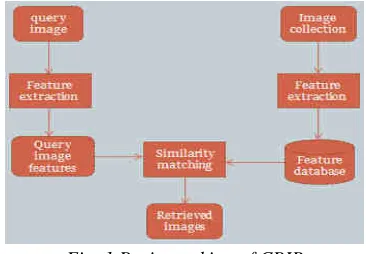
For finding an alternative way of searching and overcoming the limitations imposed by TBIR systems more spontaneous and user friendly content based image retrieval systems (CBIR) were developed. A CBIR system uses visual contents of the images described in the form of low level features like colour, texture, shape and spatial locations to represent the images in the databases. A typical CBIR system is as shown in fig. 1.
Fig. 1 Basic working of CBIR
International Journal of Advanced Engineering, Management and Science (IJAEMS) [Vol-2, Issue-4, April- 2016] Infogain Publication (Infogainpublication.com) ISSN : 2454-1311
www.ijaems.com Page | 140 Querying in this way eliminates the need of describing the
visual content of images in words and is close to human perception of visual data.
II. EXISTING SYSTEM
The search for significant information in the large space of image and video databases has become more challenging. The main challenge lies in the reduction of the semantic gap between low-level features extracted from the image and high-level user semantics. How to achieve accurate retrieval results are still a challenging and an unsolved research problem. A typical image retrieval system includes three major components: 1) feature extraction (usually in conjunction with feature selection), 2) high dimensional indexing and 3) system design. The main contribution of this work is a comprehensive comparison of colour feature extraction approaches and texture feature extraction approaches for CBIR.
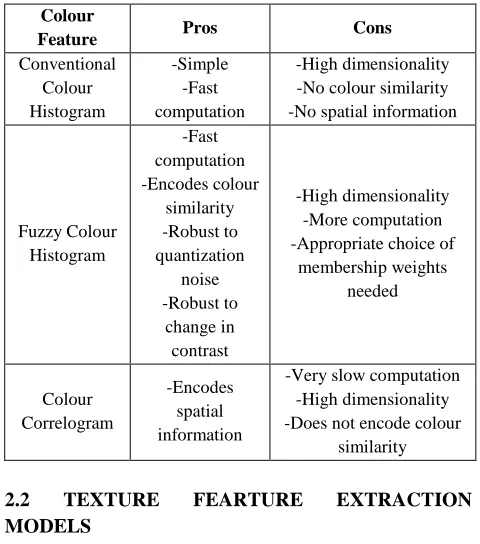
2.1 COLOUR FEATURE EXTRACTION MODELS The extraction of the colour features for each of the four methods is performed in the HSV (hue, saturation and value) perceptual colour space, where Euclidean distance corresponds to the human visual system’s notion of distance or similarity between colours.
2.1.1 THE CONVENTIONAL COLOUR
HISTOGRAM
The conventional colour histogram (CCH) of an image indicates the frequency of occurrence of every colour in the image. From a probabilistic perspective, it refers to the probability mass function of the image intensities. It captures the joint probabilities of the intensities of the colour channels. The CCH can be represented as hA,B,C(a,b,c) = N. Prob(A=a, B=b, C=c), where A, B and
C are the three colour channels and N is the number of pixels in the image [3] (key paper #1). Computationally, it is constructed by counting the number of pixels of each colour (in the quantized colour space)[1].
2.1.2 THE FUZZY COLOUR HISTOGRAM
The classic histogram is a global statistical feature, which describes the intensity distribution for a given image. Its main advantage is that it is fast to manipulate, store and compare and insensitive to rotation and scale. On the other hand, it is also quite unreliable as it is sensitive to even small changes in the scene of the image. In colour image processing, the histogram consists of three components, respect to the three components of the colour space.
A histogram is created by dividing a colour space into a number of bins and then by counting the number of pixels of the image that belongs to each bin. It is usually thought that in order for an image retrieval system to perform satisfyingly, the number of regions that the colour space
is divided into is quite large and thus the colours represented by neighbouring regions have relatively small differences. As a result, the perceptually similar colours problem appears, images which are similar to each other but have small differences in scene or contain noise will produce histograms with dissimilar adjacent bins and vice versa due to the small distance that the regions are separated from each other[2].
2.1.3 THE COLOUR CORRELOGRAM
The colour correlogram (CC) expresses how the spatial correlation of pairs of colours changes with distance. A CC for an image is defined as a table indexed by colour pairs, where the dth entry at location (i, j) is computed by counting number of pixels of colour j at a distance d from a pixel of colour i in the image, divided by the total number of pixels in the image [1][3].
Table 1: comparison of colour feature extraction models Colour
Feature Pros Cons
Conventional Colour Histogram
-Simple -Fast computation
-High dimensionality -No colour similarity -No spatial information
Fuzzy Colour Histogram
-Fast computation -Encodes colour
similarity -Robust to quantization
noise -Robust to
change in contrast
-High dimensionality -More computation -Appropriate choice of
membership weights needed
Colour Correlogram
-Encodes spatial information
-Very slow computation -High dimensionality -Does not encode colour
similarity
2.2 TEXTURE FEARTURE EXTRACTION
MODELS
The notion of texture generally refers to the presence of a spatial pattern that has some properties of homogeneity. Directional features are extracted to capture image texture information. The texture feature extraction methods presented in this section generate a multi‐scale, multi‐directional representation of an image.
2.2.1 CONTOURLET TRANSFORM
difference of the original image and the Gaussian low pass‐filtered version of the image, (at the appropriate scale σ). The Gaussian low pass kernel is defined as : H(w1,w2 ) = exp{-2( )2 (w12 + w22)}, where w1 and w2 are the horizontal and vertical frequencies respectively. The band pass images from the Laplacian pyramid are fed into the DFB so that directional information can be captured. The DFB realizes a division of the spectrum into 2L wedge‐shaped slices. A detailed description of the DFB is provided in. The low frequency components are separated from the directional components. After decimation, the decomposition is iterated using the same DFB [1].
2.2.2 THE COMPLEX DIRECTIONAL FILTER BANK The complex directional filter bank (CDFB) consists of a Laplacian pyramid and a pair of DFBs, designated as primal and dual filter banks. The filters of these filter banks are designed to have special phase functions, so that the overall filter is the Hilbert transformof the primal filter bank. A multi‐resolution representation is obtained by reiterating the decomposition in the low-pass branch [1][5].
Table 2: comparison of texture feature extraction models Texture Feature Pros Cons
Contourlet Transform
-Lower sub-bands decimated
-Number of orientations supported
needs to be power of 2
Complex Directional Filter
Bank
-Competitive retrieval results
-Computationally intensive
III. PROPOSED SYSTEM
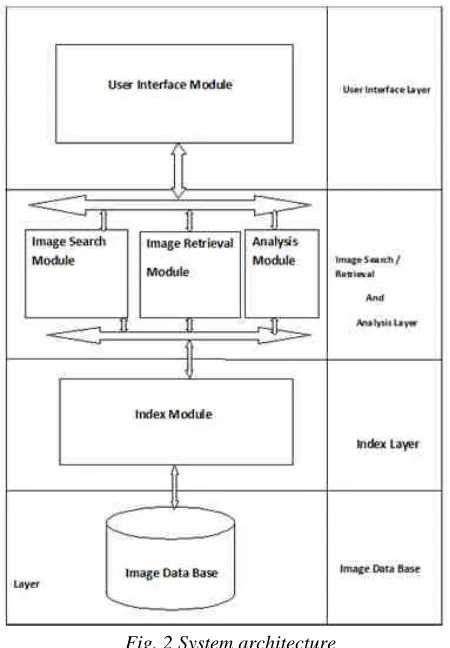
3.1 SYSTEM DESIGN AND IMPLEMENTATION STYLE
The System is divided into 5 Modules. A. Data Base Module
B. Index Module C. Image Search Module D. Image Retrieval Module E. Analysis Module F. User Interface Module
A. Data Base Module: This Module Maintains data base as collection of images.
B. Index Module: This Module used to create Index structure on data base of images.
C. Image Search Module: This Module used to search similar images based on Query Image.
D. Image Retrieval Module: This Module used to retrieve similar images based on Query Image.
E. Analysis Module: This Module compares the performance results on searching the image with index and without index.
F. User Interface Module: This Module develops user interfaces for various operations.
Fig. 2 System architecture 3.2 INDEXING
We have used a clustering algorithm, the K-means clustering algorithm to group the images into clusters based on the color content. This clustering algorithm has been frequently used in the pattern recognition literature. Here we are going to filter most of the images in the hierarchical clustering and then apply the clustered images to K-Means, so that we can get better favored image results.
3.2.1 K-MEANS ALGORITHM
The basic aim is to segment colours in an automated fashion using the L*a*b* colour space and K-means clustering. The entire process can be summarized in following steps:-
Step 1: Read the image Read the image from mother source which is in .JPEG format, which is a fused image of part of Bhopal city of Madhya Pradesh, India with DWT fusion algorithm of Cartosat-1 and LISS-IV of Indian satellite IRS-P6 and IRS-1D.
International Journal of Advanced Engineering, Management and Science (IJAEMS) [Vol-2, Issue-4, April- 2016] Infogain Publication (Infogainpublication.com) ISSN : 2454-1311
www.ijaems.com Page | 142 Step 3: Convert Image from RGB Colour Space to
L*a*b* Colour Space How many colours do we see in the image if we ignore variations in brightness? There are three colours: white, blue, and pink. We can easily visually distinguish these colours from one another.The L*a*b* colour space (also known as CIELAB or CIE L*a*b*) enables us to quantify these visual differences.The L*a*b* colour space is derived from the CIE XYZ tri-stimulus values. The L*a*b* space consists of a luminosity layer 'L*', chromaticity-layer 'a*' indicating where colour falls along the red-green axis, and chromaticity-layer 'b*' indicating where the colour falls along the blue-yellow axis. All of the colour information is in the 'a*' and 'b*' layers. We can measure the difference between two colours using the Euclidean distance metric. Convert the image to L*a*b* colour. Step 4: Classify the Colours in 'a*b*' Space Using K-Means Clustering is a way to separate groups of objects. K-means clustering treats each object as having a location in space. It finds partitions such that objects within each cluster are as close to each other as possible, and as far from objects in other clusters as possible. K-means clustering requires that you specify the number of clusters to be partitioned and a distance metric to quantify how close two objects are to each other. Since the colour information exists in the 'a*b*' space, your objects are pixels with 'a*' and 'b*' values. Use K-means to cluster the objects into three clusters using the Euclidean distance metric.
Step 5: Label Every Pixel in the Image Using the Results from K-MEANS For every object in our input, K-means returns an index corresponding to a cluster.Label every pixel in the image with its cluster index.
Step 6: Create Images that Segment the Image by Colour. Using pixel labels, we have to separate objects in image by colour, which will result in five images.
Step 7: Segment the Nuclei into a Separate Image Then programmatically determine the index of the cluster containing the blue objects because Kmeans will not return the same cluster index value every time. We can do this using the cluster centre value, which contains the mean 'a*' and 'b*' value for each cluster. [8]
3.3 SIMILARITY MATCHING
For finding the similarities in the images we use some distances. These are Euclidean distance, Manhattan distance, Canberra distance. By using these distances we find the similarity between images & retrieve most similar images with query image.
3.3.1 EUCLIDIAN DISTANCE ALGORITHM
In the domain of image retrieval from large databases using signatures like colour histogram, each ‘n’ dimensional feature vector may be considered as a point in the ‘n’ dimensional vector space. Thus, a feature vector
is mapped to a point in the n-dimensions. This mapping helps us to perceive the images (represented by their feature vectors) as high-dimensional points. The advantage of this representation is that one can now use different distance metrics for (i) finding similarity between two images and (ii) ordering a set of images based on their distances from a given image. This enables one to do a nearest neighbour search on a large database of images and retrieve a result set containing images that are closest matches to a user-specified query.
It is evident that the images and their ordering depend both on the feature extraction method as well as on the distance metric used. In this work, Manhattan distance and Euclidean distance metrics have been used as a similarity rule. After the colour, shape or texture information is extracted from an image, it normally encoded into a feature vector. Given two feature vectors, x1 and x2, a distance function computes the difference between them. It is hoped that this difference will accurately measure the dissimilarity between the images from which the features were extracted. The greater the distance, lesser is the similarity. Distance functions Euclidean (L2) norm and Manhattan distance or L1 norm (also known as city block metric) equations are as follows: The Euclidean distance is given by the following mathematical expression[4].
, = −
Where, 1, 2 are the coordinates where two pixels p1 and p2 are located.
The Manhattan distance is given by following mathematical:
, = −
Distance functions or metrics follows following properties:
, ≥ 0 , = 0 , = ,
, ≤ , + ,
3.4 FILTERING
the other hand, have better frequency resolution properties because of their longer filter lengths.
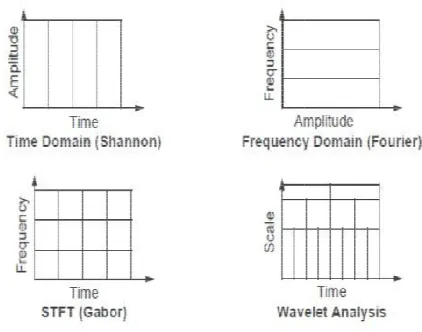
3.4.1 WAVELET TRANSFORM
The transforms are mainly based on small waves, called wavelets. It shows that both the frequency and temporal information uses wavelets. Human vision is much more sensitive to small variations in brightness or colour that is more sensitive to low frequency signals. To determine the low frequency area and high frequency area wavelet transform has been used.Wavelet analysis shown in fig.3 represents a windowing technique with variable regions. Wavelet analysis allows uses of long time intervals where we want more precise low frequency information, and shorter regions where we want high frequency information [7].
Fig. 3 Wavelet analysis
That other signal analysis technique like breakdown points,discontinuities in higher derivatives, trends, similarity also compress as well as de
without appreciable degradation were miss. Image Decomposition
HL - Horizontal details of the original image. LH -Vertical details of the original image.
HH - Diagonal details of the original image. (L=Low, H=High).
HL - Horizontal details of the original image. LH -Vertical details of the original image.
HH - Diagonal details of the original image. (L=Low, H=High)
Fig. 4 Image Decomposition
the other hand, have better frequency resolution properties because of their longer filter lengths.
The transforms are mainly based on small waves, called . It shows that both the frequency and temporal information uses wavelets. Human vision is much more sensitive to small variations in brightness or colour that is y signals. To determine the low frequency area and high frequency area wavelet transform has been used.Wavelet analysis shown in fig.3 represents a windowing technique with variable-sized regions. Wavelet analysis allows uses of long time e want more precise low frequency information, and shorter regions where we want high
like breakdown higher derivatives, trends, anself-also compress as well as de-noise a signal without appreciable degradation were miss.
Horizontal details of the original image.
ge. (L=Low,
Horizontal details of the original image.
Diagonal details of the original image. (L=Low,
ecomposition
In decomposition, firstly image is decomposed sub, One Level Decomposition. The LL sub
decomposed then called Two Level Decomposition shown in fig. 4.
IV. EXPERIMENTAL RESULTS
We have followed the image retrieval technique, as described in the section III. We perfo
mainly on two image sets, such as bus
The following figure explains Indexing creation process. The clustering is done using the K
clusters can be viewed as shown in fig. 5.
Fig. 5 image search using index
The following figure shows that if there are instances in the query image as shown in fig. 6 shows that accuracy in the retrieval of the images is preserved.
Fig. 6 Retrieval results for an objects
The rough and precise filtering can be depending upon the user’s interest
Retrieval results shows that the number of images in precise filtering decreases eventually.
on, firstly image is decomposed into four evel Decomposition. The LL sub-band further decomposed then called Two Level Decomposition
EXPERIMENTAL RESULTS
We have followed the image retrieval technique, as described in the section III. We performed experiments
image sets, such as buses and dinosaurs. The following figure explains Indexing creation process. The clustering is done using the K-means algorithm, clusters can be viewed as shown in fig. 5.
image search using index
The following figure shows that if there are different instances in the query image as shown in fig. 6, result accuracy in the retrieval of the images is
etrieval results for an image containing more objects
International Journal of Advanced Engineering, Management and Science (IJAEMS) [Vol-2, Issue-4, April- 2016] Infogain Publication (Infogainpublication.com) ISSN : 2454-1311
www.ijaems.com Page | 144 Fig. 7 Retrieval results showing precise filtering
V. CONCLUSION
Content based image retrieval (CBIR) is a lively discipline, expanding in both depth and breadth and an important research topic covering a large number of research domains like image processing, computer vision, very large databases and human computer interaction. One of the main tasks for (CBIR) systems is similarity comparison, extracting feature signatures of every image based on its pixel values and defining rules for comparing images.
Image retrieval algorithms always use the similarity between the query image and images in image database. However, they ignore the similarities between images in image database. In this paper we addressed this problem by introducing a graph-theoretic approach for image retrieval post processing step by finding image similarity clustering to reduce the images retrieving space. Experiment results show that the efficiency and effectiveness of k-means algorithm in analysing image clustering, which also can improve the efficiency of image retrieving and evidently promote retrieval precision. This k-means algorithm independent on the feature extraction algorithm is used as a post-processing step in retrieval.
REFERENCES
[1] Low-Level Colour and Texture Feature Extraction for Content-Based Image Retrieval, Final Project Report, May 09, 2008, EE 381K: Multi-Dimensional Digital Signal Processing, Michele Saad.
[2] CBIR USING COLOR HISTOGRAM
PROCESSING P.S.SUHASINI, 2Dr. K.SRI RAMA KRISHNA, 3Dr. I. V. MURALI KRISHNA, Engineering College, Vijayawada, A.P., India– 520007.
[3] J. Huang, S. R. Kumar, M. Mitra, W. J. Zhu and R. Zabih, “Image Indexing Using Colour
Correlograms”, Proc. IEEE Conf. on Computer Vision and Pattern Recognition, pp. 762 – 768, June 1997.
[4] Jasvinder Singh et al Int. Journal of Engineering Research and Applications, www.ijera.com, ISSN: 2248-9622, Vol. 4, Issue 9( Version 1), September 2014.
[5] S. Oraintara and T. T. Nguyen, “Using Phase and Magnitude Information of the Complex directional Filter Bank for Texture Image Retrieval”, Proc. IEEE Int. Conf. on Image Processing, vol. 4, pp. 61‐64,Oct. 2007.
[6] International Journal of Advanced Research in Computer and Communication Engineering, Vol. 2, Issue 5, May 2013 Copyright to IJARCCE www.ijarcce.com 2181, Content Bases Image Search And Retrieval Using Indexing By K-Means Clustering Technique.
[7] International Journal of Innovative Research in Science, Engineering and Technology, Volume 3, Special Issue 3, March 2014.2014 International Conference on Innovations in Engineering and Technology (ICIET’14).