Original Research Article
A study on burnout syndrome among school teachers in Tamil Nadu
S. Yoganand, I. K. Annie*, John William Felix
INTRODUCTION
Twenty first century has seen fast moving development in all spheres, with innovative technology. This has brought along a greater challenge for competency among workers in every profession in order to achieve a greater output. However, this has also added to the development of stress in the workers. Stress is shown in different forms like frustration, tension, anxiety. When these factors persist or increase, stress develops into a syndrome labelled as burnout.1 Burn out syndrome is measured through various components, particularly, emotional exhaustion, deper-sonalization, and reduced personal accomplishment.2
Burn out has turned to be a common health problem, even as to be included in the International Classification of Diseases-11 by the World Health Organization (WHO). Burn out which is a syndrome as per WHO has resulted from chronic work place stress which has not been addressed effectively on time. Burn out is characterized by three dimensions. (i) feelings of energy depletion or exhaustion, (ii) increased mental distance from one’s job, or feelings of negativism or cynicism related to one's job and (iii) reduced professional efficacy.3 According to world health organisation, the work place and working conditions should favour the workers in order to enjoy good health of mind and body.4
ABSTRACT
Background: Burnout syndrome is an emerging occupational phenomenon which makes employees to feel exhausted or less interested on their job with a diminished outcome. Teaching is considered one such stressful occupation. So, this study was conducted to assess the magnitude of burnout among school teachers of Tamil Nadu and to determine the various factors contributing to burnout syndrome.
Methods: Descriptive survey method was employed for the present study. A sample of 251 government school teachers was taken by using convenient sampling technique. Teachers’ burnout scale by Gupta and Rani was used to collect the data. The obtained data was statistically analysed using one-way ANOVA.
Results: The magnitude of burnout was not high in government school teachers. However, the factors like working in high school, urban school, having spouse as a teacher, chronic illness and increased travel time to school, were found to be associated with higher burn out.
Conclusions: Teachers have direct interaction with the students, shared responsibility with colleagues, adjusting with institutional conditions and handling various tasks and challenges put them at a high stress. Health system of India is having many health programmes in schools which are related student’s health but the teacher’s health is left behind. Screening teachers for stress, burnout and other occupational psychosocial hazard will help them improving their life and student’s education.
Keywords: Burnout syndrome, Occupational health, Teachers’ burnout scale
Department of Community Medicine, Rajah Muthiah Medical College and Hospital, Annamalai University, Chidambaram, Tamil Nadu, India
Received: 03 September 2019
Revised: 20 September 2019
Accepted: 21 September 2019
*Correspondence:
Dr. I. K. Annie,
E-mail: [email protected]
Copyright: © the author(s), publisher and licensee Medip Academy. This is an open-access article distributed under the terms of the Creative Commons Attribution Non-Commercial License, which permits unrestricted non-commercial use, distribution, and reproduction in any medium, provided the original work is properly cited.
Teaching is considered as one of the noble professions in the world, at the same time it is a stressful job.5 A teacher has an important place in the life of a student from their very early age. In addition to teaching, they are also a face in the society in their varying capacities, either voluntary or by force, particularly in developing countries like India. In a comparative study of varying professions, teaching is found to be second most stressful occupation after ambulance car drivers.6
The level of burnout varied among teachers across the world, as in Taiwan, 26% of primary school teachers had burnout, while in the school teachers of Sri Lanka, found less prevalence (11.56%) of burnout.7,8 A study among university teachers in south India found that 74% of them experiencing occupational stress and 86% of teachers have professional burnout.9 There is no fixed period of time, where a teacher goes into developing burn out. A follow-up study in a Sweden school teachers has found the baseline prevalence of burnout (14%) and after 30 months the prevalence of burn out (15%), indicating at any period of time some teachers are having tendency to develop burnout.10
Evidence has shown various reasons for burnout among the teachers, as the changing education policies,8 the type of school, locality, gender, age group, experience, subject taught and training variation as the factors associated with burnout.11-13
Teacher burnout can have direct effect on students, with poor teaching quality leading to poor quality of education. So, this study was conducted to assess the magnitude of burnout among school teachers of Tamilnadu and to determine the various factors contributing to burnout Syndrome. The most common variables considered in the previous studies are sex, teaching classes, marital status, teaching experiences, education, and satisfaction with income, professional and religious backgrounds. In this study certain other variables like size of the family, locality of school and mode of transport to school were also examined.
METHODS
After having received clearance from the institutional ethical committee, this cross-sectional study was conducted in the government schools across rural and urban areas of Chidambaram educational block in Cuddalore district, Tamil Nadu. All the teachers in these government schools who gave informed consent for the study and met the inclusion and exclusion criteria were selected for this study. Study was conducted for a period of 12 months from June 2018 to May 2019. Inclusion criteria were in service teachers of both sexes, who were able to read, write and comprehend English. Exclusion criteria were teachers who were diagnosed with major physical illness, organic brain disease or history of any major psychiatric disorders.
Taking 11.56% prevalence of previous study from Sri Lanka, keeping absolute precision as 4% and level of confidence as 95%,the required sample size for our study was 246.8 Interview questionnaire were given to 300 teachers of varying schools and 251 completed answers were received.
Instruments used in the study are teachers burnout scale (TBS) and self-developed personal data sheet for factual information related to demographic aspects. TBS is developed by Gupta et al with significantly high validity and reliability.14 In this scale four dimensions of burnout are calculated namely, i) perceived self-efficacy, that is the ability of the teachers to manage various tasks, obligations, and challenges with professional responsibility, ii) student’s disruptive behaviour like interrupting classes, misbehaviour in the class which can cause distress for the teachers, iii) collegiality which is a working environment, where responsibility and authority is being shared equally by colleagues and iv) institutional climate, which is a psychological state, affected by institutional conditions. The scale is a self-administering and self-reporting five-point rating scale, containing 40 questions, score for each question ranging from 0 to 4. The total score ranged from 0 to 160, with higher the score, higher the level of burnout and vice versa.
The teachers were requested to fill out their personal details in the demography data sheet and give responses to all the 40 items in the Teacher’s burnout scale as accurately and honestly. Once all the data was collected, it was tabulated in Microsoft excel for ease in analysis and analysed using SPSS Version 21.3. Scores obtained from the TBS were considered as a continuous variable ranging from extremely low, low, below average, average, above average, high level and extremely high level of burnout. Mean burnout score and difference in mean burnout score were calculated for different variable and significance of the results was done using one-way ANOVA and T-test.
RESULTS
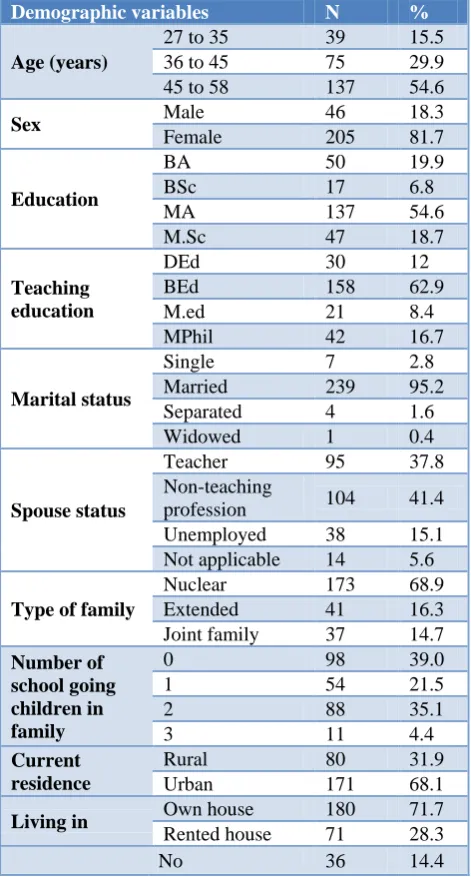
In our study out of 251 teachers, 137 (54.6 %) were in the age group of 45 to 58 and 39 (15.5%) were in age group 27 to 35 (Table 1).
A greater proportion of the respondents were female teachers (81.1%). Education status of the participants were classified in to two category, general education and teaching education. In general education most of the participants were qualified up to master degree 137 (54.6%), and in teaching education up to B.Ed. (Bachelor of Education) 158 (62.9%). Most of the teachers were married 239 (95.2%) and many of their spouses were teachers 95 (37.8%). Majority (68.9%) of participants were living in a nuclear family.
participants 171 (68.1%) had their residence in the urban areas, while 180 (71.7%) lived in their owned houses.
Table 1: Socio-demographic details of study participants (n=251).
Demographic variables N %
Age (years)
27 to 35 39 15.5 36 to 45 75 29.9 45 to 58 137 54.6
Sex Male 46 18.3
Female 205 81.7
Education
BA 50 19.9
BSc 17 6.8
MA 137 54.6
M.Sc 47 18.7
Teaching education
DEd 30 12
BEd 158 62.9
M.ed 21 8.4
MPhil 42 16.7
Marital status
Single 7 2.8
Married 239 95.2 Separated 4 1.6
Widowed 1 0.4
Spouse status
Teacher 95 37.8 Non-teaching
profession 104 41.4 Unemployed 38 15.1 Not applicable 14 5.6
Type of family
Nuclear 173 68.9 Extended 41 16.3 Joint family 37 14.7
Number of school going children in family
0 98 39.0
1 54 21.5
2 88 35.1
3 11 4.4
Current residence
Rural 80 31.9
Urban 171 68.1
Living in Own house 180 71.7
Rented house 71 28.3
No 36 14.4
Table 2 shows the personal details of the participants, where 3.6% of them had the habit of alcohol consumption and 2.8% of participants were having habit of smoking either occasionally or regularly. Among the participants, 7.6% of them were on medications for chronic disease, hypertension and 10% of them were on medication for diabetes mellitus. Participants taking medicine for other chronic diseases like bronchial asthma and arthritis were 6.4%.
Participants (44.2%) of them were doing routine physical activity in the form of walking, while 7.2% of the participants were doing regular exercise and 10.4% doing yoga or meditation. Among the 251 respondents, 89.6%
were having religious belief and 85.7% were satisfied with their salary.
Table 2: Distribution of participants according to their personal history(n=251).
Personal history N %
Consumption of alcohol
Yes 9 3.6
No 242 96.4
Habit of smoking
Yes 7 2.8
No 244 97.2
Chronic illness
Nil 191 76.1
Hypertension 19 7.6 Diabetes 25 10.0
Other 16 6.4
Daily physical activity
No 96 38.2
Walking 111 44.2 Exercise 18 7.2 Yoga/meditation 26 10.4
Religious belief
Yes 225 89.6
No 26 10.4
Are you satisfied with salary?
Yes 215 85.7
Workstation details
Most of the participants were working in a school located in rural area of Chidambaram (57%). Two-wheeler and public bus transport were the common mode of transportation to school, 132 (52.6%) and 67 (26.7%) respectively.
A good number of participants could reach their school within 15 minutes from their home 101 (40.2%), while 92 (36.7%) participants had to travel 15 to 30 minutes to reach school, and 36 (14.3%) could reach their work place in 30 to 60 minutes and a few, 22(8.8%) had to take more than 60 minutes to reach school daily as in Table 3. More than half, 55.8% of the teachers were working in Co-education school and 51.4% (129) of the teachers were working in the school where classes were taken in both Tamil and English medium.
One third of the teachers in the study, 83 (33%) were the sole teachers for their class, taking all subjects. Among the participants, 29 of them were teaching Tamil while 30 participants were English teachers, 31 participants taught maths, 24 participants were social science teachers, 48 participants were science teachers including physics, chemistry, biology and zoology and 6 participants were taking other classes like drawing, craft and physical education.
years of teaching experience while 53 of them had less than 10 years of experience.
Table 3: Distribution of participants according to nature of their occupation (n=251).
Nature of their occupation %
School location Rural 143 57.0
Urban 108 43.0
Mode of transport to school
Walking 21 8.4 Two-wheeler 132 52.6
Auto 27 10.8
Bus 67 26.7
Car 4 1.6
Time taken to reach school
<15 min 101 40.2 16 to 30 min 92 36.7 31 to 60 min 36 14.3 >60 min 22 8.8
Type of school
Boys 26 10.4
Girls 85 33.9 Co-ed 140 55.8
Medium of school
Tamil 110 43.8 English 12 4.8 Both 129 51.4
Grade of teaching
Primary 67 26.7 Secondary 57 22.7
High 67 26.7
Higher
secondary 60 23.9
Teaching subject
All subject 83 33.0 Tamil 29 11.6 English 30 12.0 Maths 31 12.3 Social 24 9.6 Science 48 19.1 Others 6 2.4
Years of experience in teaching
<10 53 21.1 11 to 20 122 48.6 21 to 30 64 25.5 30 to 33 12 4.8 Level of burnout
All the responses given by teachers were given score as per TBS and classified in to seven classes of burnout (Table 4). Out of 251 teachers assessed 95 had extreme low level of burnout, 122 of them had low level of burnout, 28 had below average level of burnout, while, 5 had average and 1 had above average level of burnout. There were no teachers in the high or extreme high level of burnout in this study.
To find the association between demographic variables of teachers to their burnout level one-way ANOVA is done, (Table 5). Age, sex, education, marital status, number of school going children and current residence were not
having any significant association with the burn out. This study has shown mean burnout score increase with increase in family number and from nuclear to joint family. However, both of these factors had no statistical significance. The mean burnout score for teachers with their spouses also being a teacher (36.78) was found to be higher than teachers with a non-teacher partner, and was having statistical significance at 0.031 with an F value of 3.004.
Table 4: Distribution of teachers according to their level of burnout by TBS.
Burnout level Burnout
score N %
Extreme low level of
burnout <27 95 37.8
Low level of burnout 28 to 48 122 48.6
Below average level of
burnout 49 to 69 28 11.2
Average level of
burnout 70 to 98 5 2.0
Above average level of
burnout 99 to 119 1 0.4
High level of burnout 120 to 140 0 0.0
Extreme level of
burnout >141 0 0.0
Total 251 100
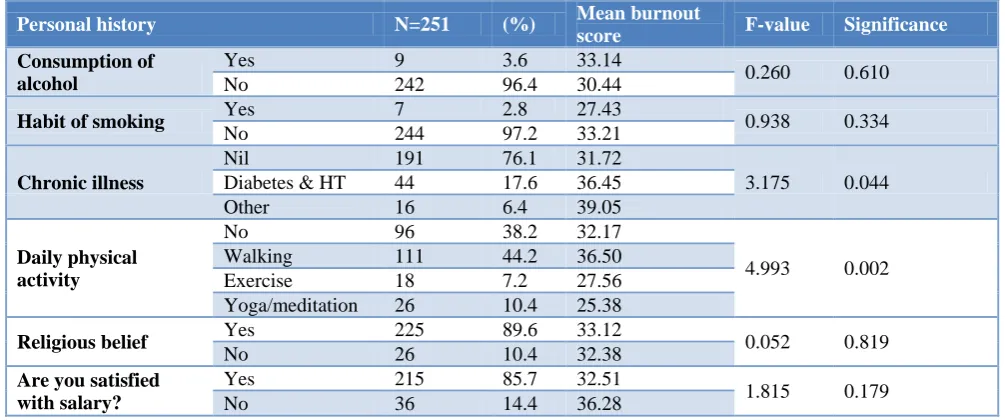
As in Table 6, participants with habit of alcohol consumption and non-smokers had a higher mean burn out score than their counterparts. Person with other chronic diseases like epilepsy, bronchial asthma and arthritis also showed higher mean burnout score (others) than person with hypertension, diabetes and no chronic disease.
Person who did regular exercise, yoga and meditation showed low level of burnout compared to person with no physical activity and routine walking with very high statistical significance (F-value of 4.993 and 0.002 significance).Having religious belief and satisfaction in salary not showed any association with burnout.
Table 5: Association between demographic variables and mean burnout score (n=251).
Demographic variables N (%) Mean burnout
score F-value Significance
Age (years)
27 to 35 39 15.5 36.28
1.670 0.190 36 to 45 75 29.9 30.79
45 to 58 137 54.6 33.36
Sex Male 46 18.3 32.39 0.100 0.752
Female 205 81.7 33.20
Education
Ba 50 19.9 31.24
1.192 0.313
B.sc 17 6.8 36.59
Ma 137 54.6 32.26
M.sc 47 18.7 35.98
Teaching education
D.ed 30 12 28.80
1.298 0.276
B.ed 158 62.9 33.08
M.ed 21 8.4 32.71
M.Phil 42 16.7 36.12
Marital status
Single 7 2.8 25.86
0.727 0.537 Married 239 95.2 33.37
Separated 4 1.6 27.25
Widowed 1 0.4 30.00
Spouse status
Teacher 95 37.8 36.78
3.004 0.031 Non-teaching
profession 104 41.4 30.89 Unemployed 38 15.1 30.53 Not applicable 14 5.6 30.57
Type of family
Nuclear 173 68.9 32.00
1.344 0.263 Extended 41 16.3 34.71
Joint family 37 14.7 36.11
Number of school going children in family
0 98 39.0 33.66
0.655 0.581
1 54 21.5 34.37
2 88 35.1 32.18
3 11 4.4 28.00
Current residence Rural 80 31.9 32.21 0.337 0.562
Urban 171 68.1 33.44
Living in Own house 180 71.7 34.09 2.867 0.092
Rented house 71 28.3 30.41
Table 6: Association between personal history and mean burnout score (n=251).
Personal history N=251 (%) Mean burnout
score F-value Significance
Consumption of alcohol
Yes 9 3.6 33.14
0.260 0.610
No 242 96.4 30.44
Habit of smoking Yes 7 2.8 27.43 0.938 0.334
No 244 97.2 33.21
Chronic illness
Nil 191 76.1 31.72
3.175 0.044 Diabetes & HT 44 17.6 36.45
Other 16 6.4 39.05
Daily physical activity
No 96 38.2 32.17
4.993 0.002 Walking 111 44.2 36.50
Exercise 18 7.2 27.56
Yoga/meditation 26 10.4 25.38
Religious belief Yes 225 89.6 33.12 0.052 0.819
No 26 10.4 32.38
Are you satisfied with salary?
Yes 215 85.7 32.51
1.815 0.179
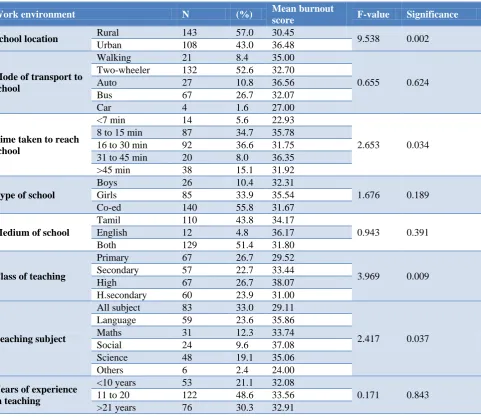
Table 7: Association between work environment and mean burnout score (n=251).
Work environment N (%) Mean burnout
score F-value Significance
School location Rural 143 57.0 30.45 9.538 0.002
Urban 108 43.0 36.48
Mode of transport to school
Walking 21 8.4 35.00
0.655 0.624 Two-wheeler 132 52.6 32.70
Auto 27 10.8 36.56
Bus 67 26.7 32.07
Car 4 1.6 27.00
Time taken to reach school
<7 min 14 5.6 22.93
2.653 0.034 8 to 15 min 87 34.7 35.78
16 to 30 min 92 36.6 31.75 31 to 45 min 20 8.0 36.35 >45 min 38 15.1 31.92
Type of school
Boys 26 10.4 32.31
1.676 0.189
Girls 85 33.9 35.54
Co-ed 140 55.8 31.67
Medium of school
Tamil 110 43.8 34.17
0.943 0.391
English 12 4.8 36.17
Both 129 51.4 31.80
Class of teaching
Primary 67 26.7 29.52
3.969 0.009 Secondary 57 22.7 33.44
High 67 26.7 38.07
H.secondary 60 23.9 31.00
Teaching subject
All subject 83 33.0 29.11
2.417 0.037 Language 59 23.6 35.86
Maths 31 12.3 33.74
Social 24 9.6 37.08
Science 48 19.1 35.06
Others 6 2.4 24.00
Years of experience in teaching
<10 years 53 21.1 32.08
0.171 0.843 11 to 20 122 48.6 33.56
>21 years 76 30.3 32.91 When teachers were classified according to their
class/grade of teaching like primary, secondary, high and higher secondary, the mean burnout score was increasing with increase in grade of school with F-value of 3.969 and significance at a level of 0.009. It clearly shows that primary school teachers are having low level of burnout when compared to middle, high and higher secondary teachers.
Teachers taking social science subject were having significantly higher mean burnout score (37.08, p=0.037) and teachers who took less than 7 minutes to reach school had low burnout, which was statistically significant at 0.034.
DISCUSSION
This cross-sectional study was conducted to measure the level of burnout experienced by teachers working in government schools and to identify the association between selected demographic characters and burnout.
Maslach burnout inventory is the tool used in most of the burnout study worldwide while in this study we used teachers burout scale by Gupta et al with different burnout components, like perceived self efficacy, student’s disruptive behaviour, collegiality and institutional climate.14 Using this scale burnout were classified in to different levels, and 48% of participants found to be with low level of burnout, 11.2% exhibit below average level of burnout and 2.4% with average and 0.4% have above average level of burnout. This is consistent with the findings in a previous Indian study done by Shukla et al.15
Mean burnout score was slightly higher in female teachers than male teachers in our study, as seen in many other studies.17-19 Teachers whose spouses being teachers were found to be at greater stress and burn out, with the mean burnout score (36.78) higher than those with a non-teacher partner with statistical significance at 0.031 and F value of 3.004. Mean burnout score of persons without any chronic illness (31.72%) was low when compared with person with either diabetes or hypertension or both and with other chronic disease. The chronic morbidity condition increased the burn out among teachers.
In this study as shown teachers working in urban schools having higher mean burnout score (36.48) than teachers working in rural schools (30.45) which is similar to the results found in study by Dawn et al, in West Bengal, India.19
Teachers used various mode of transport to reach their schools on right time, while most of them using motor cycle. However, teachers using auto rickshaw as mode of transport daily were found to be having more burnout (36.56) compared to the other mode of transport, although it was not statistically significant. Teachers whose residences were very near to the school and took very short time to reach school that is less than 7 min were having very low mean burnout score when compared to others which was statistically significant f= 2.653 and p=0.034. This was similar to the results found by De Silva et al, where teachers living in less than 10 km from school having low burnout.8
The level of burn out increased with the teacher working with higher grade classes. Primary grade teachers were having significantly very low burnout level (F-value of 3.969 and p=0.009) than high school teachers. Similar results were found in a study done by Mendenz et al.20 In this study we found that teacher’s taking social science subject were having higher mean burnout score (37.08) which is statistically significant at 0.037. This may be due to fact that all social science teachers were teaching in the high school as the subject is not included in the higher secondary curriculum. Low level of burnout in teachers taking all subjects may be due to most of them are primary grade teachers and their interaction is with minimum number of students at their early stage of education.
CONCLUSION
Teaching is a stressful occupation where teachers have direct interaction with the students, and facing many stressful situations regularly. Teachers have their professional responsibility in managing various tasks, obligations, and challenges. The behaviour of students in the class room, the shared responsibilities by the colleagues and institutional heads, the work environment, and the growing demand from the parents or the society leading to a development of burnout phenomenon among
teachers. Working in an urban school, having spouse as a teacher, having a chronic illness or requiring a longer time daily for travel to reach their school were found to be factors increasing the burnout among teachers. Recommendations
Teachers play a major role in the education of our children. As a developing nation our country, India, is facing frequent changes in the curriculum and taking a high demand from teachers, leading them to experience burnout on their job. At present, health system of India is having many health programmes in schools which are related student’s health but the teacher’s health is left behind. Screening teachers for stress, burnout and other occupational psychosocial hazard will help them improving their life and student’s education.
Limitation of the study
The sample consists only of teachers who work in government schools. This study was a one-time cross-sectional study; presence of any immediate stressor may just alter the study result.
Funding: No funding sources Conflict of interest: None declared
Ethical approval: The study was approved by the Institutional Ethics Committee
REFERENCES
1. Freudenberger HJ. Staff Burn-Out. J Soc Issues. 1974;30(1):159-65.
2. Maslach C, Jackson S, Leiter M. The Maslach Burnout Inventory Manual. In: Evaluating Stress: A Book of Resources. 1997: 191-218.
3. WHO. WHO BURNOUT. 2019. Available at: https://www.who.int/mental_health/evidence/burn-out/en/. Accessed on 10 May 2018.
4. World Health Organization (WHO). Workers’ health: global plan of action. Sixtieth World Heal
Assem. Available at:
https://www.who.int/occupational_health/WHO_hea lth_assembly_en_web.pdf?ua=1%0Ahttp://scholar.g oogle.com/scholar?hl=en&btnG=Search&q=intitle: Workers+?+health:+global+plan+of+action#0. Accessed on 10 May 2007.
5. McCarthy CJ. The Relation of Elementary Teachers’ Experience, Stress, and Coping Resources to Burnout Symptoms. Elem Sch J. 2009;109(3):282-300.
6. Johnson S, Cooper C, Cartwright S, Donald I, Taylor P, Millet C. The experience of work-related stress across occupations. J Manag Psychol. 2005;20(2):178-87.
7. Kyriacou C, Chien PY. Teacher stress in Taiwanese primary schools. J Educ Enq. 2004;5(2):86-104. 8. De Silva P. Prevalence of Burnout and Its Correlates
Southern Province of Sri Lanka. Eur J Prev Med. 2015;3(2):9.
9. Reddy GL, Poornima R. Occupational Stress and Professional Burnout of University Teachers in South India. Int J Educ Plan Adm. 2012;2(2):2249-3093.
10. Arvidsson I, Leo U, Larsson A, Håkansson C, Persson R, Björk J. Burnout among school teachers: quantitative and qualitative results from a follow-up study in southern Sweden. BMC Public Health. 2019;19(1):655.
11. Madhu Gupta P, Rani S. Burnout among Secondary School Teachers: An Analysis On The Basis Of Type of School, Locality and Gender. Imp J Interdiscip Res. 2017;3(2):2454-1362.
12. Khatun R. Burnout of Secondary School Teachers in Relation to Some Personal Variables. Asian Reson. 2013;2(4):1-5.
13. Lou Y, Chen L. A Study of the English Teachers’ Burnout in a Local Comprehensive University in China. Creat Educ. 2016;07(04):646-54.
14. Gupta PM, Rani S. Construction and Standardization of Teachers ’ Burnout Scale (Tbs): A Psycho-Educational Perspective. 2018;05(04). 15. Shukla A, Trivedi T. Burnout in Indian teachers.
Asia Pacific Educ Rev. 2008;9(3):320-34.
16. Qadimi A, Praveena KB. Influence of Age on Job Burnout and Occupational Stress among High School Teachers. Indian J Res. 2013;(1996):80-3. 17. Dagar N, Mathur M. Burn out Among School
Teachers of Haryana. International J Educational Planning Administration. 2016;6(1):45-8.
18. Zhang L, Zhao J, Xiao H, Zheng H, Xiao Y, Chen M, et al. Mental health and burnout in primary and secondary school teachers in the remote mountain areas of Guangdong Province in the People’s Republic of China. Neuropsychiatr Dis Treat. 2014;10:123-30.
19. Dawn S, Talukdar P, Bhattacharjee S, Singh OP. A Study on Job related Stress among School Teachers in Different Schools of West Bengal, India. East J Psychiatry. 2016;19(1):12-7.
20. Saltijeral Méndez MT, Ramos Lira L. Identificación de estresores laborales y burnout en docentes de una secundaria para trabajadores del Distrito Federal. Salud Ment. 2015;38(5):361-9.