Regression and Transgression Analysis on the
Private Output Contribution to the Gross Domestic
Product at Bengkulu Province, Indonesia
YOSEPH WIKATAMA KURNIAWAN
Doctorate Candidate from Faculty of Economics and Business at Postgraduate Program, University of Udayana, Denpasar, Indonesia
KEMBAR SRI BUDHI
Professor, Faculty of Economics at Postgraduate Program, University of Udayana, Denpasar, Indonesia
Abstract :
Bengkulu is a province in Indonesia that contributes national Gross Domestic Product (GDP) ranking number 27 from 34 provinces. Its agriculture and mining sectors are the main sources for the contribution. By studying the economical regression analysis for the past 34 years, and also its transgression analysis (feasibility study) for the next 30 years, it indicates an influence of private output to variables of private investment for the infrastructure development and national state expenditure. The biggest contribution for supporting private output comes from the state expenditure for infrastructure development of regression analysis and state expenditure for infrastructure development and workers. Its independent variables are private investment and state expenditure for education and health, which have less influence in transgression analysis.
Keywords: Regression and Transgression, Private Output, Bengkulu Province, Indonesia
1. INTRODUCTION
Bengkulu province is situated on the west coast side of Sumatera island. This province has a total area of ± 22.365,6 Km² that has a population of 1,799,668 residents (See Figure 1). Based on the rank of GDP value, Bengkulu is ranked in 27th of 34 provinces which the main contributions come from agriculture and mining sector.
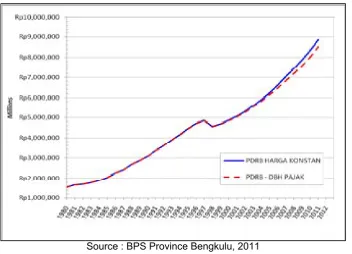
Bengkulu was initially stated by Indonesian government in 1968 and is 25th province of total 34 provinces in Indonesia (ranked by the date of establishment). Its GDP growth (Private Output) from 1980 until 2011 (BPS, 2011) is shown in Figure 2 below.
Source : BPS Province Bengkulu, 2011
Figure 2. Growth of Gross Domestic Regional Product (GDRP) ith & without Tax from 1980 to 2011
Since this province was initially established, the natural resources such as coal, gas, minerals, and any local products were not optimally exploited to be as import commodities due to lack of infrastructure development, particularly main roads and ports..
Private Investments (capital=K), Labors (L), State Expenditure for Construction (PK 1), State Expenditure for Education (PK 2), Income Tax from Private or Private Output (Y), are the main components that contribute the increasing amounts of Bengkulu’s GDP (Z) (Kurniawan 2012). Taken from the feasibility study of a mega project in this province on 2010, it is projected that the private output will contribute 10,25% of total GDP in 2033 (see Figure 3) which this condition shows a noticable significant progress. Private companies investments are expected to stimulate the growth of GDP from tax income (Private Output). This paper is created to compare the contribution of Private Output from 2010 to 2011 (using a Regression Analysis Technique) with a predicted income based on the feasibility study of a mining transportation Mega-Project (Kurniawan, 2010), which this technique is called Transgression Analysis Technique. The outputs of both components could elicit a valid informations that show the importance of optimizing the tax income coming from this project investment which technically and economically is feasible.
Based on result of this Feasibility Study, it shows that Private Output together with the State Expenditure for Construction (PK 1) are the two top contribution for Bengkulu’s GDP (Z).
Regression and Transgression anaysis are the methods being used in order to observe the functions of those variables to increase GDP. Regression is defined as statistical method that describe dependent variables from one or more independent variables. (Gujarati, 2009, Carter et al, 2012). Transgression is defined by writer as statistical method that describe dependent variables from one or more independent variables based on projected data analysis from the feasibility study.
Comparable assumptions that used in the analysis are Private Investmens (K), Labors (L), State Expenditure for Infrastructure (PK 1), State Expenditure for Education and Health (PK 2) as independent variables, Private Output (Z) as an Intervening and GDP (Z) as dependent variable.
This study is limited up to regression analysis of the Private Output against GDP of Bengkulu from 1980 until 2011 with is compared the Private Output from the feasibility study of transportation project from 2010 until 2040 by transgression analysis.
2. METHODOLOGY
The concept of this study is illustrated as follows. THEORY
Economic Growth Theory : Adelman et al (1961), Aqhion et al (2005), Barro et al (2004), Bishop et al (2011),
Export Base Theory : Innis (1929), Cramon and Rovayo (2006)
Economic and Regional Developments Sen (1999) ; Stimson, Stough and Roberto (2006), Anderson (2011), Stimson, Stough and Robert (2006)
Cost Benefit Analysis (CBA/COBA), Riley and College (2006), Salengke (2012).
Statisticall Analysis: Gujarati (2009), Carter et al (2012).
The models of economic growth theory were introduced by Harrod – Domar Model (1940), Kaldor Model (1961 vide, D’Agata and Freni 2003), Solow Model (1956), Schumpeter Model (1934, vide Arsyad 2010), Rostow Model (1990, Romer (1990) and Bishop et al Model (2011). These models embrace the economic growth from the factors of capital, technology innovation, and investment ouput that have roles to increase GDP.
The export base theory was introduced by Harold Innis (England), beginning of year 1920, and developed by North (1955), Dusenberry (1950), Andrews (1953) and deeply stressed by Cramon and Rovayo (2006). This theory refers to the Neoclassical approach to regional growth based on resource areas in North America with the economic growth of the industry by exporting goods and services from region to region because of there sources of an Area (Cramon and Rovayo, 2006).
EMPIRICAL DATA
Bengkulu Statistic Data : BPS Provinsi Bengkulu (2011, 2012, 2013), BPS (2013) Project Feasibility Study :
Kurniawan (2010)
Doctorate Dissertation : Kurniawan (2012)
The GDP in Indonesia : BPS (2013)
Conclusion
Econometric Analysis Of Regression
and Transgression
Economic and regional developments theory was determined well by Amarta Sen (1999), Stimson, Stough and Robert (2006); Stimson, Robson, Stough and Salazar (2009).
Cost Benefit Analysis (CBA / COBA) is a technique for assessing the monetary social costs and benefits of a capital investment project over a given time period. The investment criteria methods of project and its application might be determined by five models; 1. Net Present Value / Worth (NPV), 2. Benefit Cost Ratio, 3. Profitability Indexs, 4. Payback Periods, 5. Internal Rate of Return / IRR (Riley and College, 2006, Salengke 2012).
Regression and Transgression analysis with path analysis are applied with EVIEWS programme from secondary data gained from BPS 2012 which is a time series from 1980 until 2011 by using Regression analysis (Attachment 1). Empirical Data are the time series of feasibility study result from 2010 until 2040 for the Transgression Analysis (Attachment 2). Consistency and Cointegration test are conducted before both time series data are analyzed within 30 years range by the Regression and Transgression analysis method.
Equation model and the connections of each regression and transgression variables use some formulas as described below:
LnYt = α0+α1LnKt-1 +α2 LnLt-1+ α3 LnPK1t-1+α4 LnPK2t-1 + e1t... (1a) LnZt = α0+α1LnKt-1 +α2 LnLt-1+ α3 LnPK1t-1+α4 LnPK2t-1 + e2t...…... (1b) LnZt = α0+α1LnYt-1 +α2LnKt-1 +α3 LnLt-1+ α4 LnPK1t-1+α5 LnPK2t-1+ e2t.. (1c) Which : LnYt = Private Output in year t,
LnZt = LnGRDPt = Gross Regional Domestic Product in year t,
α0 = Constant,
α1, α2,α3, α4 , α5 = Estimated Parameter, Kt = Private Investment in year t, L t-1 = Labors in year t-1,
PK1t-1 = State Expenditure for Infrastructure Development in year t-1, PK2t-1 = State Expenditure for Education and Health in year t-1, et = Error Variables in year t
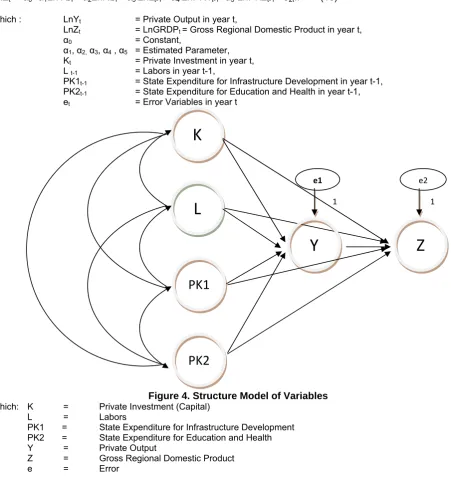
Figure 4. Structure Model of Variables Which: K = Private Investment (Capital)
L = Labors
PK1 = State Expenditure for Infrastructure Development PK2 = State Expenditure for Education and Health
Y = Private Output
Z = Gross Regional Domestic Product
e = Error
e1
1
e2
1
PK1
L
K
PK2
Y
3. ECONOMETRICAL REGRESSION AND TRANSGRESSION ANALYSIS RESULT
The Regressive data result of BPS for Bengkulu province from 1980 to 2011 are shown in table 1. Figure 5 shows the variables connections with path coefficient. Table 2 shows the direct and indirect influence of each variables.
Table 1-Regression Analysis: Coefficient or Direct Influence of each Variables of BPS Data Research
Variable Coef St Error Coef Beta t Prob
LNK(-1) LNY 0.560 0.078 0.156 7.147 0.000
LNL(-1) LNY 3.276 0.396 0.338 8.265 0.000
LNPK1(-1) LNY 0.458 0.138 0.306 3.312 0.003
LNPK2(-1) LNY 0.276 0.113 0.215 2.455 0.021
LNK(-1) LNZ 0.137 0.017 0.151 7.862 0.000
LNL(-1) LNZ 0.587 0.098 0.239 6.015 0.000
LNPK1(-1) LNZ 0.045 0.021 0.119 2.111 0.045
LNPK2(-1) LNZ 0.041 0.016 0.126 2.524 0.018
LNY LNZ 0.095 0.025 0.377 3.757 0.001
Table 2- Regression Analysis: Direct, Indirect, and Total Influences of Each Variables of BPS Data Research Independent Variables Influence Category Dependent Variables
LNY LNZ
LNK(-1) Direct Influence Indirect Influence Total Influence 0.156 - 0.156 0.151 0.059 0.210 LNL(-1) Direct Influence Indirect Influence Total Influence 0.388 - 0.388 0.239 0.127 0.366
LNPK1(-1) Direct Influence Indirect Influence Total Influence 0.306 - 0.306 0.119 0.115 0.234
LNPK1(-1) Direct Influence Indirect Influence Total Influence 0.215 - 0.215 0.126 0.081 0.207 LNPK1(-1) Direct Influence Indirect Influence Total Influence - - -0.337 - 0.337
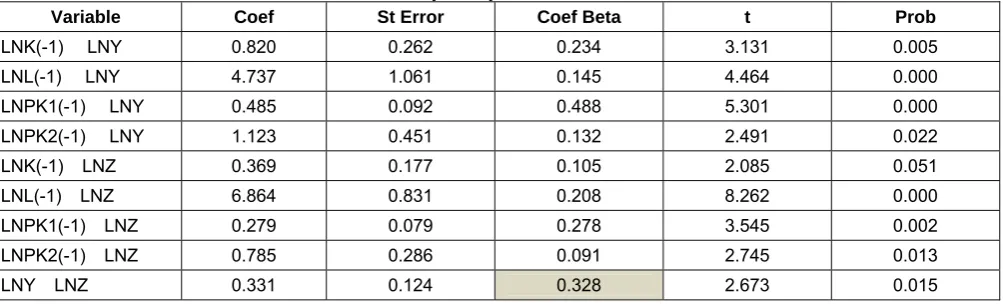
The Transgression data of Feasibility Study from 2010 until 2040 are shown in Table 3. The corellation of each variables with path coefficient are shown in Figure 6 and the direct, indirect and total influences of each variables are shown in table 4.
Table 3-Transgression Analysis: An Overview of Path Coefficient or Direct Influences of each variables of Feasibility Study Data Research
Variable Coef St Error Coef Beta t Prob
LNK(-1) LNY 0.820 0.262 0.234 3.131 0.005
LNL(-1) LNY 4.737 1.061 0.145 4.464 0.000
LNPK1(-1) LNY 0.485 0.092 0.488 5.301 0.000
LNPK2(-1) LNY 1.123 0.451 0.132 2.491 0.022
LNK(-1) LNZ 0.369 0.177 0.105 2.085 0.051
LNL(-1) LNZ 6.864 0.831 0.208 8.262 0.000
LNPK1(-1) LNZ 0.279 0.079 0.278 3.545 0.002
LNPK2(-1) LNZ 0.785 0.286 0.091 2.745 0.013
Table 4- Transgression Analysis: Direct, Indirect, and Total Influences of Each Variables of BPS Data Research Independent Variables Influence Category Dependent Variables
LNY LNZ LNK(-1) Direct Influence Indirect Influence Total Influence 0,234 - 0,234 0,105 0,077 0,182 LNK(-1) Direct Influence Indirect Influence Total Influence 0,145 - 0,145 0,208 0,048 0,256
LNPK1(-1) Direct Influence Indirect Influence Total Influence 0,488 - 0,488 0,278 0,160 0,438 LNPK2(-1) Direct Influence Indirect Influence Total Influence 0,132 - 0,132 0,095 0,043 0,138 LNY Direct Influence Indirect Influence Total Influence - - -0,328 - 0,328
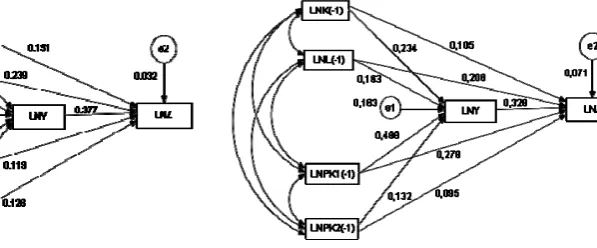
Path coefficients in Table 3 and 4 can be exposed in an interconnecting diagrams in Figure 5 and 6.
4. CONCLUSION
The two above models show that the two methods of analysis (Regression and Transgression) have resulted a typical result of private output contribution towards the GDP. The contribution of private output variables leads the top rank among other variables in which its path coefficient is 0,377 by regression analysis and 0,328 by transgression analysis towards GDP. The highest direct influence coefficient of other independent variables is 0,488 which comes from the state expenditure for infrastructure development by transgression analysis. Meanwhile, by regression analysis, 0,338 is the coefficient number for labors and 0,306 for the state expenditure for infrastructure development.
ACKNOWLEDGEMENTS
The writer sincerely wish to express gratitude to Prof. Dr. Made Kembar Sri Budhi, Drs.MP, from Faculty of Economics at Postgraduate Program, University of Udayana, Denpasar, Indonesia, as an academic advisor to guide and advise during the process of forming this paper. Writer also wishes to express a massive appreciation and gratitude to Dr. Ir. Paulus Kurniawan, MBA, a chairman of the economics doctorate association of Udayana University (IDEYANA) Denpasar, Indonesia, for supporting data from the feasibility study. Moreover, the writer would also like to thank the reviewers and publisher for publishing this paper with sincere assistance. In the end, for any errors and omissions in this paper, the writer is independently responsible accordingly.
Figure 5.-Regression Analysis: A Diagram of Researched Variables Connections by using BPS Data
REFERENCES
Adelman, Irma. 1961 : Theories of Economic Growth and Development, California: Stanford University Press. Aghion, Philippe & Steven Durlauf (eds.). 2005 : Handbook of Economic Growth, Elsevier.
Arsyad, Lincolin. 2010 : Pembangunan Ekonomi : STIM YKPN, Yogyakarta.
Barro, Robert J. & Xavier Sala-i-Martin. 2004 : Economic Growth, Second Edition, Cambridge: The MIT Press.\
Bishop, Sangeta, and Parrott, Christine et al. 2011 : AP. Macroeconomics/Microeconomics;Publisher :Kaplan Publishing, New York.
BPS (Bengkulu Statistic Center). 2011 : Berita Resmi Statistik, No 47/08/Thun XIV, 1 Agustus.
BPS (Bengkulu Statistic Center) Bengkulu Province. 2009 : Indikator Kesejahteraan Rakyat / Welfare Indicators, Publisher: BPS, Jakarta, Cataloque No: 4102004.
2010 : Provinsi Bengkulu dalam Angka : BPS Provinsi Bengkulu, Katalog Bps : 1102001.17.
2011 : Berita Resmi BPS Statistik Provinsi Bengkulu tentang Keadaan Ketenagakerjaan Provinsi Bengkulu, edisi Mei, 2011 2012 : Data Olahan dari Perpustakaan BPS Provinsi Bengkulu, (tidak di publikasikan).
2013 : Data Olahan dari Perpustakaan BPS Provinsi Bengkulu, (tidak di publikasikan).
Carter Hill, R, Griffiths William and Lim. Guay C. 2012 : Principles of Economics, John Wiley and Sons, Pte Ltd, Fourth Edition
Cramon, Von dan Rovayo, A. 2006 : Export - Base Theory Georg – August – Universitat,Gottingen ,www.uni-goettingen.de/de/...pdf/EXPORT-BASE%20THEORY.pdf.
D’Agata, Antonio dan Freni, Giuseppe. 2003 : The structure of growth models: Acomparative survey, University of Cotania (Italy) and Parthenope University, Noples : http://growthconf.ec.unipi.it/papers/DAgataFreni.pdf, diunduh 10 Januari 2011
Gujarati, 2009 : Dasar-dasar ekonometrika (Essentials of Economics), Erlangga, Jakarta, Edisi Jilid 1 dan 2, Cetakan Ulang dari 2006.
http://www.bps.go.id
http://economistsview.typepad.com/economistsview/2008/10/new-trade-theor.html.
Kurniawan, Paulus. 2010 : Feasibility Study, Coal Port and Double Track Railway from Muara Enim to Pulau Baai Transportation Project to Increase Export Capacity in Bengkulu, dengan Perusahaan Terbatas Pratama Widya Jakarta terdiri 8 (delapan) buku laporan lengkap (tidak dipublikasikan).
Paulus. 2011 : Teori Pertumbuhan Ekonomi Sektoral dan Keterkaitannya, Perpustakaan FEB, UNUD, tidak dipublikasikan. Kurniawan, Paulus, Kembar SB, Suyana Utama, Mahaendra Yasa. 2013 : Impact of Coal Railroad Transportation Project on
GDP Promotion and Unemployment Reduction in Bengkulu Province, Indonesia, Journal of Economic Development, Quarterly Journal, University of Economics Hochiminh City, Vietnam, No, 216.
Riley, Geoff and College, Eton. 2006 : A2 Macroeconomics / International Economy Theories of Economic Growth.http://tutor2u.net/economics/revision-notes/a2-macro-theories-of-economic growth.html.
Romer, Paul N. 1990 : Endogenous Technological Change, The Journal of Political Economy, Vol. 98(5), pp. S71-S102. Rostow, Walt Whitman. 1990 : Theories of Economic Growth from David Hume to the present: With a Perspective on the
Next Century, New York: Oxford University Press.
Salengke. 2012 : Engineering Economy, Techniques for Project and Business Feasibility Analysis, Identitas Unhas, Makassar.
Sen, Amartya. 1999 : Development as Freedom, New York: Oxford University Press.
Solow, Robert M. 1956 : A Contribution to the Theory of Economic Growth, The Quarterly Journal of Economics, Vol. 70(1), pp.65-94.
Stimson, R. J, R. R. Stough, B. H. Roberts. 2006 : Regional Economic Development: Analysis and Planning Strategy, Revised Edition., Berlin, Springer.
Stimson, Robert.J dan Stough, Roger.R dan Salazar, Maria. 2009 : Leadership and institutions in regional endogenous development. Corresponding Author : Roger R. Stough, ([email protected]) , publisher : George Mason University, VA, USA.
Attachment 1
No Year GDRP Investment (PMTB)
Labors (People)
PK1 (Construction)
PK2 (Education
and Health)
DBH General
Mining
Attachment 2 Feasibility Study