Original Research Article
An assessment of quality of life of transgender adults in an urban area
of Burdwan district, West Bengal
Prosenjit Naskar
1*, Sima Roy
1, Somnath Naskar
1, Indrajit Gupta
2INTRODUCTION
Transgender is the state of one’s gender identity or gender expression which does not match with ones assigned sex at birh.1 Transgender is an umbrella term
used to incorporate people of various gender
identifications, including transsexuals, drag queens and drag kings, masculine women, feminine men, and others
who violate normative gender laws but who do not necessarily seek and/or obtain surgical and medical treatment.2 Infrequently, the term transgender is defined very broadly to include cross-dressers, regardless of their gender identity.3 There are at least 490,000 Transgender in India.4 Transgender people are stigmatised in India and commonly known as Hijras. The social acceptance of transgender people is not same as male/female gender in Indian cultures and they face discrimination in many
ABSTRACT
Background: Transgender people are stigmatised in our society and are being discriminated in every aspect of life.
Many of them experience abuses in various forms since childhood. Accordingly these might have adverse consequences on their life and modify their quality of life (QOL). This aspect needs to be explored. In this context the present study was conducted to assess the QOL among adult transgender people and to find its association with their socio-demographic characteristics in Burdwan municipal area of Burdwan district.
Methods: A cross-sectional study was conducted during July-December 2016 among 79 adult transgender people
residing in the study area. Sample size was based on 50% having satisfactory QOL with 95% CI, 10% relative error, and 10% non-response rate with finite population correction (total target reference population 96). Subjects were selected by simple random sampling and recruited for interview by time space sampling. Socio-demographic characteristics were assessed by a predesigned schedule and QOL was assessed by using a validated Bengali version of WHO-QOL BREF questionnaires.
Results: 56.9% people were found to be have good QOL score as a whole. Maximum and minimum percentages of
good QOL score was found in environmental domain (84.7%) and social relationship domain (45.8%). A significant positive correlation was found between education and monthly income with QOL score while negative correlation between age and QOL score. Marital status, current living status and occupation were found to have a statistically significant association with QOL score.
Conclusions: The study measured QOL as well as identified some important socio-demographic variables which
affected QOL among transgender people. These findings can help the government to plan conceptually to improve QOL in this special transgender group of population by some legislation, social awareness and facilities dedicated towards them.
Keywords: Transgender, Quality of life, WHO-QOL-BREF questionnaires, Discrimination
1
Department ofCommunity Medicine, 2Department of Microbiology, Burdwan Medical College, West Bengal, India
Received: 03 January 2018
Accepted: 03 February 2018
*Correspondence:
Dr. Prosenjit Naskar,
E-mail: [email protected]
Copyright: © the author(s), publisher and licensee Medip Academy. This is an open-access article distributed under
the terms of the Creative Commons Attribution Non-Commercial License, which permits unrestricted non-commercial use, distribution, and reproduction in any medium, provided the original work is properly cited.
ways like in housing, health, employment education, marriage etc.5,6
A study done in Bangalore showed that 45% of the transgender participants perceived that they have a good quality of life (QOL) and 13.3% of the participants responded that they have a very good QOL. Overall a moderate to good level of QOL of the transgender older adults was found. The association between overall QOL and monthly income was found to be statistically significant.7
A report on transgender people published by UNAIDS in 2014 mentioned that 65% to 85% of transgender people experienced verbal abuse, 25% to 45% faced physical abuse and almost 20% were sexually abused.8 The Los Angeles Transgender Health Study has also shown that overall 80% transgender people being verbally abused and nearly 50% of them faced physical abuse.9 Many of them experienced abuses from childhood to rest of their life in higher percentage compared to general population.10
All these adverse life circumstances are likely to have adverse psychological impact on transgender people which further may force them to tend job below their intellectual capacity. Many generate income from petty extortion, by performing at ceremonies, begging and sex work.11 As a consequence of all these it seems that they suffered from poor QOL also.5
In India as well as worldwide most of the studies, survey or programmes on transgender people was related to life style behaviour and sexually transmitted diseases considering that they are at high risk group and source population for STI/RTIs.8,12-15
Though the society has started acknowledging what they are going through, the living conditions and the quality of life of the transgender people in the Indian context but till date only few studies are done in India.5,7,16,17 There is a dearth of knowledge regarding socio-demographic characteristics and QOL of transgender people in West Bengal. With this background the present study was conducted with the following objectives.
Objectives
1. To assess quality of life of adult transgender people in an urban area of Burdwan district.
2. To find out association between quality of life and various socio-demographic variables, if any.
METHODS
Type and design of study
Cross sectional, descriptive type of observational study
Study area/setting
Burdwan Municipal area of Burdwan district, West Bengal.
Study duration
July to December 2016
Study population
Transgender People residing in the Burdwan Municipal area (Transsexuals, drag queens and drag kings, masculine women, feminine men, and others who violate normative gender laws. The term transgender also included cross-dressers, regardless of their gender identity).
Exclusion criteria
Unwilling to participate in the study or under 18years of age or seriously ill.
Sample size and sampling technique
Considering 50% having satisfactory quality of life among transgender people (No published data is available in West Bengal regarding QOL of transgender people by using WHO-QOL BREF scale) and 10% relative error with 95% CI, sample size will be 385 (N=Z2PQ/L2, Z=1.96, p=50%, Q=1-P, L=10% of P)
As the sample size was more than 10% of the reference target population (96), it was adjusted for finite population correction. The final sample size became 71. Considering non-response rate 10%, 79 samples was included in this study. Samples were drawn by simple random sampling.
(After discussion with the local organisation of transgender people, the total number of transgenders residing in Burdwan Municipal area was found to be 96.)
Study tools and technique
Tools
WHO-QOL Bref questionnaires
(The WHO QOL-BREF contains a total of 26 questions. WHO QOL-BREF is based on a four domain structure, viz. Physical health, psychological health, social relationships and environment. Domain scores are scaled in a positive direction (i.e. higher scores denote higher quality of life).18
Technique
Interviewing the study subjects and application of WHO-QOL BREF questionnaires.
Data collection
A representative from the transgender communities has been involved at the planning and execution level of data collection. At the beginning of this study, transgender people and transgender support groups were contacted and requested to broadcast the information about the study among its members as widely as possible and with their help the total number of transgender people living in Burdwan Municipal area was assessed. Required number of sample was then chosen by simple random sampling.
As this is a very special group of people and their responses regarding quality of life questionnaires may vary even in the different time of the day, 3 time zones (6 am – 10 am, 12 noon – 4 pm and 6 pm – 10 pm) has been selected and equal number of study subjects were recruited for assessment in this 3 time zone. Number of study subjects’ recruitment was also spread out equally throughout the whole data collection period.
After taking written consent from each study participant a predesigned and pre tested schedule, to assess the socio-demographic characteristics, was filled up by the interviewer and a Bengali version of WHO-QOL BRIEF questionnaires was then applied. A WHO-QOL BREF questionnaire was self-administered. For illiterates, the questionnaire was filled up by representative of transgender after reading and explaining the questions. During data collection, every effort was taken to be non-judgmental and unbiased as the nature of the study involves sensitive issues like sex work engagement and sexual behaviours.
Data analysis
The statistical analysis was done by using SPSS version 20 after entering the data in Excel sheet. Descriptive statistics has been used to describe the socio-demographic information and inferential statistical methods (correlation, association) were used to examine the relationship between quality of life and various socio-demographic variables. The items in WHOQOL-BREF were recoded and missing data were checked prior to analyses. For scoring and interpretation manual scoring guideline stated by WHO was followed. First individual domain wise raw score were calculated manually by a simple algebraic sum of each item in each of the four domains, then domain scores were transformed in order to be interpreted and compared with the original scale (0-100 scale).18 Then the mean value and standard deviation of the transformed WHOQOL-BREF scores were calculated- both domain wise and in total. Score more than or equal to 50% of the maximum possible score was considered as satisfactory QOL score and anything less than that was consider poor QOL score. For domain 1-4 maximum possible score is 100 and overall maximum possible score is 400.
RESULTS
Socio-demographic details of the study subjects
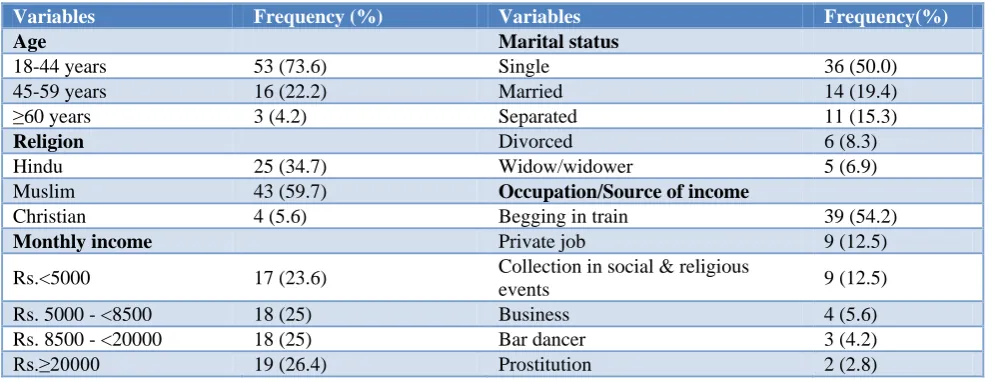
Majority of the study population belong to the age group of 18-44 years and 59.7% of them were Muslim. Most of the people were unmarried (50%) and living with other transgender friends (63.9%). A major 22.2% were illiterate. The main source of income of 54.2% people was begging in train, 12.5% were in private organisation and 5.6% own business. An average income was Rs. 11000/month and 26.4% of them had income Rs. ≥20000/month. In this study 98.6% people were
verbally abused, 79.2% physically abused, 33.3% sexually abused and 18.1% faced childhood abuse at least once in lifetime. Almost 20% of them attempted suicide once or more in their lifetime (Table 1).
Table 1: Socio-demographic characteristics (N=72).
Variables Frequency (%) Variables Frequency(%)
Age Marital status
18-44 years 53 (73.6) Single 36 (50.0)
45-59 years 16 (22.2) Married 14 (19.4)
≥60 years 3 (4.2) Separated 11 (15.3)
Religion Divorced 6 (8.3)
Hindu 25 (34.7) Widow/widower 5 (6.9)
Muslim 43 (59.7) Occupation/Source of income
Christian 4 (5.6) Begging in train 39 (54.2)
Monthly income Private job 9 (12.5)
Rs.<5000 17 (23.6) Collection in social & religious
events 9 (12.5)
Rs. 5000 - <8500 18 (25) Business 4 (5.6)
Rs. 8500 - <20000 18 (25) Bar dancer 3 (4.2)
Variables Frequency (%) Variables Frequency(%)
Original birth place Unemployed 6 (8.3)
Urban 41 (56.9) Current living status
Rural 31 (43.1) With others transgender people 46 (63.9)
Education Alone 10 (13.9)
Illiterate 16 (22.2) Own family 9 (12.5)
Class I-IV 17 (23.6) Parents/biological family 2 (2.8)
Completed primary 15 (20.8) Male friend 5 (6.9)
Completed middle school 12 (16.7) Abuses and others
Completed secondary 5 (6.9) Experienced childhood sexual abuse 13 (18.1)
Completed
Higher-secondary 4 (5.6) Experienced verbal abuse 71 (98.6)
Graduate 2 (2.8) Experienced physical abuse 57 (79.2)
Post-graduate 1 (1.4) Experienced sexual abuse in adult life 24 (33.3)
Attempted suicide at least once 14 (19.4)
Table 2: Quality of life Score (N=72).
Maximum possible score
Minimum score
Maximum score
Mean
score SD
Dom 1- Physical health 100 19 94 56.1 21.4
Dom 2- Psychological health 100 25 94 54.6 22.2
Dom 3- Social relationship 100 6 81 47.4 21.2
Dom 4- Environment 100 38 88 63.0 14.0
Total QOL score 400 131 332 221.1 67.8
*Score described as per transform score in 0-100 scales (WHO-QOL BREF).19
Table: 3 Distribution of study subjects as per QOL score (N=72).
QOL Measured QOL
Frequency Percentages (%)
Very poor - -
Poor 21 29.3
Neither poor nor good 24 33.3
Good 19 26.4
Very good 8 11.1
Table 4: Categories of quality of life scores (N=72).
Satisfactory QOL* Poor QOL**
Frequency Percentages (%) Frequency Percentages (%)
Dom 1- physical health 46 63.9 26 36.1
Dom 2- psychological health 42 58.3 30 41.7
Dom 3- social relationship 33 45.8 39 54.2
Dom 4- environment 61 84.7 11 15.3
Total QOL score 41 56.9 31 43.1
Perceived QOL (themselves) 37 51.4 35 48.6
*For dom1-4 score ≥50 andfor overall QOL score ≥200 considered as satisfactory QOL score. ** For dom1-4 score <50 and for overall QOL score <200 considered as poor QOL score.
Assessment of the Quality of life of the study populations
Mean score of QOL as a whole was 221.1 and individual
domain wise mean score of physical health,
psychological health, social relationship and environment were 56.1, 54.6, 47.4 and 63.0 respectively. Good and very good QOL score were found among 26.4% and
Association and correlation of QOL score with different socio-economic characteristics
The association between marital status, current living status and main source of income with overall QOL score
was found to be statistically significant. Monthly income and education of the study population had a significant positive correlation with their QOL score. A significant negative correlation was found to exist between age and QOL score (Table 5, 6).
Table 5: Association between QOL with some socio-demographic variables (N=72).
QOL Score
Original birth place Satisfactory QOL (%) Poor QOL (%) Total (%) Chi-square
value=0.631, df=1, p≥0.05 (Statistically not significant)
Urban 25 (61.0) 16 (39.0) 41 (100)
Rural 16 (51.6) 15 (48.4) 31 (100)
Total 41 (56.9) 31 (43.1) 72 (100)
Religion
Hindu 15 (60) 10 (40) 25 (100) Chi-square
value=5.603, df=2, p≥0.05 (Statistically not significant)
Muslim 26 (60.5) 17 (39.5) 43 (100)
Christian - 4 (1.7) 4 (100)
Total 41 (56.9) 31 (43.1) 72 (100)
Marital status
Single 16 (44.4) 20 (55.6) 36 (100)
Chi-square
value=12/041, df=3, p≤0.05 (Statistically significant)
Married 11 (78.6) 3 (21.4) 14 (100)
Separated 10 (90.9) 1 (9.1) 11 (100)
Widow/widower/divorced 4 (36.4) 7 (63.6) 11 (100)
Total 41 (56.9) 31 (43.1) 72 (100)
Current living status
Others transgender, male
friend 23 (45.1) 28 (54.9) 51 (100) Chi-square
value=10.263, df=2, p≤0.05 (Statistically significant)
Parents, Own family 10 (90.9) 1 (9.1) 11 (100)
Alone 8 (80.0) 2 (20.0) 10 (100)
Total 41 (56.9) 31 (43.1) 72 (100)
Occupation
Begging in train, social
entertainment 28 (58.3) 20 (41.7) 48 (100)
Chi-square
value=13.063, df=4, p≤0.05 (Statistically significant)
Private job 9 (100) - 9 (100)
Business 1 (25.0) 3 (75.0) 4 (100)
Bar dancer, prostitution 2 (40) 3 (60) 5 (100)
Unemployed 1 (16.7) 5 (83.3) 6 (100)
Total 41 (56.9) 31 (43.1) 72 (100)
Table 6: Correlation between age, monthly income and education with overall QOL score.
Variables Quality of life
Correlation coefficient P value
Age Pearson Correlation coefficient = -.314 0.007
Monthly income Pearson Correlation coefficient =.457 0.000
Education Spearman’s rho Correlation coefficient =.574 0.000
DISCUSSION
Socio-demographic characteristics
The present study showed that 50% of transgender people were single and 19.4% were married. The problem of illiteracy was 22.2%. Begging in train was the main source of income of 54.2%. At present 63.9% of them are living with others transgender friend and 13.9% were
living alone. About 26.4% of them having monthly income Rs.≥20000.
percentage of them were single (93.3%) and only 27.7% were beggarby occupation, which is contradictory to this present study.5 This result was found probably due to extremely low sample size of that previous study.
In this study almost all the people were verbally abused, 79.2% were physically abused and 33.3% were sexually abused even 20% of them attempted suicide at least once in their lifetime. A report published by UNAIDSand the Los Angeles Transgender Health Study showed lesser rate of verbal and sexual abuse which was probably due to different social and cultural view.8,9 National center for
transgender equality report showed 41% transgender
people have suicidal attempt at least once in a lifetime which was also very high compared to this present study (Table 1).19
Quality of life
In the all domain, QOL score were found to be ≥50% except social relationship domain where mean score was 47.4. QOL score was highest in environmental domain and lowest in social relationship domain. There were almost 37% of study population had good or very good QOL sore and almost 30% had poor QOL score. No one got very poor QOL score.
The overall QOL mean score was 221.1 and 56.9% were having satisfactory QOL score. A study by George, Janardhana and Muralidhar found moderate to good QOL score in all the 4 domain of QOL.7 The percentage of people belongs to the group of good and very good QOL score was much higher than the present study. Another study by Poguri, Sarkar, Hawa using WHO QOL-BREF showed that among all domains, mean QOL score was highest in environmental domain and lowest in social relationship domain which is very similar to this present study (Table 2 and 3).5
Association and correlation of QOL score with different socio-economic characteristics
Chi-square test showed that there was statistically significant association existing between marital status, current living status and occupation with overall QOL score. Monthly income and education were found positively correlated with overall QOL score though age was correlated negatively. Similar type of significant positive correlation between monthly income and QOL score was also found in a study done in Karnataka (Table 4 and 5).7
CONCLUSION
The study helped us in understanding the quality of life of transgender adults as well as identifying some important socio-demographic characteristics which had impact on QOL. Most of them were suffering from poor social relationship as well as poor QOL. Quality of life had a statistically significant association with marital status,
current living status and occupation. This study also showed that higher education and higher monthly income are positively correlated with the satisfactory QOL. So these are the areas where emphasis can be given to improve QOL. Older age had negative correlation with QOL so such population should also be brought under geriatric care programme.
Since the study was done in a small sample and in a particular geographic area, multicentric study with large sample is recommended which might be able to discern other issues related with their QOL and act as a ready reference to provide guidelines to society and policy makers to improve the QOL of transgender people.
Limitations
There is a chance of self-selection bias as no specific method was applied to confirm the transgender ship of study population.
Scope of the study
We hope that this study will be welcomed by transgender people and they will feel that their voices have been heard. We also hope that the findings of the study will sensitise public bodies and other service providers to commit resources for further understanding and better inclusion of the mental health needs of transgender people. Additionally, we expect to motivate the decision makers to implement changes for improving health and wellbeing outcomes of the transgender population.
ACKNOWLEDGEMENTS
We would like to thanks all the transgender people who participated in this study. We especially thank the leaders of their groups who not only helped us but also supported and encouraged to conduct this research.
Funding: No funding sources Conflict of interest: None declared
Ethical approval: The study was approved by the Institutional Ethics Committee of Burdwan Medical College. Confidentiality and anonymity was maintained
REFERENCES
1. GLAAD Media Reference Guide (2011)
Transgender Issues, GLAAD. Available at:
http://www.glaad.org/sites/default/files/GLAAD%2 0MRG_9th.pdf. Accessed 12 December 2016.
2. Newfield E, Hart S, Dibble S, Kohler L.
Female-to-male transgender quality of life. Quality of Life Res. 2006;15:1447–57.
3. Reisner SL, Conron K, Scout N, Mimiaga MJ,
for transgender health research. LGBT Health. 2014;1(2):98–106.
4. Nagarajan R. First count of third gender in census: 4.9 lakh. The Times of India, Delhi. Available at: http://timesofindia.indiatimes.com/india/First-count-of-third-gender-in-census-4-9-lakh/articleshow/ 35741613.cms Accessed 14 December 2016. 5. Poguri M, Sarkar S, Hawa S N. A Pilot Study to
Assess Emotional Distress and Quality of Life
among Transgenders in South India. J
Neuropsychiatry. 2016;2(1):13.
6. Suicidal attempts among transgender and gender
non-conforming adults. National transgender
discrimination survey. The Williams Institute. American foundation for suicide prevention.
7. George A, Janardhana N, Muralidhar D. Quality Of
Life of Transgender Older Adults. International J of Humanities Social Sci Invention. 2015;4(6):7-11.
8. The gap report 2014. Transgender people. UNAIDS
/ JC2656 ISBN 978-92-9253-062 4. Available at: http://www.unaids.org/sites/default/files/media_asse t/08_Transgenderpeople.pdf Accessed 12 December 2016.
9. Reback CJ, Simon PA, Bemis CC, Gatson B. The Los Angeles Transgender Health Study: Community Report. 2001.
10. Friedman MS, Marshal MP, Guadamuz TE, Wei C,
Wong CF, Saewyc E, et al. A meta-analysis of disparities in childhood sexual abuse, parental physical abuse, and peer victimization among sexual minority and sexual nonminority individuals. Am J Public Health. 2011;101:1481-94.
11. Abdullah MA, Basharat Z, Kamal B, Sattar NY, Hassan ZF, Jan AD, et al. Is social exclusion pushing the Pakistani Hijras (Transgenders) towards commercial sex work? A qualitative study. BMC Int Health Human Rights. 2012;12:32.
12. Hernandez AL, Lindan CP, MathurM, Ekstrand M, Madhivanan P. Sexual behavior among men who have sex with women, men, and Hijras in Mumbai,
India--multiple sexual risks. AIDS and Behavior. 2006;10:S5-S16.
13. Sahastrabuddhe S, Gupta A, Stuart E, Godbole S, Ghate M. Sexually transmitted infections and risk behaviours among transgender persons (Hijras) of Pune, India. J Acquired Immune Deficiency Syndromes. 2012;59:72-8.
14. Hijras/ transgender women in India: HIV, Human Rights And Social Exclusion. United Nations Development Programme (UNDP), India. Issue Brief; 2010.
15. Operational Guidelines for Implementing Targeted Interventions among Hijras and Transgender People
in India. Guidelines for CBOs/NGOs and
SACS/TSU. Date: 2015. NACO,Ministry of Health and Family Welfare, Government of India; 2014. 16. Chettiar A. Problems Faced by Hijras (Male to
Female Transgenders) in Mumbai with Reference to Their Health and Harassment by the Police. Int J Social Sci Humanity. 2015;5(9):752-9.
17. Raju DV, Beena KSMTA, Phil M. A Study on
Socio- Economic Issues of Third Genders in Tamilnadu. Int J Sci Res. 2015;4(7):1354-7.
18. WHOQOL-BREF, Questionnaire, 1997. Available
at: http://www.who.int/mental_health/media/en/ 76.pdf?ua=1. Accessed on 12 December 2016.
19. National Center for Transgender Equality. A
Blueprint for Equality, A Federal Agenda for Transgender People. Massachusetts Avenue NW, Suite 700, Washington, DC 2005. Available at: http://www.transequality.org/sites/default/files/ docs/resources/NCTE_Blueprint_for_Equality2012_ FINAL.pdf. Accessed on 12 December 2016.
Cite this article as: Naskar P, Roy S, Naskar S,