Remote Sensing and GIS for Hydrology and Water Resources (IAHS Publ. 368, 2015) (Proceedings RSHS14 and ICGRHWE14, Guangzhou, China, August 2014).
156
Physically
-
based distributed modelling of river runoff under
changing climate conditions
I. KRYLENKO
1,2, YU. MOTOVILOV
1, E. ANTOKHINA
2, V. ZHUK
2&
G. SURKOVA
21Water Problems Institute, Russian Academy of Sciences, Gubkin st. 3, 119333, Moscow, Russia
2 Moscow State University, GSP-1, Leninskie gory, 1, 119991, Moscow, Russia
Abstract Physically-based distributed modelling under changing climatic conditions has been carried out for the Northern Dvina River basin using the ECOMAG (ECOlogical Model for Applied Geophysics). The parameters of the model have been adjusted through calibration against runoff hydrographs observed for the period 2000–2009. Validation of the model has been performed for the period of 1970–1989. Both sensitivity analysis and scenario approaches (based on the CMIP3 projections) have been applied to assess possible hydrological consequences of climate change in the basin. It has been shown that for greenhouse gases emissions A2 scenario, averaged for 11 climate models, annual runoff will not change significantly for the future 50 years. But due to increasing of winter precipitation by up to 15%, the volume of flow in the flood period could increase by up to 20%. Earlier beginning of the flood season is expected because of rising of the air temperature.
Key words cold region hydrology; climate change; rainfall–runoff modelling
INTRODUCTION
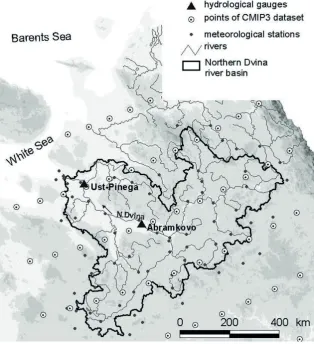
Determination of present and future climate-driven river runoff changes is the question of the day for hydrometeorology. The Arctic river basins, which play a central role in regulating the global climate system, have high priority for these investigations. As the key area for our study, we chose the Northern Dvina River basin, which belongs to White Sea basin. The Northern Dvina River basin, area 360 000 km2, occupies a vast flat forested territory in the northern part of the East European plain between 39–56°E and 58–66°N (Fig. 1). The forest cover of the river basin is more than 80%; only in the northern part do forests (taiga) change to tundra landscapes. Climate of the territory is influenced by cyclonic activity; precipitation here exceeds evaporation, which leads to excessive wetness. More than 60% of the annual runoff passes during the spring flood period. Maximum discharge of 36 200 m3/s was observed at the lower gauge station Ust-Pinega on 28 April 1953. Mean annual discharge of the Northern Dvina River is about 3400 m3/s. There are 35 meteorological and more than 10 runoff hydrological stations within the basin. Due to low anthropogenic pressures, the absence of reservoirs for regulating of river flow, and rather uniform conditions of runoff formation, the Northern Dvina River basin is a good case study for estimation of runoff reaction to changing climate conditions.
To analyse runoff sensitivity to climate change in the Northern Dvina River basin, we have applied the physically-based distributed model ECOMAG (ECOlogical Model for Applied Geophysics) (Motovilov et al. 1999a,b), widely used for simulation of hydrological processes in different climate zones of Eurasia, including basins with changing conditions. (Gottschalk et al. 2001, Gelfan et al. 2014). The model considers the main processes of the land surface hydrological cycle: infiltration, the thermal and water regime of the soil, evaporation, snowmelt, and the formation of surface, subsurface, groundwater and river runoff. A river basin is schematized onto the landscape elements taking into account peculiarities of the river network, topography, soil and vegetation types, and land-use. Daily air temperature, precipitation and air humidity deficit are used as the meteorological inputs to ECOMAG. Parameters of the model are physically meaningful and can be related to measurable characteristics of river basins.
MODEL CALIBRATION AND VALIDATION
area is 348 000 km2). Validation of the model was been performed for the same station for the period 1970–1989. Runoff data of the Abramkovo gauge station (basin area is 220 000 km2) for both periods were used for additional validation. All calculations in this step were done on the basis of daily meteorological station data input.
Fig. 1 The Northern Dvina River basin.
Modelling allowed us to obtain a good fit between the observed and simulated discharges for the periods of calibration and validation. The mean Nash-Sutcliffe criteria value for both river gauges in both periods was more than 0.80. For the lower hydrological gauge Northern Dvina-Ust-Pinega the mean Nash-Sutcliffe criteria value for 2000–2009 was about 0.88, and for 1970–1989 was about 0.81; for the hydrological gauge Northern Dvina-Abramkovo it was 0.86 and 0.84, respectively. The model performance was rather good: the bias of annual runoff volume estimation for the validation period of 1970–1989 was about 2% for the basin outlet gauge Ust-Pinega, and the bias of flood runoff volume for the same gauge was about 5%.
0 2000 4000 6000 8000 10000 12000 14000 16000 18000
1.1 1.2 1.3 1.4 1.5 1.6 1.7 1.8 1.9 1.10 1.11 1.12 dates Q, m3/s
1970-1989
2000-2009
Fig. 2 Simulated mean hydrographs in the Northern Dvina River outlet (gauge Ust-Pinega) for 1970– 1990 and 2000–2009.
ASSESSMENT OF RUNOFF SENSITIVITY TO POSSIBLE CHANGES IN ANNUAL TEMPERATURE AND PRECIPITATION IN THE NORTHERN DVINA RIVER BASIN In the next step, an artificial scenario approach was applied to estimate the sensitivity of the Northern Dvina River runoff to possible climate changes. The artificial time series of daily precipitation and air temperature were constructed from the corresponding observed series for 2000–2009 by changing each daily value of the latter series by ∆P∈[−10%,+20%] and
] 0 . 2 , 0 . 1
[− +
∈
∆T , respectively. Such an approach was applied previously for the Lena river basin (Motovilov and Gelfan 2013).
Runoff hydrographs were simulated using different combinations of the artificial time series. The results of the numerical experiments are shown in Table 1. Simulated annual runoff volume of the Northern Dvina River without changes in climatic characteristics is 95 km3.
Table 1Sensitivity (%) of the simulated annual runoff of the Northern Dvina River to changes in mean annual air temperature and precipitation over the river basin.
∆T (ºC)
∆P (%) 0 +1 +2 –1
0 0 –7 –14 7
+10 21 13 6 28
+20 42 34 26 50
–10 –20 –26 –32 –14
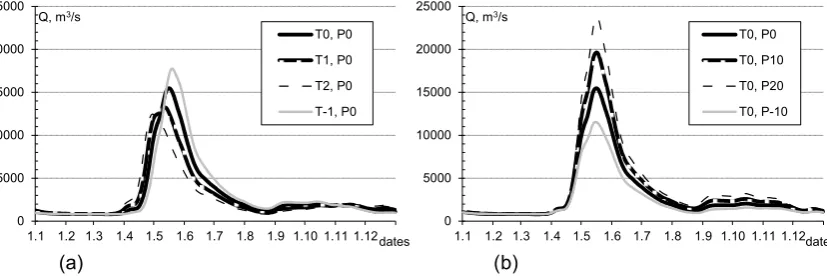
It has been found that one-degree of warming leads to about 7% decrease of the simulated annual runoff primarily as a result of increasing of simulated evapotranspiration. The opposite reaction (increasing in runoff on 7%) takes place in the case of a one-degree decrease of air temperatures. In the case of air temperature changes, we observe time shifts of the flood peak (Fig. 3(a)).
0 5000 10000 15000 20000 25000
1.1 1.2 1.3 1.4 1.5 1.6 1.7 1.8 1.9 1.10 1.11 1.12 Q, m3/s
dates T0, P0 T1, P0 T2, P0 T-1, P0 0 5000 10000 15000 20000 25000
1.1 1.2 1.3 1.4 1.5 1.6 1.7 1.8 1.9 1.10 1.11 1.12 Q, m3/s
dates T0, P0 T0, P10 T0, P20 T0, P-10
(a) (b)
Fig. 3 Simulated mean hydrographs at the Northern Dvina outlet in case of changing in air temperature (a) and precipitation (b): T0, P0 – no changes; T1, P0 – 1ºC warming; T2, P0 – 2ºC warming; T-1, P0 – 1ºC decrease of air temperature, T0, P10 – 10% increase of precipitation; T0, P20 – 20% increase of precipitation; T0, P-10 – 10% decrease of precipitation.
ESTIMATION OF POSSIBLE NORTHERN DVINA RUNOFF CHANGES BASED ON THE CMIP3 PROJECTIONS
Approaches based on artificial scenarios can be rather crude for prediction of future runoff because they do not take into account that increase of warming and precipitation is, most likely, more intensive in the cold season (Motovilov and Gelfan 2013), for more detailed investigations of possible future runoff changes, global circulation model data were involved. The global circulation models describe the main processes of atmosphere circulation with a spatial resolution of from 1 × 1° to 3 × 3° degrees and provide characteristics of the atmosphere at different levels, including land surface meteorological characteristics, which can be used as input to the hydrological model ECOMAG. We used the CMIP3 Multi-Model Dataset for greenhouse gases emissions A2 scenario (IPCC 2007), averaged for 11 models (CCSM3, CGCM3.1, CNRM-CM3, CSIRO-Mk3.0, ECHAM5/MPI-OM, GFDL-CM2.0, GFDL-CM2.1, MIROC3.2, MRI-CGCM2.3.2А, PCM, INM-CM3.0) for two periods – basic period (1970–1989) and forecast period (2046–2060). The averaging procedure was done through interpolation of daily precipitation and air temperature data from different models to a regular 2 × 2° grid (Kislov et al. 2009). For example, the area of the Northern Dvina River basin contains more than 20 points of this regular grid. As shown by different researchers (Kislov et al. 2009, Gusev et al. 2011) all climate change estimations by the base global circulation models only become reliable for averaging of several models’ outputs for large territorial units and rather big time scales (years).
After taking into account systematic shifts in air temperature and precipitation values, modelling on the basis of the global circulation models dataset showed reasonable results for the basic period (1970–1989) with the same ECOMAG model parameters as were obtained during calibration on the basis of meteorological station data. The average Nash-Sutcliffe criteria for the basic period daily was about 0.62, bias of annual runoff volume was 0.1%, and bias of annual flood runoff volume was 4.3% (Table 2).
Table 2 The Northern Dvina River runoff characteristics (gauge Ust-Pinega) for the basic period (1970– 1989) and for the future (2046–2065).
Data Mean annual runoff
volume, km3 Mean flood runoff volume (for months April to July), km3 Mean maximum year discharge, m3/s
Observed data (1970–1989) 97.1 65.6 20090
Simulation on the base of meteorological stations data (1970–1989)
Runoff 99.2 69.0 19176
Bias, % 2.2 5.2 –4.5
Simulation on the base of global circulation models dataset (1970–1989)
Runoff 97.2 68.4 18634
Bias, % 0.1 4.3 –7.2
Simulation on the base of global circulation models dataset (2046–2065)
Runoff 111 80 23000
Relative change, % 14.3 22.0 14.5
In the next step, the Northern Dvina River runoff for the forecast period (2046–2060) was simulated. Modelling indicated, that due to increase in winter precipitation up to 17%, the runoff volume for the flood period (months of April to July inclusive) could increase by up to 20%. Mean annual runoff also tends to increase by 14% because the 11% annual precipitation increase. Because of rise of the air temperature by 3°С it is possible to expect an earlier start to the flood season in the north; modelling showed an increase in runoff in April of more than 50% (Fig. 4).
CONCLUSION
Numerical experiments with the physically-distributed model ECOMAG for the Northern Dvina River basin identified two opposite tendencies in reaction of the river basin to changing of climatic characteristics. On the one hand warming leads to decrease of annual runoff and flood runoff volumes due to increase of evapotranspiration; on the other hand, precipitation increase leads to the increasing of the aforementioned runoff characteristics. Notably, the results of modelling are more sensitive to precipitation changes. Which tendencies will dominate in the future will depend on realizations of specific scenarios of climate change. As defined for the last decades, changes of climatic and hydrological characteristics in the Northern Dvina River basin (rising of air temperature by 1.5ºC, precipitation by 3.4%, annual runoff volume by 3%) and generated on the basis of greenhouse gases emissions A2 scenario for the next 50 years, the estimations (rising of air temperature by 3ºC, precipitation by 11%, annual runoff volume by 14%) are good and correspond with the developed scheme of runoff reaction to climate changes in the study basin.
Acknowledgements Part of the presented researches related to analysing climate model data was financially supported by a grant of the Russian Government (grant 11.G34.31.0007). The research related to the hydrological modelling and analysis of simulation results were financially supported by the Russian Science Foundation (grant 14-17-00700).
The present work was carried out within the framework of the Panta Rhei Research Initiative of the International Association of Hydrological Sciences (IAHS).
REFERENCES
Gelfan, A., et al. (2014) Testing robustness of the physically-based ECOMAG model with respect to changing conditions. Hydrol. Sci. J. Special issue. Modelling temporally-variable catchments, published online.
Gottschalk, L., et al. (2001) Regional/macroscale hydrological modelling: a Scandinavian experience. Hydrol. Sci. J. 46(6), 963–982.
Gusev, E., et al. (2011) Northern Dvina runoff simulation using land-surface model SWAP and global databases. Vodnye Resursy. 38(4), 439–453.
IPCC (2007) The Physical Science Basis. Contribution of working group I to the Forth Assessment Report of the IPCC (2007). Cambridge University Press.
Kislov, A., Evstigneev, V. and Surkova, G. (2009) Experience of the forecast of water and power resources changes at warming of the 21st century. Sci. China Ser E-Tech Sci. 52(11), 3224–3233.
Motovilov, Yu. and Gelfan, A. (2013) Assessing runoff sensitivity to climate change in the Arctic basin: empirical and modelling approaches. In: Cold and Mountain Region Hydrological Systems Under Climate Change: Towards Improved Projections (ed. by A. Gelfan et al.). IAHS Publ. 360, 105–112. IAHS Press, Wallingford, UK.
Motovilov, Yu., et al. (1999a) Validation of a distributed hydrological model against spatial observation. Agricultural and Forest Meteorology 98-99, 257–277.
Motovilov, Yu., et al. (1999b) ECOMAG – regional model of hydrological cycle. Application to the NOPEX region. Department of Geophysics, University of Oslo, Institute Report Series no. 105.