Mayas Publication 39
A STUDY ON SERVICE QUALITY PERCEPTION
AND SATISFACTION ADOPTED BY TECHNOLOGY
BANKING WITH SPECIAL REFERENCE TO PUBLIC
AND PRIVATE SECTOR BANKS IN CHENNAI
DISTRICT
EIJFMR
Nov-6th 2018
www.eijfmr.com
EBINESAN A Ph.D., Research Scholar Dr. Ambedkar Government Arts College
Vyasarpadi, Chennai – 6000039. Dr. S. BAMA
Assistant Professor in Commerce Dr. Ambedkar Government Arts College
Vyasarpadi, Chennai – 6000039. .
Received : 08th October 2018 Accepted : 29th October 2018
Published : 6th November2018 Reviewer : Dr. K. Boomiraj D. Hiremath
Abstract
The last two decades in the banking industry has seen many developments to face the competition among its competitors. Technology is one field that banking industry focuses on for this competition. Nowadays Technology Banking is the popular technology used by banks. Technology Banking is the outcome of technological innovations and competition. The customers’ satisfaction is also very important to face the challenges for the banks to cope up with other banks. Hence this paper focuses on the satisfaction level of customers towards Technology Banking services provided by Public and Private Sector banks in Chennai District . This study is limited to Tirunelveli area only, Tamil Nadu. The objectives of this study are to find out the factors influencing in the adoption of TECHNOLOGY banking provided by public and private sector banks, identify the level of satisfaction of customers of public and private sector banks towards their usage of technology banking. Convenience sampling method have adopted for this study. The primary data were collected from questionnaire method. From the analysis, it is found that with regard to satisfaction in ATM services, the customers of both sectors of banks are equally satisfied.
Keywords: Technology Banking; Satisfaction; ATM; Public Sector Bank; Private Sector Bank.
INTRODUCTION
Banks in India need to be admired on the enclosure of technology in a large way in their day-to- day operations. The last two decade has seen many constructive developments in the Indian Banking Sector. Nowadays Technology Banking is the popular technology used by banks. Technology Banking means any user with a personal computer and a browser can get connected to his bank's website to perform any of the virtual banking functions. Technology Banking is the outcome of technological innovations and competition. In fact, banks have been using electronic and telecommunication networks for delivering a wide range of value added products and services. As a part of their Technology banking initiatives banks offered the following new delivery channels to customer's Automated Teller Machines (ATM)/ Cash Dispensers (CD), Phone banking, Internet banking and Mobile banking. Banks used Technology Banking as mechanism to fight fierce competition that existed in the market and also to retain the customers base they had customer's response to Technology Banking was enthusiastic and followed predicted path of Technology Adoption Life Cycle models (Shreyan at2002).
Statement of the Problem
In the competitive environment of the post liberalization era, financial sector reforms have significantly relaxed the market. Banks has evolved new products and services to attract the customers through innovative technological delivery channels. There are also several special operations which give an intensive marketing push to increase the customer base and usage of technological innovative banking services. For Indian Banks, there is a wide market potential amongst Technology banking. The demand for Technology Banking is necessitate by the growing Technology commerce transactions and the paradigm shift in banking led by technology. From the perspective of both users and providers, Technology Banking is cost effective, quick and convenient. Hence, it is needed to identify the reason why customer’s preference Technology banking.
OBJECTIVES OF THE STUDY
1) To find out the factors influencing in the adoption of Technology Banking provided by public and private sector banks.
Mayas Publication 41 Scope of the Study
The study aims to find out service quality perception and satisfaction adopted by technology banking to Public and Private sector banks. This study also aims at measuring the satisfaction of the customers and offer suitable suggestions to solve the problems. This study also compares the perception and satisfaction of customers towards Technology Banking services offered by public and private sector banks in Chennai District.
Research Methodology
For this research both primary and secondary data were collected. Primary data were collected from the customers of public sector and private sector banks using Technology Banking and it was collected through defined and well-framed questionnaire. Snowball sampling method was used for selecting sample respondents. Four hundred and sixty one respondents were selected. The secondary data were collected from various websites, books, journals and magazines.
Analysis and Interpretation of Data
Demographic profile is one of the important variables to determine the usage and satisfaction of the respondents. The following tables clearly explain about the demographic profile of the respondents in the study area.
Table 1: Gender wise classification of the respondents
Gender * Type of Bank Cross Tabulation Type of Bank
Total Public Sector Bank Private Sector Bank
Gender Male
117 163 280
52.0% 69.1% 60.7%
Female
108 73 181
48.0% 30.9% 39.3%
Total
225 236 461
100.0% 100.0% 100.0%
From the above table it is clear that, out of 461 respondents majority 60.7 percent are male respondents and rest of the 39.3 percent of the respondents are female respondents.
Out of 236 private sector bank’s respondent’s majority 69.1 percent are male respondents and rest of the 30.9 percent are female respondents.
Table 2: Age wise classification of the respondents
Age * Type of Bank Cross Tabulation
Type of Bank
Total Public Sector
Bank
Private Sector Bank
Age
18 - 30 Years
103 92 195
45.8% 39.0% 42.3%
30 - 50 Years
80 80 160
35.6% 33.9% 34.7%
Above 50 Years
42 64 106
18.7% 27.1% 23.0%
Total
225 236 461
100.0% 100.0% 100.0
%
From the table, out of 461 respondents majority 42.3 percent of the respondents are belong to the age group of 18-30 years, 34.7 percent of the respondents are belong to the age group of 30-
50 and rest of the 23 percent of the respondents are belong to the age group of above 50 years.
Out of 225 public sector bank’s respondents majority 45.8 percent of the respondents are belong to the age group of 18-30 years, 35.6 percent of the respondents are belong to the age group of 30-50 and rest of the 18.7 percent of the respondents are belong to the age group of above 50years.
Mayas Publication 43
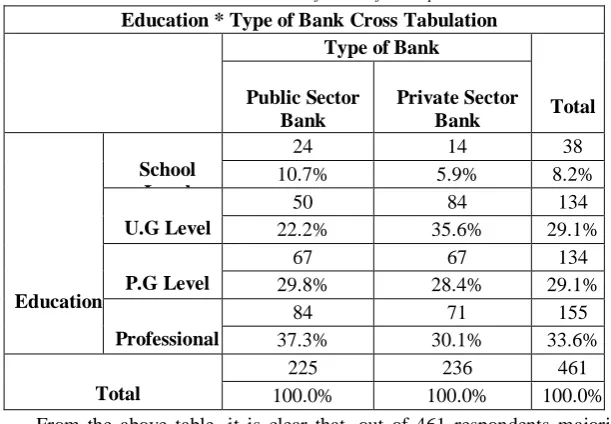
Table 3: Education wise classification of the respondents
Education * Type of Bank Cross Tabulation Type of Bank
Total Public Sector
Bank
Private Sector Bank
Education
School Level
24 14 38
10.7% 5.9% 8.2%
U.G Level
50 84 134
22.2% 35.6% 29.1%
P.G Level
67 67 134
29.8% 28.4% 29.1%
Professional
84 71 155
37.3% 30.1% 33.6%
Total
225 236 461
100.0% 100.0% 100.0%
From the above table, it is clear that, out of 461 respondents majority 33.6 percent of the respondents are completed professional courses, 29.1 percent of the respondents are under graduates, another 29.1 percent of the respondents are post graduates and rest of the 8.2 percent of the respondents are completed up to school level.
Out of 225 public sector bank’s respondents majority 37.3 percent of the respondents are completed professional courses, 29.8 percent of the respondents are post graduates, 22.2 percent of the respondents are under graduates and rest of the 10.7 percent of the respondents are completed up to school level.
Table 4: Marital status of the respondents
MARITAL STATUS * Type of Bank Cross Tabulation Type of Bank
Total Public Sector
Bank
Private Sector Bank
MARITAL STATUS
Single
63 42 105
28.0% 17.8% 22.8%
Married
162 194 356
72.0% 82.2% 77.2%
Total
225 236 461
100.0% 100.0% 100.0%
From the above table, it is clear that, out of 461 respondents majority 77.2 percent of the respondents are married and rest of the 22.8 percent of the respondents are single.
Out of 225 public sector bank’s respondent’s majority 72 percent of the respondents are married and rest of the 28 percent of the respondents are single.
Out of 236 private sector bank’s respondent’s majority 82.2 percent of the respondents are married and rest of the 17.8 percent of the respondents are single.
Table 5: Occupation of the respondents
Occupation * Type of Bank Cross Tabulation
Type of Bank
Total Public
Sector Bank
Private Sector Bank
Occupation
Government Employee
43 34 77
19.1% 14.4% 16.7%
Private Employee
52 67 119
23.1% 28.4% 25.8%
Business
27 41 68
12.0% 17.4% 14.8%
Professional
54 46 100
24.0% 19.5% 21.7%
Student
24 26 50
Mayas Publication 45 Housewife
25 22 47
11.1% 9.3% 10.2%
Total
225 236 461
100.0% 100.0% 100.0%
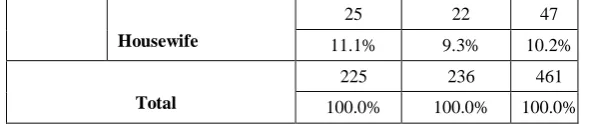
From the above table, it is reveals that, out of 461 respondents majority 25.8 percent of the respondents are private employees, 21.7 percent of the respondents are professional, 16.7 percent of the respondents are government employees, 14.8 percent of the respondents are doing business, 10.8 percent of the respondents are students and rest of the 10.2 percent of the respondents are housewife.
Out of 225 public sector bank’s respondents majority 24 percent of the respondents are professional, 23.1 percent of the respondents are private employees, 19.1 percent of the respondents are government employees, 12 percent of the respondents are doing business, 11.1 percent of the respondents are housewife and rest of the 10.7 percent of the respondents are students.
Out of 236 private sector bank’s respondent’s majority 28.4 percent of the respondents are private employees, 19.5 percent of the respondents are professional, 17.4 percent of the respondents are doing business, 14.4 percent of the respondents are government employees, 11 percent of the respondents are students and rest of the 9.3 percent of the respondents are housewife.
Table 6: Income wise classification of the respondents
Monthly Income * Type of Bank Cross Tabulation Type of Bank
Total Public
Sector Bank
Private Sector
Bank
Monthly Income
Less than 20,000 rupees 66 40 106 29.3% 16.9% 23.0% 20,000 to 40,000 rupees
64 67 131
28.4% 28.4% 28.4% 40,000 to 60,000 rupees
55 77 132
24.4% 32.6% 28.6% More than 60,000 rupees 40 52 92
Total
225 236 461
100.0% 100.0% 100.0%
From the above table, it is clear that, out of 461 respondents majority 28.6 percent of the respondents are earn Rs. 400000-60000 per month, 28.4 percent of the respondents are earn Rs.
20000-40000 per month, 23 percent of the respondents are earn less than Rs. 20000 per month and rest of the 20 percent of the respondents are earn more than Rs. 60000 per month.
Out of 225 public sector bank’s respondents majority 29.3 percent of the respondents are earn less than Rs. 20000 per month, 28.4 percent of the respondents are earn Rs. 20000-40000 per month, 24.4 percent of the respondents are earn less than Rs. 40000-60000 per month and rest of the 17.8 percent of the respondents are earn more than Rs. 60000 per month.
Out of 236 private sector bank’s respondents majority 32.6 percent of the respondents are earn Rs. 40000-60000 per month, 28.4 percent of the respondents are earn Rs. 20000-40000 per month, 22 percent of the respondents are earn more than Rs.60000 per month and rest of the 16.9 percent of the respondents are earn less than Rs. 20000 per month.
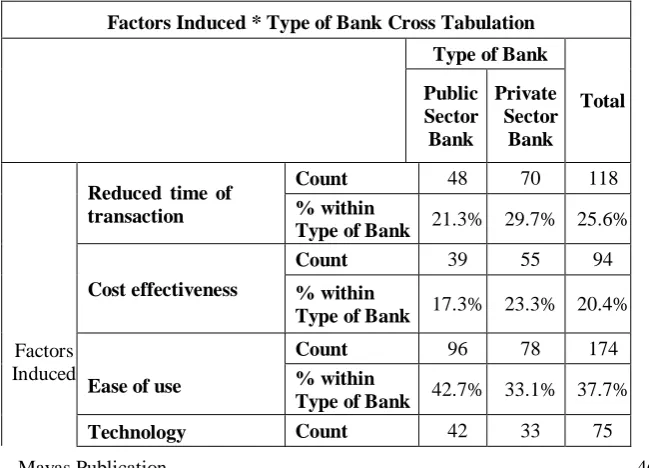
Table 7: Factors induced to use Technology banking
Factors Induced * Type of Bank Cross Tabulation
Type of Bank
Total Public
Sector Bank
Private Sector Bank
Factors Induced
Reduced time of transaction
Count 48 70 118
% within
Type of Bank 21.3% 29.7% 25.6%
Cost effectiveness
Count 39 55 94
% within
Type of Bank 17.3% 23.3% 20.4%
Ease of use
Count 96 78 174
% within
Type of Bank 42.7% 33.1% 37.7%
Mayas Publication 47
savvy % within Type
of Bank 18.7% 14.0% 16.3%
Total
Count 225 236 461
% within Type of Bank
100.0
% 100.0% 100.0
%
From the above table, it is clear that, out of 461 respondents majority 37.7 percent of the respondents says that ease of use is the motivating factor for availing Technology Banking services, 25.6 percent of the respondents says that reduced time of transaction is the motivating factor for availing Technology Banking services,20.4 percent of the respondents says that cost effectiveness is the motivating factor for availing Technology Banking services and rest of the 16.3 percent of the respondents says that technology savvy is the motivating factor for availing Technology Banking services.
Out of 225 public sector bank’s respondents majority 42.7 percent of the respondents says that ease of use is the motivating factor for availing Technology Banking services, 21.3 percent of the respondents says that reduced time of transaction is the motivating factor for availing Technology banking services,18.7 percent of the respondents says that technology savvy is the motivating factor for availing Technology Banking services and rest of the 17.3 percent of the respondents says that cost effectiveness is the motivating factor for availing Technology Banking services.
Table8: Satisfaction of customers
TYPES OF BANK
Public sector Bank Private sector Bank
SATISFACTION Minimum Maximum Mean Minimum Maximum Mean
ATM Services 3 5 3.76 3 5 3.78
Internet Banking Services
2 4 2.83 2 5 3.39
Telephone
Banking Services 1 4 2.17 2 4 3.01
Mobile Banking Services
1 3 2.32 2 4 3.53
The table reveals that mean score of respondents on satisfaction on banking services. The mean score of 3.76 with the range of 3 and 5 for public sector banks and 3.78 with a range of 3 and 5 on ATM services reveals that the customers are equally satisfied with both type of banks. The mean score of 2.83 with the range of 2 and 4 for public sector banks and 3.39 with a range of 2and 5 on internet banking reveals that the customers are better satisfied on internet banking in private sector than public sector banks. The mean score of 2.17 with the range of 1 and 4 for public sector banks and 3.01with the range of 2 and 4 on telephone banking reveals that the customers comparatively are satisfied in private sector banks. The mean score of 2.32 with the range of 1 and 3 for public sector banks and 3.53 with the range of 2 and 4 on Mobile banking reveals that the customers of public sector banks are less satisfied than private sector banks on mobile banking services. It is understood from the analysis that customers are satisfied with the services provided by private sector banks.
FINDINGS OF THE STUDY
In both public and private sector banks male respondents are dominated.
In both public and private sector banks majority of the respondents belong to the age group of 18-30 years.
In public sector banks majority of the respondents have completed their professional courses and in private sector banks majority of the respondents are under graduates.
Mayas Publication 49
In public sector banks majority of the respondents are professional and in private sector banks majority of the respondents are private employees.
In public sector banks majority of the respondents are earn less than Rs. 20000 per month and in private sector banks majority of the respondents are earn Rs. 40000-60000 per month.
In both public and private sector banks majority of the respondents says that ease of use is the motivating factor for availing Technology Banking services .
The customers of both public and private sector banks are equally satisfied with ATM services provided.
On the whole customers are satisfied with the services provided by private sector banks.
SUGGESTIONS
Public Sector banks must give individual attention and proper response to customers in providing information whereas the level of responsiveness is high in the private sector banks. This will help many customers to rely on public sector banks for their banking needs.
Banks must ensure to their customers that their service is competitive. Many customers feel that the privacy and security features are to be enriched. So banks must concentrate further on security and withhold their customers and improve them more.
Ease of use is the major factor to induce the customers to adopt Technology banking. Therefore banks should maintain its applications more user friendly and up to date.
ATMs receive the higher attraction among the Technology Banking channels. Banks must pay attention and plan to make the ATMs as the key distribution channel for all kinds of banking transactions.
CONCLUSION
REFERENCES
1) Fox, S. (2005). The state of online banking. In Pew Internet &American Life Project, Pew Research Center. Retrieved on April, 2017 from _2005.pdf.
2) Golden, S. A. R. (2015). Regional Imbalance affecting quality of Technology Banking services with special reference to Tuticorin District- An Analysis. International Journal of Research, 2(3), 788-799.
3) Regi, S. B. (2015). Satisfaction of Customers towards User Friendly
Technological Services offered by Public and Private Sector banks at, Chennai District . International Journal of Research, 2(3), 775-787.
4) Khalil, M. N., & Pearson, J. M. (2007). The Influence of Trust on Internet Banking Acceptance. Journal of Internet Banking and Commerce, 12(2) Retrieved on 09 Apr 2017 from
http://www.arraydev.com/commerce/jibc/2007-08/Md_Nor_Final_PDF%20Ready.pdf.
5) Mohan, R. (2004). Indian Banking and Technology Security. Reserve Bank of India Bulletin, November 2004, 1029-1033. Mumbai: Reserve Bank of India.