THE INFLUENCE OF CHINA TO THE CONTAINER MARKET IN
EUROPE
Elen Twrdy1, Milan Batista2
1,2 University of Ljubljana, Faculty of Maritime Studies and Transport, Slovenia
Received 11 March 2019; accepted 08 April 2019
Abstract: European economy, which has globally been one of the most important for centuries, greatly depends on maritime transshipment. According to the European Commission’s data, 74% of cargo, which comes to or leaves Europe, uses maritime transport. Therefore, we can clearly see the importance of ports for economic growth. Over the past decades, containerized transport has become one of the most important ways for transporting cargo, so ports needed to adapt with the new equipment and better capacities. In 2000, the container traffic in EU ports represented as much as 21% of all transshipped containers in the world, while, this percentage was only 18% in Chinese ports. Today, China has become a leading country in the container throughput, with a share of 28%, while the EU’s share has fallen to 15%.
Keywords: containers ports, container throughput, port competition.
1 Corresponding author: elen.twrdy@fpp.uni-lj.si
1. Introduction
Europe, China and the United States of America (USA) are the most important players when we talk about international trade and global economic inf luence. Europea n (EU 28 countr ies) g ross domestic product (GDP) was EUR 15.3 trillion in 2017. While the population of EU countries presents less than 7% of the global population, the European external trade has a 15.6% share in global imports and exports. The importance of transport for the European economy is thus obvious. According to European statistics (EC, 2019), transport represents almost 5% of European GDP and offers more than 11 million jobs. There are more than 3,000 seaports in Europe and they represent the gateways to and from European inland transport
network. Although such a high number of ports exists in Europe, 20% of cargo arriving or leaving EU by sea, takes advantage of the services provided by the three North Sea ports, namely Rotterdam, Hamburg and Antwerp. After almost half of century after its introduction, in the last decades, containers achieved immense spatial and functional diffusion within global transport systems (Guerrero and Rodrigue, 2014). The new generations of container ships arrived and the ports that wanted to remain competitive and prosperous needed to adjust their capacity to these phenomena. Today all major ports have new, big, and highly productive container terminals.
containerized flows over the last decade, reaching the traffic 24 million TEUs in 2017. This represents an annual increase of 6.9% on Eastbound (Europe to East Asia) and 7.1% on Westbound (East Asia to Europe) direction, or in absolute numbers, 7.6 million TEU on Eastbound and 16.4 million TEU on Westbound direction respectively (UNCTAD, 2018). Most of the containers are directed to the Northern European ports (Figure 1) as a large
number of European hinterland countries depends on those ports when it comes to the overseas trade. For example, Austria, a country without its own coastline, uses the services of eight European ports for its overseas trade; four of them are located in north Europe, namely Antwerp, Bremen, Hamburg and Rotterdam, where around 20% of Austrian overseas trade is done through the port of Hamburg alone (Oxera Agenda, 2011).
Fig. 1.
Large Containers Ships Path Density 2016-2017 in Europe Source: Marine Traffic
2. Container Throughput
In 2017 ports handled around 740 million TEUs, which represented a growth of 6%. As can be seen from figure 2, the 2008 global financial crisis had an effect on the container throughput; although it has a generally growing trend, a sharp downturn can be observed in the year 2008. The crisis had a great impact on European and American economy, but not on China. Europe needed about three years to reach container throughput from 2007, while
Fig. 2.
Container Throughput of the Three Main Regions in the Period from 2000 to 2017 [in million TEU] Source: Authors, based on World Bank data
The Figure 3 presents the market shares of EU, USA and China for container throughput. As can be seen Europe lost 3.5% of market share in the last decade. Comparing to the USA, which is one of the
largest economies in the world, Europe still holds a double market share. China, which is alone the second largest economy in the world, increased its market share for 7% in the same period.
Fig. 3.
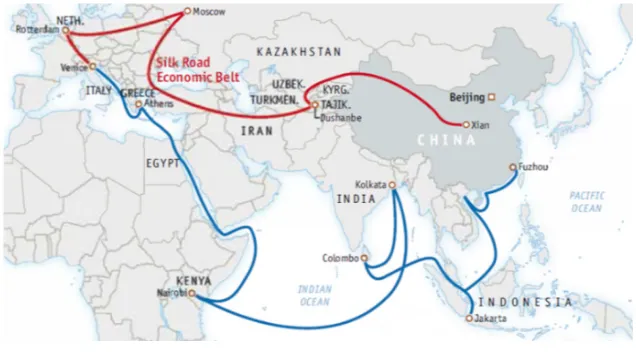
3. One Belt One Road (OBOR) Initiative
One Belt, One Road (OBOR) is an initiative of the People’s Republic of China (PRC) to form the so-called economic belt of the new Land silk route and Maritime silk road of the twenty-first century (Jiang et al., 2018). The strategy was formed at the critical point of China’s economic transformation in 2013. The OBOR concept combines the desire to simplify trade route connectivity and increase trade efficiency, as good transport infrastructure can reduce the cost of transport and transport times, as well as improve delivery reliability (Lu et al., 2018). In this way, China would build the infrastructure according to its needs and consequently improve the security of the country’s import an export flows. In recent years, Chinese overseas direct investment (ODI) has rapidly increased as a result of China’s structural transformations and overcapacity of domestic production. OBOR is generally defined as a means of
strengthening the power and expanding the Chinese enterprises in the global economy, especially in the countries covered by the OBOR strategy. OBOR is focused on linking (Figure 4):
• China with Central Asia, Russia, Central and Eastern Europe and Western Europe (Land Silk Road);
• China with the Persian Gulf and the Mediterranean Sea through Central and Western Asia (Maritime Silk Road). The Maritime silk route comprises a large maritime area that begins with the Chinese coast and extends to Europe and East Africa through the South China Sea and the Indian Ocean and reaches the South Pacific through the South China Sea. It is estimated that OBOR regions cover over 60 countries with a total population of more than 4 billion and a large share of world production (65% for the landlocked part of the Silk Road and 30% for the maritime silk route).
Fig. 4. OBOR
OBOR is a comprehensive economic integration plan for China with various parts of the world, in which transport infrastructure such as ports, roads, airports, and railways is under development. Since the beginning of the initiative, China has become the primary source of funding for many countries in the OBOR area. According to Peng et al., (2018), the most interesting ports are located in Mediterranean, Suez Canal and Hormuz Strait. The European ports that are located in the Mediterranean, Adriatic Sea and the Black Sea will have an important role in Maritime Silk Road. With the initiative of the 21st-century Maritime Silk Road, trade volumes will increase demand for international logistics, which largely relies on maritime shipping (Jiang, 2018). The inf luence of China and OBOR on Europe will be visible in the forthcoming years. Firstly, in the port throughput selected by the Chinese authority, and secondly in the connections of those ports and with the hinterland. An example of this is the port of Piraeus in Greece. Port of Piraeus is the first port in Europe that is controlled and owned by China Ocean Shipping Company (COSCO). In 2009, COSCO got the Concession Agreement for Piers II and III and now they operate the Piraeus Container Terminal S.A. They reported a container throughput of 4.4 million TEU in 2018, almost 20% more than in 2017. In the last 9 years, they have invested EUR 1 billion into the modernization of the container terminal and they plan to construct new storage capacities and to invest in the cruise terminal. As Port of Piraeus has a strategic location and could be used as a hub for Central and East Mediterranean and for the Black Sea, some major Chinese
investments are connected with the construction of modern infrastructure in the hinterland. Rail connection already allows them a weekly train transport to Belgrade, Pardubice and Bucharest.
COSCO investigated the ports in the North Adriatic, namely Venice and Trieste, with the idea to develop them into entry ports of Maritime Silk Road in Europe. A southern entrance to Europe is time and, potentially, cost effective solution for supplying Central European countries; but, the question is if there will be enough cargo shifted from Northern Europe to Mediterranean to justify investments in container terminal (Schinas, 2017). Besides Northern European ports, also the currently existing Northern Eurasian corridor (via China, Kazakhstan, Russia, Belarus and Poland) represents a competition, as it is the fastest and most reliable route for rail container transport between Asia and Europe with almost 325,000 TEU carried in 2018. Depending on the scenario, the traffic from 437,000 to 4,800,000 TEU is expected by 2030 (EC, 2019), mainly depending on OBOR development and geopolitical stability. In fact, in certain cases, Eurasian rail route has already become more competitive than shipping, particularly for the more expensive cargoes (Psaraftis and Kontovas, 2010).
4. Difference Between Container Ports
in Europe and China
closest member of a point set with respect to the Euclidean distance. The strength of the method lies in the integrated considerations of location, distance, influence range, and topological relationship (International Encyclopedia of Human Geography, 2009), which makes the method very applicable for solving transport and logistics problems (eg. Zhou et al., 2018; Wang et al., 2014; Mota et al., 2014; Cao and Glover, 2010).
We used ArcGIS software to create straight-line segments to connect individual ports into a triangulated network. Each polygon defines an area of influence around a selected port. By creating Thiessen polygons of each
port, all locations inside a given area are closer to that port than to any other ports (Figure 5). We have taken into consideration the ports in the region and population in the observed area, just to see if there are any common characteristics between European and Asian ports.
In Europe, the biggest container ports are located in Northern Europe and the competition between these ports is very intensive as they are located close to each other and have the same catchment areas. Ports in the Mediterranean area generally have bigger catchment area but with a smaller population.
Fig. 5.
Port Catchment Areas in Europe and China by using Thiessen Polygons Source: Authors, based on World Bank data
The biggest container ports are located in China where the population of coastal area is much higher than in Europe. The catchment area of the ports in Europe and China is thus different and it is therefore very difficult to compare these ports.
Fig. 6.
Position of Container Ports in the EU and China Source: Authors, based on World Bank data
In the observed period, container ports in the EU lost its market share and increased growth rate, but not enough to obtain a leadership position. Chinese container ports had a lower growth rate, but a higher market share, because the total volume of handled containers is much larger. In 2017, the container throughput of EU ports was just 52% of Chinese throughput. However, this is expected due to large trans-.Pacific trade. According to Pan (2014) the main driving forces of Chinese ports are trade development, government guidance, peripheral challenge and the service network expansion. European ports will never reach the volumes of Chinese ports; however, the OBOR initiative should influence the distribution of container traffic in European ports which would also be in line with the European transport policy of achieving a sustainable or responsible transport by providing the efficient transport routes towards land-locked countries. Given that major infrastructure projects are mainly initiated and coordinated by government
and owned enterprises, Chinese state-owned enterprises are expected to be the primary force in investing in infrastructure sectors in the countries OBOR. They will seek the simple idea that money makes money, meaning that some smaller ports, that currently have a regional importance, might in future become less important.
5. Conclusion
The article presents the analysis of container throughput in the EU and in China, and the potential influence of China on European ports. As the OBOR initiative is an integrated scheme with an emphasis on infrastructure, it is expected that Chinese investments will increase in the silk-crossing countries. For some ports, this will bring prosperity, for some others unfortunately this might become an obstacle in their development process.
enhance the development of trade and that OBOR will facilitate international trade with government policies, in particular through the trade liberalization policy. As the container traffic is one of the most important in the trade between China and EU it is expected that this cargo will continue to increase also in the future. The importance of ports for the European economy is well known and therefore it will be necessary to pay close attention to the integration of the ports into the OBOR initiative. Future research will focus on the more detailed analysis of the port competition and on suggestions of the infrastructure investment to the port and to the hinterland connectivity.
References
Cao, B.; Glover F. 2010. Creating balanced and connected clusters to improve service delivery routes in logistics planning, Journal of Systems Science and Systems
Engineering 19(4): 453-480.
EC. 2018. Transport in the European Union – Current trends
and issues. Available from internet: <https://ec.europa.
eu/transport/sites/transport/files/2018-transport-in-the-eu-current-trends-and-issues.pdf>.
EC. 2019. Analysis of the potential of the development of
rail container transport market in Poland. Available from
internet: <https://ec.europa.eu/regional_policy/ sources/docgener/studies/pdf/report_ pl_rail_ container_transport_en.pdf>.
Guerrero, D.; Rodrigue, J.-P. 2014. The waves of containerization: shifts in global maritime transportation, Journal of Transport Geography 34: 151-164.
Ince & Co. 2016. Shipping can’t afford to ignore China’s
OBOR policy. Available from internet: <https://
safety4sea.com/inceco-shipping-cant-afford-ignore-chinas-obor-policy/>.
International encyclopedia of human geography. 2009.
Thiessen Polygon. 231-236.
Jiang, B.; Li, J.; Gong, C. 2018. Maritime shipping and Export Trade on “Maritime Silk Road”, The Asian Journal
of Shipping and Logistics 34(2): 83-90.
Long, X.; Zhang, Y.; Chen, Y. 2011. Using Voronoi Diagram in construction the scope of logistics park hinterland: an engineering application, Systems
Engineering Procedia 2: 69-76.
Lu, H.; Rohr, C.; Hafner, M.; Knack, A. 2018. China Belt and Road Initiative: Measuring the impact of improving transport connectivity on international trade in the region – a proof-of-concept study. RAND Europe.
Mota, D. R.; Takano, M.; Gonzales Taco, P. W. 2014. A method using GIS Integrated Voronoi diagrams for commuter rail station identification: A case study from Brasilia (Brazil),
Procedia - Social and Behavioral Sciences 162: 477-486.
Oxera Agenda. 2011. No safe harbours: competition issues in
ports and port services. Available from internet: <https://
www.oxera.com/wp-content/uploads/2018/03/Ports-and-port-services_1.pdf>.
Pan, K.; Cao, Y.; Liang, S.; Wei, H. 2014. New tendency of Chinese container port system:1998-2010, GeoJournal
79(3): 373-384.
Peng, P.; Yang, Y.; Lu, F.; Cheng, S.; Mou, N.; Yang, R. 2018. Modelling the competitiveness of the ports along the Maritime Silk Road with big data, Transport Research
Part A 118: 852-867.
Psaraftis, H. N.; Kontovas, C. A. 2010. Balancing the economic and environmental performance of maritime transport, Transportation Research Part D: Transport and
Environment 15(8): 458–462.
Schinas, O.; von Westarp, A.G. 2017. Assessing the impact of the maritime silk road, Journal of Ocean
Shanghai International Shipping Institute. 2019. Available from internet: <http://en.sisi-smu.org/>.
U NCTA D. 2018. Review of Maritime Transport.
Available from internet: <https://unctad.org/en/ PublicationsLibrary/rmt2018_en.pdf>.
Wang, S.; Sun, L.; Rong, J.; Yang, Z. 2014. Transit traffic analysis zone delineating method based on Thiessen polygon, Sustainability 6(4): 1821-1832.
Zhou, H. et al. 2018. Investigating the impact of catchment areas of airports on estimating air travel demand: A case study of regional Western Australia,
Journal of Air Transport Management 70: 91-103.

![Fig. 2. Container Throughput of the Three Main Regions in the Period from 2000 to 2017 [in million TEU]](https://thumb-us.123doks.com/thumbv2/123dok_us/8691153.1735923/3.468.79.381.356.537/fig-container-throughput-main-regions-period-million-teu.webp)