M E T H O D O L O G Y A R T I C L E
Open Access
Contrasting groups
’
standard setting for
consequences analysis in validity studies:
reporting considerations
Morten Jørgensen
1,2,3, Lars Konge
1,2and Yousif Subhi
1,3*Abstract
Background:The contrasting groups’standard setting method is commonly used for consequences analysis in
validity studies for performance in medicine and surgery. The method identifies a pass/fail cut-off score, from which it is possible to determine false positives and false negatives based on observed numbers in each group. Since groups in validity studies are often small, e.g., due to a limited number of experts, these analyses are sensitive to outliers on the normal distribution curve.
Methods:We propose that these shortcomings can be addressed in a simple manner using the cumulative
distribution function.
Results:We demonstrate considerable absolute differences between the observed false positives/negatives and the
theoretical false positives/negatives. In addition, several important examples are given.
Conclusions:We propose that a better reporting strategy is to report theoretical false positives and false negatives together
with the observed false positives and negatives, and we have developed an Excel sheet to facilitate such calculations.
Trial registration:Not relevant.
Keywords:Medical education, Messick’s validity framework, Contrasting groups, Standard setting, False positives, False
negatives
Background
Historically, surgery was learned by practicing on patients. To some extent, this is still the practice today. Simulation training enables practice and learning on a simulator before treating patients. Pushing the trainees up the learning curve before operating on patients leads
to better outcomes [1]. There is an increasing number of
simulators available today to facilitate such a process. However, validity evidence behind well-intentioned simulation training programs and interventions are crucial to ensure training that is relevant to clinical prac-tice. Increasingly, efforts are made to provide such valid-ity evidence: number of publications with validvalid-ity
assessments of surgical simulators have increased to 70–
90 studies/year in years 2014–2016 from approximately
30 studies/year in years 2008–2010 [2].
In the contemporary validity framework by Samuel Mes-sick, validity of a construct is explored from five sources
[3]. One such source is the consequential validity, which
ex-plores the potential and actual consequences of a defined standard or a test. In our systematic review of current trends in validity studies, we found that consequential
val-idity was explored the least of the five sources [2]. Based on
such findings [4, 5], we think that attention needs to be
given to consequential validity to facilitate its use.
Surgical education is moving away from time-dependent learning to competency-based learning. Competency-based learning ensures certification of the trainees with satisfactory
levels of performance, skills, and knowledge [6]. An
import-ant issue in competency-based learning is the establishment of a competency standard that discriminates the trainees based on a defined level of competence. A standard is a
* Correspondence:[email protected] 1
Faculty of Health and Medical Sciences, University of Copenhagen, Copenhagen, Denmark
3Department of Ophthalmology, Zealand University Hospital, Vestermarksvej
23, DK-4000 Roskilde, Denmark
Full list of author information is available at the end of the article
score or a level of competency needed for a particular
pur-pose and a standard can be a score needed to pass a test [7].
There are several methods to set such standards. The standard for when a certain level of expertise is reached is set by identifying cut-off points on different measures of performance, which can be rating scores or simulator
metrics. One approach is the contrasting groups’method
that is a participant-based method where performance of a certain procedure is evaluated between participants of different expertise levels, e.g., novices and experts. In a study aimed at setting pass scores for surgical tasks using Objective Structured Assessment of Technical Skill, Montbrun et al. demonstrated that contrasting groups identify cut-off points at levels that are similar to those identified using other methods (i.e., borderline group and borderline regression) and provided evidence
of consistency across the different methods [6].
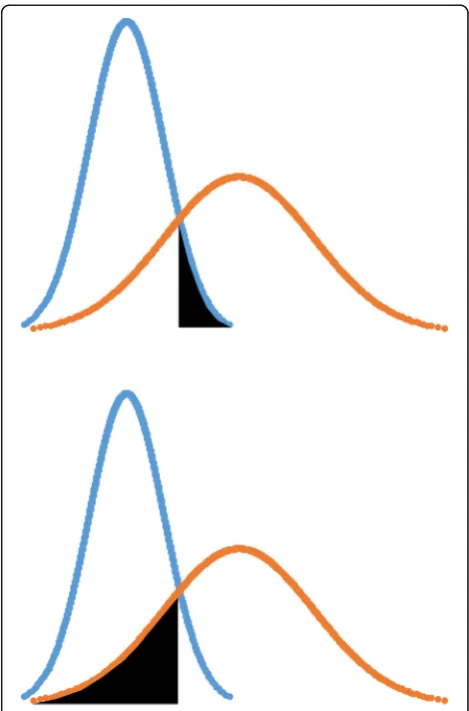
When using the contrasting groups’method, the cut-off
point is set by identifying the intercept of normally distrib-uted curves that represent the score distributions of the
groups defined by their level of expertise (Fig. 1). Since
many validity studies already include groups defined by expertise level, contrasting groups can be considered an easy and feasible method for standard setting in many val-idity studies. After a pass/fail score is defined, percentage of false positives and false negatives can be calculated to explore the consequences of the test.
If we consider a study with two groups defined by differ-ent levels of expertise, e.g., novices and experts; the false positives are defined as novices who score higher than the pass/fail score and pass the test, and the false negatives are defined as experts who score lower than the pass/fail score and fail the test. Traditionally, these false positives and false negatives are calculated based on the observed number of individuals who passes or fails a test.
Validity studies often include only a small number of participants, especially in the expert group due to
limited number of available experts [8]. When
perform-ing consequences analysis, these small numbers make the rate of false positives and false negatives particularly sensitive to outliers of the normal distribution curve, which may lead to unrepresentative percentages of false negatives and false positives. Observed false negatives and false positives are calculated using the actual numbers of experts who failed the test and novices who passed the test. This is different from what we call the theoretical false negatives and theoretical false positives, which can be calculated using the normally distributed curves that represent the score distributions of the
groups defined by their level of expertise (Fig.2). While
Fig. 1Illustration of the contrasting groups’method. Blue represents the novice group. Orange represents the experienced group. The black vertical line goes through the identified intercept of the curves, representing the pass/fail cut-off score
in theory, these observed and theoretical false negatives and false positives should lead to the same results, in practice, they may differ especially when studies are made on small group sizes.
In this paper, we discuss reporting considerations when using contrasting groups for standard setting. We demon-strate that the small number of participants in validity studies make consequential validity analyses very sensitive to outliers, which is a phenomenon with important impli-cations for how we collect and interpret validity evidence. We propose that theoretical false positives and false negatives should be reported in addition to observed false
positives and false negatives. Finally, to facilitate
consequential validity analyses in future validity studies, we have developed an Excel sheet which can determine the pass/fail score when group-specific descriptive statistics are given (mean, standard deviation, group size)
(Additional file 1). The Excel sheet can also calculate the
theoretical false positives and theoretical false negatives.
Methods
In a recent systematic review, Goldenberg et al. identi-fied studies for establishing absolute standards for
tech-nical performance in surgery [9]. We independently
extracted data from studies identified by Goldenberg et
al., which used contrasting groups’standard setting for a
consequences analysis. We calculated the observed false positives and false negatives where published data were available on the pass/fail cut-off score, the mean and standard deviation of each group, and the number of participants passing and failing in each group. For each group, we also calculated the theoretical false positive and theoretical false negative using the cumulative distri-bution function. The cumulative distridistri-bution of a
real-valued random variableX where the probability ofX
be-ing less than the value x can be described as the
following:
f Xð Þ ¼P Xð <xÞ
We constructed a score distribution of the novices using the extracted mean and standard deviation, and
used the probability of the random variable X being
more than the pass/fail cut-off score to calculate the
the-oretical false positives (Fig. 2). We constructed a score
distribution of the experts using the extracted mean and standard deviation, and used the probability of the
ran-dom variableX being less than the pass/fail cut-off score
to calculate the theoretical false negatives (Fig.2).
To ease the conduct and reporting of contrasting groups analyses, we developed an Excel sheet which is available as a supplementary material to this paper
(Additional file 1). Using group-specific mean, standard
deviation, and number of participants, the Excel sheet
automatically calculates a pass/fail cut-off as well as the-oretical false positives and thethe-oretical false negatives. The Excel sheet is also used for the examples provided in the results.
Results
None of the studies examined reported theoretical false positives and theoretical false negatives as defined in the
present paper [6,10–26]. The following interesting
exam-ples illustrate how small groups in validity studies make the observed false positives and observed false negatives sensitive to the outliers of the distribution curve.
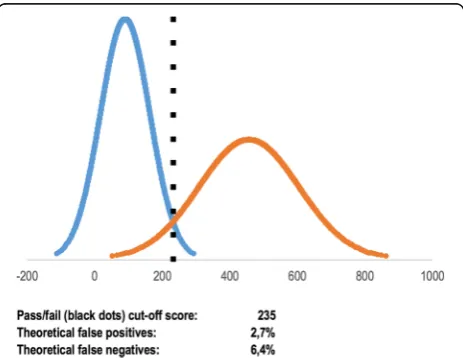
Nerup et al. explored validity of an automated assess-ment tool on 11 trainees in colonoscopy and 10
experi-enced endoscopists [17]. The two groups of participants
performed colonoscopy in two case scenarios on a realistic standardized model of the human colon. A pass/fail score
was established by using the contrasting groups’method.
In one of the cases explored, one trainee had a score higher than the established pass/fail score and passed the test (observed false positive rate 9.1%), whereas no experts failed (observed false negative rate 0.0%). Using the cumulative distribution function, we calculated that theor-etically 2.7% of the trainees should have passed the test
and 6.4% of the experts should have failed the test (Fig.3).
These numbers correspond to 0.3 participant in the trainee group and 0.6 participant in the expert group, demonstrating an example where the observed false positives/negatives are sensitive to outliers from the normal distribution curve due to the small number of participants.
In this case of an automated assessment tool on colonos-copy, the theoretical false positives and false negatives pro-vide important supplementary information on the quality of the test.
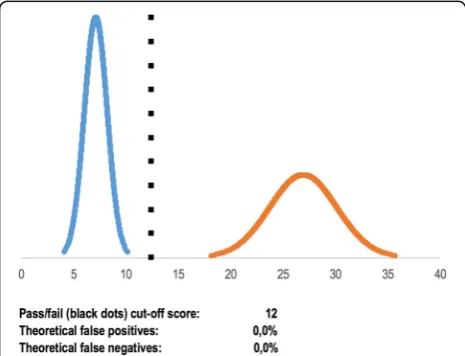
Preisler et al. explored validity of a virtual reality simu-lator test on 15 trainees and 10 experienced
endosco-pists [19]. The contrasting groups’ method was used to
establish a pass/fail score. One trainee obtained a score higher than the established pass/fail score and passed the test (observed false positive rate 6.7%), whereas one expert failed (observed false negative rate 10.0%). Again, using the cumulative distribution function, we calculated that theoretically 0.0% of the trainees should have passed the test and 0.0% of the experts should have failed the
test (Fig. 4). In this case, the outliers of the normal
distribution curve significantly affected the observed false positives and false negatives. This would not have been apparent without the information provided by the theoretical false positives and false negatives.
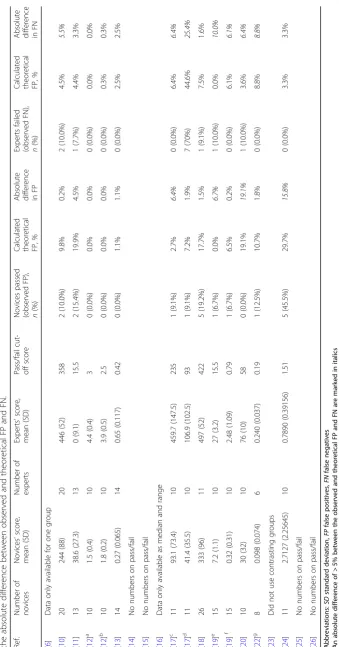
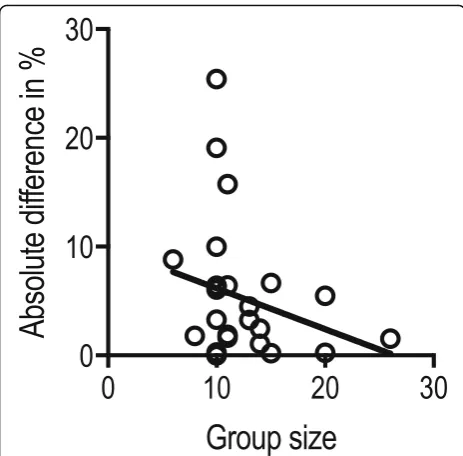
To illustrate this phenomenon on a larger scale, we ex-tracted pass/fail details from all studies identified by
Goldenberg et al. [9] and where it was possible to
perform such calculations(Table1). The absolute
differ-ence between the observed false positive/negative rate and the theoretical false positive/negative rate is
illus-trated in relation to the group size (Fig. 5). The figure
illustrates that larger group sizes decrease the absolute difference between the observed and theoretical false positives and false negatives and therefore makes the calculations of the observed false positives and false
negatives less sensitive to outliers of the distribution curve. This finding suggests that reporting theoretical false positives and negatives are especially important when the group sizes are small.
Discussion
The contrasting groups’standard setting method is
com-monly used for consequences analysis in small-sized val-idity studies. Here, we demonstrate that the observed false positives and observed false negatives are very sen-sitive to small samples and outliers. We argue that the-oretical false positives and thethe-oretical false negatives should be provided in addition to the observed false pos-itives and observed false negatives. However, it should be noted that the theoretical false positives and theoret-ical false negatives are based on mean and standard de-viation of the same small samples; hence, it cannot solve a problem of small samples in a study, but may provide an important addition to considerations on false posi-tives and false negaposi-tives in consequences analyses.
The passing score can be moved from the intersection point between the two normal distributed curves if there is a greater concern of either passing non-competent
participants or failing competent participants [7]. When
having such considerations, information of both
observed and theoretical false positives and false nega-tives should be considered. These considerations are essential when setting standards and can be used actively to set a pass/fail score that fits with the rate of false positives and false negatives. One limitation of this paper is that we have not described details of cases where it may be relevant to move the passing score from the intersection point to address other needs, e.g., if a certain level of sensitivity or specificity is of interest. Such cases may benefit from receiver operator
curve-based analyses [26,27].
The differences between the observed and the theoret-ical false positives and false negatives should be reduced as the group samples are increased. In studies with large groups, the value of providing theoretical false positives and false negatives in addition may be limited since the distribution more closely will resemble the normal curve and the differences between observed and theoretical false positives and false negatives would be small. However, providing theoretical false positives and false negatives may still be relevant to underline the conclu-sions of such studies.
Using the contrasting groups’ method requires two
groups defined by clear differences in expertise, i.e., novices who are not supposed to pass the test and expe-rienced individuals who a priori should all pass the test. Collecting a sizeable group of non-competent per-formers can be a challenge, especially in a clinical envir-onment where obvious ethical reasons do not allow
complete novices to practice on patients. For example, in the Montbrun et al. study of technical performance by surgical trainees, the authors were unable to use cal-culations based on contrasting groups in some cases because of too few individuals in the novice/incompetent
group [6]. In such cases, borderline-based methods are
more feasible, but this method often requires big sample
sizes before ‘enough’ trainees are judged as borderline.
One can also argue that identifying groups at the border of passing can be a challenging endeavor, e.g., a judge that is unfamiliar with the technique is more likely to judge a participant as a borderline which introduces an
assessor bias [9]. Therefore, using contrasting groups
can be more feasible in some cases and especially in simulation-based studies where it is safe and ethically sound to let a novice group perform procedures without supervisor interference. It is important to remember that there are no general rule to which method to use, instead the most appropriate method may differ from one study to another based on the purpose of the
indi-vidual study [9].
Conclusion
Based on the considerations made in this paper, we recommend reporting theoretical false positives and theoretical false negatives in addition to the observed false positives and observed false negatives in the conse-quences analyses of validity studies on standard settings
using the contrasting groups’ method. This approach
may strengthen the consequences analyses, especially
when group sizes are small. To facilitate this, we have developed an Excel sheet to ease the conduction and reporting of contrasting groups analyses, which is
avail-able as a supplementary material to this paper
(Additional file1).
Additional file
Additional file 1:Excel file to ease conduction and reporting of contrasting groups analyses. (XLSX 234 kb)
Acknowledgements None.
Funding
The authors received no financial support for the research, authorship, and/ or publication of this article.
Availability of data and materials
All data generated or analyzed during this study are included in this published article and its Additional file1.
Authors’contributions
YS and LK conceptualized the idea. MJ and YS analyzed and interpreted the data and prepared the manuscript. MJ and YS drafted the manuscript. All authors critically revised the manuscript for important intellectual content. All authors approved the final manuscript.
Ethics approval and consent to participate Not applicable.
Consent for publication Not applicable.
Competing interests
The authors declare that they have no competing interests.
Publisher’s Note
Springer Nature remains neutral with regard to jurisdictional claims in published maps and institutional affiliations.
Author details
1Faculty of Health and Medical Sciences, University of Copenhagen,
Copenhagen, Denmark.2Copenhagen Academy for Medical Education and
Simulation, Capital Region of Denmark, Copenhagen, Denmark.3Department
of Ophthalmology, Zealand University Hospital, Vestermarksvej 23, DK-4000 Roskilde, Denmark.
Received: 25 October 2017 Accepted: 15 February 2018
References
1. Thomsen AS, Bach-Holm D, Kjærbo H, Højgaard-Olsen K, Subhi Y, Saleh GM, et al. Operating room performance improves after proficiency-based virtual reality cataract surgery training. Ophthalmology. 2017;124:524–31. 2. Borgersen NJ, Naur TMH, Sørensen SMD, Bjerrum F, Konge L, Subhi Y, et al.
Gathering validity evidence for surgical simulation: a systematic review. Ann Surg 2018 4.https://doi.org/10.1097/SLA.0000000000002652.
3. Ghaderi I, Manji F, Park YS, Juul D, Ott M, Harris I, et al. Technical skills assessment toolbox: a review using the unitary framework of validity. Ann Surg. 2015;261:251–62.
4. Cook DA, Brydges R, Zendejas B, Hamstra SJ, Hatala R. Technology-enhanced simulation to assess health professionals: a systematic review of validity evidence, research methods, and reporting quality. Acad Med. 2013;88(6):872–83.
5. Cook DA, Zendejas B, Hamstra SJ, Hatala R, Brydges R. What counts as validity evidence? Examples and prevalence in a systematic review of simulation-based assessment. Adv Health Sci Educ Theory Pract. 2014;19(2):233–50. 6. de Montbrun S, Satterthwaite L, Grantcharov TP. Setting pass scores for
assessment of technical performance by surgical trainees. Br J Surg. 2015;103:300–6.
7. Yudkowsky R, Downing SM, Tekiam A. Standard Setting. In: Downing SM, Yudkowsky R, editors. Assessment in Health Professions Education. New York (NY): Routledge; 2009. p. 119–48.
8. Thomsen AS, Subhi Y, Kiilgaard JF, la Cour M, Konge L. Update on simulation-based surgical training and assessment in ophthalmology: a systematic review. Ophthalmology. 2015;122:1111–30.
9. Goldenberg MG, Garbens A, Szasz P, Hauer T, Grantcharov TP. Systematic review to establish absolute standards for technical performance in surgery. Br J Surg. 2017;104:13–21.
10. Thinggaard E, Bjerrum F, Strandbygaard J, Gögenur I, Konge L. Validity of a cross-specialty test in basic laparoscopic techniques (TABLT). Br J Surg. 2015;102:1106–13.
11. Jacobsen ME, Andersen MJ, Hansen CO, Konge L. Testing basic competency in knee arthroscopy using a virtual reality simulator: exploring validity and reliability. J Bone Joint Surg. 2015;97:775–81.
12. Tolsgaard MG, Ringsted C, Dreisler E, Klemmensen A, Loft A, Sorensen JL, et al. Reliable and valid assessment of ultrasound operator competence in obstetrics and gynecology. Ultrasound Obstet Gynecol. 2014;43:437–43. 13. Konge L, Clementsen P, Larsen KR, Arendrup H, Buchwald C, Ringsted C.
Establishing pass/fail criteria for bronchoscopy performance. Respiration. 2012;83:140–6.
14. Beard JD. Education and Training Committee of the Vascular Society of Great Britain and Ireland. Setting standards for the assessment of operative competence. Eur J Vasc Endovasc Surg. 2005;30:215–8.
15. Diwadkar GB, van den Bogert A, Barber MD, Jelovsek JE. Assessing vaginal surgical skills using video motion analysis. Obstet Gynecol. 2009;114:244–51. 16. King CR, Donnellan N, Guido R, Ecker A, Althouse AD, Mansuria S.
Development and validation of a laparoscopic simulation model for suturing the vaginal cuff. Obstet Gynecol. 2015;126:27–35.
17. Nerup N, Preisler L, Svendsen MB, Svendsen LB, Konge L. Assessment of colonoscopy by use of magnetic endoscopic imaging: design and validation of an automated tool. Gastrointest Endosc. 2015;81:548–54. 18. Thomsen ASS, Kiilgaard JF, Kjaerbo H, la Cour M, Konge L. Simulation-based
certification for cataract surgery. Acta Ophthalmol. 2015;93:416–21. 19. Preisler L, Svendsen MB, Nerup N, Svendsen LB, Konge L. Simulation-based
training for colonoscopy. Medicine. 2015;94:440–8.
20. Pedersen P, Palm H, Ringsted C, Konge L. Virtual-reality simulation to assess performance in hip fracture surgery. Acta Orthop. 2014;85:403–7. 21. Konge L, Annema J, Clementsen P, Minddal V, Vilmann P, Ringsted C. Using
virtual-reality simulation to assess performance in endobronchial ultrasound. Respiration. 2013;86:59–65.
22. Vassiliou MC, Dunkin BJ, Fried GM, Mellinger JD, Trus T, Kaneva P, et al. Fundamentals of endoscopic surgery: creation and validation of the hands-on test. Surg Endosc. 2013;28:704–11.
23. Svendsen MB. Using motion capture to assess colonoscopy experience level. World J Gastrointest Endosc. 2014;6:193–8.
24. Sedlack RE. Training to competency in colonoscopy: assessing and defining competency standards. Gastrointest Endosc. 2011;74:355–66.
25. Sedlack RE, Coyle WJ. Assessment of competency in endoscopy: establishing and validating generalizable competency benchmarks for colonoscopy. Gastrointest Endosc. 2016;83:516–23.
26. McCluney AL, Vassiliou MC, Kaneva PA, Cao J, Stanbridge DD, Feldman LS, Fried GM. FLS simulator performance predicts intraoperative laparoscopic skill. Surg Endosc. 2007;21(11):1991–5.
27. Fraser SA, Klassen DR, Feldman LS, Ghitulescu GA, Stanbridge D, Fried GM. Evaluating laparoscopic skills: setting the pass/fail score for the MISTELS system. Surg Endosc. 2003;17(6):964–7.
• We accept pre-submission inquiries
• Our selector tool helps you to find the most relevant journal
• We provide round the clock customer support
• Convenient online submission
• Thorough peer review
• Inclusion in PubMed and all major indexing services
• Maximum visibility for your research
Submit your manuscript at www.biomedcentral.com/submit