R E S E A R C H
Open Access
Nutritional quality modulates trait
variability
Adrian Brückner
1,2*, Romina Schuster
1, Katja Wehner
1and Michael Heethoff
1*Abstract
Background:Trait based functional and community ecology isen vogue. Most studies, however, ignore phenotypical diversity by characterizing entire species considering only trait means rather than their variability. Phenotypical variability may arise from genotypical differences or from ecological factors (e.g., nutritionally
imbalanced diet), and these causes can usually not be separated in natural populations. We used a single genotype
from a parthenogenetic model system (the oribatid miteArchegozetes longisetosusAoki) to exclude genotypical
differences. We investigated patterns of dietary (10 different food treatments) induced trait variation by measuring the response of nine different traits (relating to life history, morphology or exocrine gland chemistry).
Results:Nutritional quality (approximated by carbon-to-nitrogen ratios) influenced all trait means and their
variation. Some traits were more prone to variation than others. Furthermore, the“threshold elemental ratio”- rule
of element stoichiometry applied to phenotypic trait variation. Imbalanced food (i.e. food not able to fully meet the nutritional demands of an animal) led to lower trait mean values, but also to a higher variation of traits.
Conclusion:Imbalanced food led not only to lower trait value averages, but also to higher trait variability. There was a negative relationship between both parameters, indicating a direct link of both, average trait levels and trait variation to nutritional quality. Hence, variation of trait means may be a predictor for general food quality, and further indicate trade-offs in specific traits an animal must deal with while feeding on imbalanced diets.
Keywords:Trait plasticity, Functional traits, Parthenogenesis, Nutritional ecology, Nutritional balance, Threshold
elemental ratio, Oribatid mites,Archegozetes longisetosus
Background
The theory of phenotypic plasticity predicts that virtually all biological systems inherently include variation of characters at all organization levels [1–3]. This variation can be induced by virtually any external factor, leading to a nearly infinite number of possible phenotypic speci-ficities [4, 5]. Phenotypic plasticity can therefore be de-fined as the degree of a single genotype to express variation in multiple traits leading to different pheno-types in response to environmental gradients [3,6]. Trait based approaches areen voguein all fields of ecology [7, 8], and it has been assumed that trait means of a species can be used to sufficiently characterize communities and affiliated functionality [9, 10]. Natural populations,
however, consists of phenotypically diverse individuals, possessing variable traits [3, 11, 12]. Furthermore, trait variability of individuals within populations is essential for evolutionary processes via natural selection, as the latter acts on the individuals’phenotypes influenced by a given ecological setting [1, 6, 11]. That is why under-standing causes and mechanism leading to such trait variation of individuals can give unprecedented reso-lution to explain evoreso-lutionary ecology dynamics under-pinning community structure, trait assemblages, and stability (e.g., [11,13,14]).
Theory [15], but also some experimental evidence (e.g., [16, 17]) suggest that phenotypic plasticity may arises from trade-offs among multiple traits within a species that are ultimately caused by imbalances in elemental stoichiometry or nutritional components of food. For instance, nutrients influence fitness related traits (e.g., [18–21]), but also body shapes [22], or intra-specific chemical communication (e.g. [23]) of an
* Correspondence:[email protected]; [email protected]
1Ecological Networks, Technische Universität Darmstadt, Schnittspahnstraße 3, 64287 Darmstadt, Germany
Full list of author information is available at the end of the article
© The Author(s). 2018Open AccessThis article is distributed under the terms of the Creative Commons Attribution 4.0
International License (http://creativecommons.org/licenses/by/4.0/), which permits unrestricted use, distribution, and
animal, and may even alter biological rules [24]. In this context, a resource can be considered optimal if i) it en-ables an animal to respond with the highest possible trait mean (= balanced diet hypothesis; [25]), but also ii) can sustain phenotypes with low trait variability and thus a stable performance (see [18, 20, 26]). For instance, two recent meta-analyses suggest that mixed-, rather than single-food diets result in significantly higher average fit-ness [27] and reduce intraspecific variance in fitfit-ness [28], because mixed foods are more likely to represent an optimal, balanced diet close to an animals intake tar-get [25]. Bunning et al. [29] as well as Han & Dinge-manse [30] tested these hypotheses in the context of reproductive performance and behavioral stability, re-spectively, and found that optimal dietary choice indeed led to an improved average expression and a reduced variance of their selected traits. Still, reaction norms of only a relatively limited number of traits towards a broad gradient of macronutrients [20] or elements [31] have been tested for a few species and the relationship of means, variation and elemental balance across multiple traits of different types (e.g. adaptive defense, morpho-logical or reproductive traits) has, to our best know-ledge, not been investigated in a single species under genotypic control.
Here, we harness the power of a unique model system – the all-female parthenogenetic and mono-genotypic oribatid mite Archegozetes longisetosus ran lineage, which reproduces via automixis with an inverted meiosis resulting in clonal offspring [32, 33]. While heritable genetic variation of traits cannot clearly be distinguished from environmentally induced trait variation (pheno-typic plasticity) in sexual species, clonal systems provide the possibility to quantify reaction norms of traits and their variation (e.g., [34–37]). We selected a variety of different individual and demographic life-history, mor-phological and defensive traits to quantify their response to food with different nutritional quality. We fed ten semi-natural resources, differing in C/N ratios, to the mites (all are descendants from a single mother and share an identical genotype), and measured the mean and variation of traits along this food quality gradient. Thus, we exploit our “phenotypically-tractable” model species (i.e. a model system without genotypic, but only phenotypic variation), to decipher patterns and mecha-nisms of dietary induced trait plasticity. More specifically we ask how nutritional quality (approximated by C/N ra-tios) influences the expression of multiple traits regard-ing i) trait means, ii) trait variation, and iii) differences among traits.
Based on recent meta-analyses [27,28] about the effect of diet mixing, we expect similar patterns for the semi-natural single diets; mites which fed on resources with a balanced C/N-ratio (defined as a ratio equal or
close to the mites’stoichiometrical demands) should ex-press a higher average and a lower variance across mul-tiple traits. As no intake target (i.e. species specific optimal elemental/nutritional composition of food) is known for any mite species or soil decomposer it is not possible to predict an optimal C/N intake ratio. How-ever, even the effects of single diets on our phenotypic-ally tractable model species should be strong, as the clonal reproduction eliminates genotypic variation. Hence, we also expect to find a direct negative relation-ship of the expressed means and variances of traits across resources, which would further support the bal-anced diet hypothesis [20,25].
Materials and methods
Experimental setup and trait selection
Archegozetes longesitosusran [32] were reared at approx.
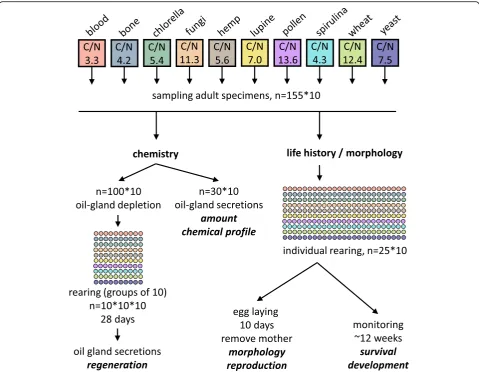
28 °C and 80–85% relative humidity in constant darkness on one out of ten resources for several generations (approx. 18 month, corresponding to seven to twelve generations depending on the food). All specimens of this strain are genotypically identical [32]. The ten re-sources (all applied as dried powders) were blood meal (blood; Common Baits, Rosenfeld, Germany), bone meal (bone; Canina Pharma GmbH, Hamm, Germany), Spiru-lina powder (spirulina; Interaquaristik, Biedenkopf-Brei-denstein, Germany), shiitake fungus powder (fungi;
Arche Naturprodukte GmbH, Hilden, Germany),
grinded dry yeast (yeast; Rapunzel Naturkost GmbH, Legau, Germany), Chlorella powder (chlorella; Naturya, Bath, UK), hemp protein powder (hemp; Naturya, Bath, UK), sweet lupine flour (lupine; Govinda Natur GmbH,
Neuhofen, Germany), grinded mixed pollen grain
(pollen; Ascopharm GmbH, Wernigerode, Germany) and wheat grass powder (wheat; Naturya, Bath, UK). A detailed list of macro-elemental and nutritional compos-ition can be found in the Addcompos-itional file 1. Food and water were provided ad libitum three times a week. For each resource, specimens were cultured in three sepa-rated plastic boxes (100x100x50 mm) grounded with 2 cm mixture of plaster of Paris/activated charcoal mix-ture (9:1).
conceptual way of living that reduces or eliminate a spe-cies’vulnerability against predators [43].
At the start of the experiment we selected young (ap-proximately one week after eclosing) adult individuals from their original culture-plates. We directly used 130 specimens per resource (= 1300 in total) for chemical experiments, while 25 specimens per resource (= 250 in total) were individually redistributed into smaller culture boxes (45 × 40 × 35 mm; grounded with the plaster of Paris mixture) for further experiments.
Chemical experiments and analysis
Oil-gland extractions of 30 specimens from each of the resources (n= 10*30) were accomplished by immersing individuals in 50μl hexane (GC grade, 98% purity pur-chased from Merck, Darmstadt, Germany) for 3 min (see Fig. 1). The extraction solvent also contained tetrade-cane (1 ng/μl; ≥99.8%, analytical standard, purchased
from Sigma-Aldrich, Munich, Germany) as an internal
standard. Crude extracts were used for gas
details see [44]), and were assigned using their retention indices and diagnostic ions.
Additionally, 100 specimens per resource were chemically disarmed using an established hexane -recovery-hexane (HRH) protocol which does not in-fluence the mites’ life-history, but results in the complete depletion of the glands ([38]; see Fig. 1). Mites were redistributed to culture plates (n= 10 plates per resource, with 10 individuals per plate resulting in 100 samples) and fed with the same re-sources mentioned above. After 28 days, specimens were individually extracted in hexane to measure the
proportion of specimens that had regenerated
oil-gland secretions (see [45]; Table1).
Life history experiments
Individual mites (= mothers, n = 10*25) could lay eggs for ten days and the same food and water was provided ad libitum three times a week (see Fig.1). Every box was checked daily, and we counted the number of eggs, ju-venile instars (i.e. larva, protonymph, deutonymph, trito-nymph) and adults for a period of up to 12 weeks. We removed freshly hatched adults from the culture plates to ensure no new egg deposition and froze them for fur-ther analysis. The total developmental time [days] for each mother’s offspring was calculated as weighted arith-metic mean (developmental time =∑[di*pi]; where diis
the experiment day and piis the proportion of new adult
specimens on di). Replicates where all offspring died
Table 1Overview of the nine selected traits ofArchegozetes longisetosusmeasured in this study, as well as a definition of each
character and general descriptions of these traits in a general ecological context
Trait definition (this study) Trait description References
Chemistry
Amount Amount of defensive secretions of one individual, standardized by its dry weight (ng/μg)
In reservoir based chemical defense the amount is a primary factor to predict how often an animal is able to defend itself against predators and competitors
[66,67]
Composition Relative composition (%) of the defensive secretion of one individual
The composition of a defensive chemical blend can determine its effectivity against predators, but can also be a consequence of physiological changes/stress of an individual
[66,68,69]
Regeneration Percentage of individuals (%) per group (n= 10) which regenerated their defensive secretions over time
The regeneration of defensive secretion is essential to be defended against predators at all, but also to understand the costs of secretion regeneration
[45,70,71]
Life-history
Developmental time Weighted arithmetic mean of developmental time of one females’ offspring
The first three life-history parameters (developmental time, survival and number of offspring) describe the reproductive fitness
[20,35,72]
Survival Percentage (%) of surviving offspring of one female based on the counted number of laid eggs and newly enclosed adults
Offspring Counted number of surviving offspring of one female
Output Dry weight of one females’entire offspring The biomass output may also describe the fitness, but also quantifies the ability of a mother to translocate biomass from the resource to her offspring
[73,74]
Morphology
Body mass Dry weight of the initially used females (mothers)
Body mass is a universal predictor of many ecological processes (e.g., metabolism, abundance, or predation)
[75–77]
Morphometry Eleven morphometric characters of the initially used females (for details see Additional file2)
The shape of an individual plays an important role in basic physiological processes, but also influences predation (by altered handling approaches by predators) and may be used to predict other characters
before reaching adulthood were not used to calculate the developmental time (n= 72). In addition to the counted data (see Table1) we dried all individuals at 60 ° C to determine the total biomass output of individual mothers, expressed as dry weight [mg] per female.
Morphological analysis
The removed mothers from the life-history experiments were used for morphological analysis (see Fig.1, Table1), except for damaged individuals that were excluded from the measurements. We overall measured eleven continu-ous variables of individual specimen (five dorsal and six ventral distances) for the morphometric analysis (see Add-itional file 2 for details) using a VHX-5000 microscope (Keyence Deutschland GmbH, Neu-Isenburg, Germany) equipped with the VH-Z50L lens. To remove the effect of isometric body size scaling on morphometrical measures we standardized all values of one individual by its notoga-ster length (see Additional file 2). Afterwards, all speci-mens (mothers) were dried at 60 °C and the individual body mass, expressed as dry weight [μg] was determined as described above.
Analyses of nutritional quality
For C/N analyses dried resource powders (5 ± 1 mg) were weighed into tin capsules. Total organic carbon and nitrogen contents were measured by an elemental analyzer (EA 1108 Elemental Analyser, Carlo Erba, Milan, Italy). Acetanilide (Merck, Darmstadt, Germany) was used as standard. Carbon and nitrogen amounts were calculated based on the standard and the initial dry weight and expressed as C/N ratios (Table2).
Data analysis
We analyzed the univariate traits (see Table 1) using Kruskal-Wallis tests and Levene tests to access the
overall differences and the variance among resources, re-spectively. Scatter plots showing all data points and indi-vidual posthoc comparisons (Dunn’s test [46] and false discovery rate [47] to correct for multiple tests as imple-mented in “PMCMR”) for each trait-resource combin-ation can be found in the Additional files 3 and 4. For
multivariate traits [=chemical composition (as
Bray-Curtis similarities) and morphometric measures (as Euclidean distances)] we also analyzed the differences and variances among resources using PERMANOVA [48] and PERMDISP [48], respectively as implemented in“vegan”. Both multivariate traits were ordinated using discriminant analysis of principal components (DAPC; see [49]) using the package “adgenet”. DAPC transforms the original data by principal component analysis (PCA) prior to the discriminant analysis. We retained 6 (for
chemical composition) and 7 (for morphometry)
PC-axes based on their Eigenvalues (> 1) and the ex-plained variance (total cumulative variance > 95%).
To statistically access the optimality response of a cer-tain trait to the resource quality parameter (i.e., C/N-ra-tio) we fitted a non-linear regression model (t’~ C/N + C/N2; where t’ is a given trait value), using the lm-function in R Priorto this statistical analysis we had to adjust our data in several ways: first we transformed the trait data (see results section) to ensure the normal-ity of residuals of every regression and to break potential mean-variance relationships; secondly, we rescaled all the transformed trait values between 0 and 1 using the minimum-maximum normalization (eq. 1)
1
ð Þt0¼ t−tmin
tmax−tmin
wheret is any transformed trait value,tmin and tmax are the lowest or highest expression level of a given trait, re-spectively and t’ is the min-max normalized trait value. The rescaling was necessary to plot all the optima curves simultaneously and elucidate potential trade-offs among the trait-resource combinations.
To quantify the trait (Table1) variation for all ten re-source treatments and every trait we calculated ln CV (coefficient of variation) according to Nakagawa et al. [50] using eq. (2)
2
ð Þ lnCV ¼ lnσ− lnxþ 1 2ðn−1Þ
where x is the sample mean,σis the standard deviation and n is the sample size, yielding nine different trait ln CVs for each resource. To summarize the multivariate traits (chemical composition and morphometry) we first calculated the ln CVs for each single component and subsequently averaged the single ln CVs to obtain the mean ln CV for both traits. We used a Kruskal-Wallis
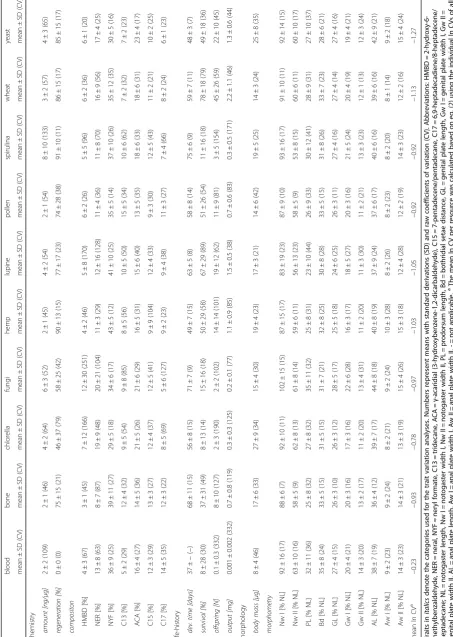
Table 2Carbon to nitrogen ratios (mean ± standard deviation;
n= 3 replications) of the ten food resources sorted by C/N-ratio, beginning with the lowest (= highest nitrogen content)
C/N
mean ± SD
blood 3.3 ± 0.017
bone 4.2 ± 0.042
spirulina 4.3 ± 0.003
chlorella 5.4 ± 0.023
hemp 5.6 ± 0.048
lupine 7.0 ± 0.033
yeast 7.5 ± 0.027
fungi 11.3 ± 0.005
wheat 12.4 ± 0.042
test to check whether the nine trait ln CVs across all re-sources are prone to more/less variation compared to others and if trait types (chemical, life history, morph-ology) possess different variability using the mean across resource ln CVs. We further analyzed the mean trait variation across traits to test whether some resources produce more variable traits than others and if the vari-ation of trait varivari-ation differs across resources using a Kruskal-Wallis and Levene test, respectively. Afterwards, we used these values to calculate the mean ln CV for each resource (see last row of Table3), to eventually test for optimality of C/N-ratios using a non-linear regres-sion model (using the package “Rcmdr”). Additionally, we used the same analysis to test the influence of the C/ N-ratios on the ln CVs of the nine individual traits. Fi-nally, we accessed the relationship of mean and variance of the different traits across all resources by using the mean normalized trait value t’meanand the ln CV of the univariate traits (because multivariate traits do not have a mean t’). Because the different traits within one re-source treatment are not independent from each other we used a linear mixed effect model (LMM) with trait variation as dependent, trait mean as independent and resource treatment as random variable using the R pack-ages “lme4” and “car”. The model was checked for nor-mality of residuals and variance homogeneity, and no further transformation was necessary.
The following replicates were not included in the stat-istical analyses: chemical samples with contaminations for secretion amounts (n= 14 of 300); mothers which did not survive the egg laying period for life history data (n= 34 of 250); total biomass output lower than 1μg (not reliably measurable, n= 8 of 250); non intact mothers from mass measurement (n = 8 of 250); dam-aged specimen for morphometric measures (n= 47 of 250). The raw data is deposited in Additional file4. All statistical analyses were performed with R 3.3.2 [51], using the packages “adegenet” [49], “car” [52], “lme4” [53],“PMCMR”[54],“vegan”[55], and“Rcmdr”[56].
Results
Nutritional quality
Some food resources were characterized by an extreme composition –e.g. blood meal had a very high C/N ra-tio, which corresponds to a high nitrogen content (13.3 ± 0.1% N; mean ± SD), while pollen was nitrogen poor, but comparatively carbon rich (3.6 ± 0.1% N; mean ± SD). Yet, most of the remaining resources had a quite equilibrated stoichiometry (Table2). Thus, the variability of the C/N ratios across the food was high (CV = 47%; 7.5 ± 3.5; mean ± SD), and the spanned from 3.3 (blood meal) to 13.6 (pollen). While we focused our analyses on C/N ratios only, the foods also differed in other nutri-tional dimensions (i.e. elements and macronutrients; see
Additional file 1), but their influence is beyond this study.
Chemical traits
Three traits were related to chemical defense (Table 1). The individual amount of defensive secretions (ng/μg; Kruskal-Wallis: n= 286, df = 9, χ2= 62.74, p< 0.0001; Table 3; Additional file3) and its variation within each group (Levene: F9,276= 11.25, p< 0.0001; Table 3)
dif-fered across all resources. The fraction of regenerating individuals (%; Kruskal-Wallis: N= 100, df = 9, χ 2= 42.97, P< 0.0001; Table 3; Additional file 3) and their variation within each group (Levene: F9,90= 2.99, P=
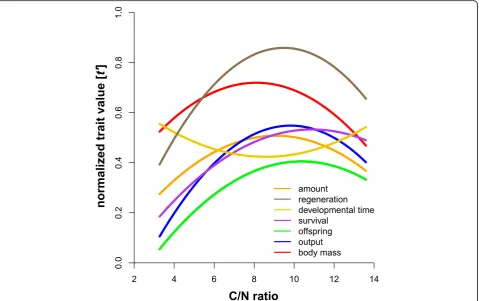
0.004; Table3) differed across all resources. Both univar-iate chemical traits, the individual secretion amount (F2,283= 16.84, r2= 0.11) and fraction of regenerating
in-dividuals (F2,97= 11.01, r2= 0.19) showed C/N optima
curves (Fig.2; for detailed statistics of linear and nonlin-ear effect estimates see Table4). Also, the relative com-position (%; Fig. 3a; Table 3) of the seven compounds found in the defensive secretions showed differences among groups (PERMANOVA: pseudo-F9,276= 14.01, r2
= 0.31, p< 0.0001) as well as in multivariate dispersion (=variation; PERMDISP: F9,276= 3.91, p< 0.001; see
el-lipsoid sizes in Fig.3a) and showed a significant nonlin-ear response to food C/N-ratios (Table4).
Life-history traits
In total, we investigated four life-history traits, related to reproductive fitness and resource allocation (Table 1). The developmental time of each females’ offspring, cal-culated as weighted mean (days; Kruskal-Wallis:n= 172, df = 8,χ2= 100.54,p< 0.0001; Table3; Additional file3) and its variation within each group (Levene: F8,163= 3.22,
p= 0.002; Table 3) differed across all resources. Blood meal was excluded from the analysis, because only one individual developed from egg to adult. While stock cul-tures with blood meal are stable, individual rearing seemed problematic. The survival of each females’ off-spring (%; n= 216, df = 9,χ2= 112.47,p< 0.0001; Table 3; Additional file 3) and its variation within each group (Levene: F9,206= 4.02, p < 0.0001; Table3) differed across
all resources. The total number of offspring per female (N*female−1; Kruskal-Wallis: n = 216, df = 9, χ 2 = 134.80, p < 0.0001; Table 3; Additional file 3) and its variation within each group (Levene: F9,206= 7.97, p
< 0.0001; Table 3) differed significantly across all re-sources. The reproductive output per female (mg*fe-male−1; Kruskal-Wallis: n= 208, df = 9, χ 2= 125.19, p < 0.0001; Table 3; Additional file 3) and its variation within each group (Levene: F9,198= 5.04, p< 0.0001;
3.44,r2= 0.04; survival of one females’offspring: F2,213=
16.27, r2= 0.13; total number of offspring per female: F2,213= 25.79, r2= 0.20; reproductive output per female:
F2,205= 28.74,r2= 0.22).
Morphological traits
Body mass and various morphometric measurements de-scribing body shape were included (Table1, Fig.4). The individual body masses (μg; Kruskal-Wallis: n = 208, df = 9, χ2= 89.06, p < 0.0001; Table 3) and their variation within each group (Levene: F9,198= 2.60, p= 0.007; Table
3) differed across all resources and again followed a C/N optimum (Fig. 2; Table 4; F2,205= 30.92, r2= 0.23). The
eleven morphometric characters (% NL; Table 3; see Additional file 1 for character overview) measured for individual mites showed moderate, yet differences among groups (PERMANOVA: pseudo-F9,192= 2.36, r2
= 0.10, p= 0.003; Fig. 3b), but no differences in multi-variate dispersion (=variation; F9,192= 1.51, p= 0.147;
compare ellipse sizes in Fig. 2b) and no nonlinear re-sponse to food C/N-ratios (Table4).
Trait variation
All traits (Table 1) were influenced by diet (Figs.2 and 3; Table 3) and varied across all resources (for untrans-formed CVs [%] see Table 3). Also, ln CVs of the traits (Table 1) differed (Kruskal-Wallis: n= 89, df = 8, χ 2= 59.92, p < 0.0001; Fig.4a). Generally, the variability was the same among the trait types (Kruskal-Wallis:n= 9, df = 2, χ 2= 1.75, p= 0.41). Life-history traits had a ln CVmean=−0.78 (ln CVs for dev. time, survival, offspring
and output were−2.15, −0.95, 0.08 and−0.08, respect-ively), chemical traits responded with a ln CVmean=−
0.86 (ln CVs for amount, composition and regeneration were−0.44, −1.22 and−0.93, respectively) and the mor-phological traits showed a ln CVmean=−1.40 (ln CVs for
body mass and morphometry were−1.17 and−1.63, re-spectively) across all ten feeding treatments. There were no differences among mean trait variations across Fig. 2The effect of the elemental composition of the food (C/N-ratios) on the mean expression value of multiple univariate traits of the
resources (Kruskal-Wallis: n = 89, df = 9, χ 2= 5.28, p = 0.81; Fig. 4b), also the variance of trait variation was not heteroscedastic among resources (Levene: F9,79= 1.64, p= 0.21). We also tested whether the
mean total variation of one resource (across all traits) is related to the C/N ratio of the food (Table 2) and found that trait variation responded to the C/N-ratio of the food as an optimum curve (r2
= 0.54, F2,7=
6.36, p= 0.027: Fig. 5). For the individual traits’ ln CVs, however, only the number of offspring and the biomass output per female responded optimally (r2
= 0.71, F2,7= 8.63, p= 0.013 and r2= 0.83, F2,7= 16.45, p
= 0.002, respectively), while the traits showed no optimum related to C/N-ratios (all p> 0.15). Eventu-ally, there was a negative relationship of mean and the variance of the different univariate traits (Fig. 6; LMM: F1,59= 10.89, p = 0.002).
Discussion
Dietary induced intraspecific reaction norms and vari-ation are a mostly neglected topic in evolutionary ecol-ogy [2, 34]. Over 100 years ago, Woltereck [34] started to discuss underlying mechanisms, but also noted that it is hardly possible to quantify the range of a species’ vari-ability caused by nutritional quality, because even in pure linages of facultative parthenogenetic species, like Daphnia, a full control of the genotype is not possible. He also suggested that an obligate asexual species would be a perfect model to study nutritional reaction norms of traits and their plasticity. That is why parthenogenetic generalists (like some oribatid mites), which can tolerate a wide range of environmental conditions (i.e. possess a general purpose genotype; [57]), are the models that Woltereck [34] proposed. Correspondingly, we used the single genotype of a “phenotypically-tractable” model lineageA. longisetosusran to unravel the relationship of food quality and variation of multiple traits (i.e. pheno-typic plasticity).
Nutritional effects on traits and variation
Most studies on a single species so far focused on the re-lationship of nutrients to one or a distinct set of traits– often times related to fitness (e.g., [18, 20,58, 59]). We think that our multiple traits approach –also including presumable neutral characters – better allows to disen-tangle patterns and mechanisms of nutrient influence on the mean and variance as well as the inherent plasticity of traits. In our experiment, all traits responded to diet and showed quadratic reaction norms (= optima) of dif-ferent strength (Fig. 2). Physiological theory formally conceptualized this quadratic (or concave) response of fitness relevant performance traits as“threshold elemen-tal ratio” [for element stoichiometry; 26] or as
“Ber-trand’s rule” for the concentration of essential
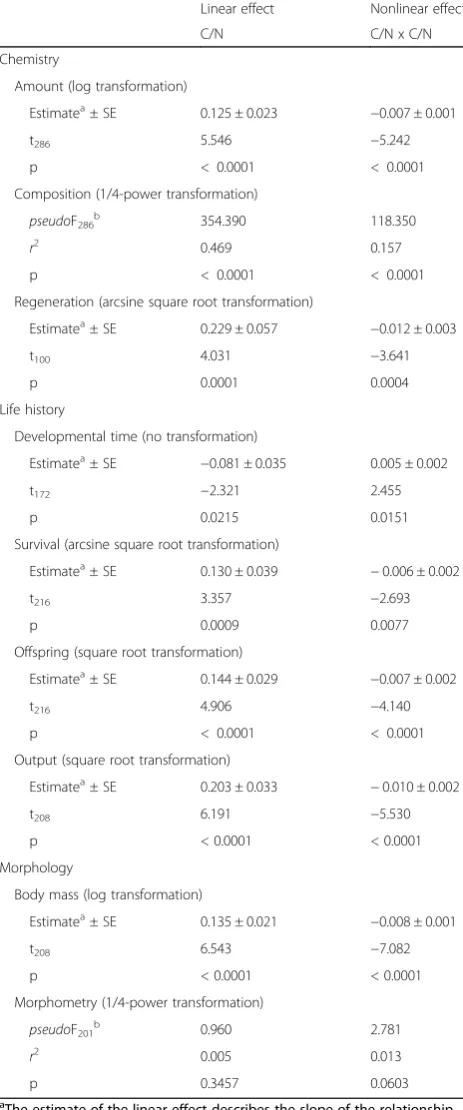
Table 4The linear and non-linear effects of food C/N ratios on
the nine different traits of the oribatid miteArchegozetes longisetosus
Linear effect Nonlinear effect
C/N C/N x C/N
Chemistry
Amount (log transformation)
Estimatea± SE 0.125 ± 0.023 −0.007 ± 0.001
t286 5.546 −5.242
p < 0.0001 < 0.0001
Composition (1/4-power transformation)
pseudoF286b 354.390 118.350
r2 0.469 0.157
p < 0.0001 < 0.0001
Regeneration (arcsine square root transformation)
Estimatea± SE 0.229 ± 0.057 −0.012 ± 0.003
t100 4.031 −3.641
p 0.0001 0.0004
Life history
Developmental time (no transformation)
Estimatea± SE −0.081 ± 0.035 0.005 ± 0.002
t172 −2.321 2.455
p 0.0215 0.0151
Survival (arcsine square root transformation)
Estimatea± SE 0.130 ± 0.039 −0.006 ± 0.002
t216 3.357 −2.693
p 0.0009 0.0077
Offspring (square root transformation)
Estimatea± SE 0.144 ± 0.029 −0.007 ± 0.002
t216 4.906 −4.140
p < 0.0001 < 0.0001
Output (square root transformation)
Estimatea± SE 0.203 ± 0.033 −0.010 ± 0.002
t208 6.191 −5.530
p < 0.0001 < 0.0001
Morphology
Body mass (log transformation)
Estimatea± SE 0.135 ± 0.021 −0.008 ± 0.001
t208 6.543 −7.082
p < 0.0001 < 0.0001
Morphometry (1/4-power transformation)
pseudoF201b 0.960 2.781
r2 0.005 0.013
p 0.3457 0.0603
a
The estimate of the linear effect describes the slope of the relationship between the C/N ratio and the response variable (i.e. normalized trait value), while the estimate of the non-linear effect is the curvature of the
quadratic relationship (i.e. normalized trait value ~ C/N x C/N).bFor the
micronutrients [60] and also macronutrients [18]. While the first concept is a stoichiometric approach based on the proportional relationship of elements, the latter uses absolute concentrations or the amount of nutrient intake to explain reaction norms of individuals [18,20,26,31]. Yet, both concepts are unified by a similar prediction: if a food is too unbalanced (containing too low levels of a certain nutrient or element) to reach the intake target, the benefits gained from increasing the amount or ratio of this nutrient or element also increases until they reach an equilibrium. More nutrients/elements beyond this threshold (the intake target) are associated with in-creasing costs for the regulatory mechanisms resulting
in physiological disadvantage higher than the original benefit [20,31]. Our results for C/N show that a simple threshold elemental ratio (presumably close to our model species intake target) applies to multiple traits and, even more important, also to their variability and thus to phenotypic plasticity. This is because the vari-ability of each trait across resources was heteroscedastic, indicating that food quality not only changed the mean (e.g., [61, 62]), but also the variation of a trait [25, 28– 30]. These findings could help to propose a general eco-physiological mechanism causing dietary related in-traspecific trait variation derived for our model system: the low performance and high plasticity of animals
a
b
Fig. 3Ordination (discriminant analysis of principal components) of the relative composition of defensive gland exudates [%] (a), as well as the eleven morphometric characters [% relative to notogaster length] (b) of mite individuals reared on the ten resources. The filled circles mark the group mean (centroid) of each respective group, ellipsoid hulls indicate the group dispersion (multivariate variance) as 95% confidential space. Percentages denote the variance explained by each axis. Colors correspond to the figure legend and Fig.1
a
b
feeding on resources from the “edges”of an elemental or nutritional gradient ingest imbalanced food with stoichio-metric shortcomings which causes stress related costs to deal with the deficits as well as surpluses of elements or nutrients [18,26]. While at low N-content (high C/N ra-tio) trait performance was limited by a short supply of protein, mites shifted to a C-limited trait performance at high level of N (low C/N). Consequently, high variability of all traits (i.e. high phenotypic plasticity) occurred if ei-ther protein (N) or energy (C) limited the formation and performance of traits. More general (see Fig.6): if there is a considerable trade-off between consumed surplus and deficit nutrients in one resource, the variation across mul-tiple traits within a phenotype is high, while the trait mean is low. Reciprocally, trait variation is low, and the trait mean is high at nutritional optima where no essential nu-trient is in short supply and a respective genotype can al-most bear its full potential. This connection of trait means and variances across resources (expressed as a direct nega-tive relationship, Fig. 6) is further evidence for the wide applicability of the balanced diet hypothesis [25]. The con-cave responses of all traits and their variability to overall food quality (C/N ratio) in our experiments not only indi-cated that the threshold-elemental-ratio-rule applied for a wide range of traits and their variability, but further suggest costs [20] to maintain a high mean and low variance of a
trait. This means that mites feeding on “edge” resources must deal with high costs during allocating resources com-pared to mite consuming the “optimum” food. Despite these costs, however, variation at the “edges” may still be beneficial, because it enables at least a small number of in-dividuals to survive unfavored conditions. For instance, a recent synthesis by Forsman and Wennersten [63] found that variation seems to be more important under stressful circumstances when animals are forced to exist under sub-optimal conditions - like stoichiometrically imbalanced food not meeting the intake target [26] - and may enable the survival of a population [64].
Inherent variability of traits
react with higher variability to an environmental gradient, because it faces more trade-offs along this gradient than other characters; or the formation/development of a trait may be more“complex”and thus demands a stronger segre-gation of energy leading to more trade-offs. Consequently, lower trait variation may indicate less trade-offs (or selection) along a certain gradient. Also, a lower variability may be a signal for an inherently lower plasticity of a trait because it is less controlled by the phenotypes’response or selection. For instance, in our experiments, the body size of the mites changed considerably along the C/N gradient, yet the overall body shape (morphometric measurements) only showed a weak response and low variability. This may indicate, that– besides selection or genetical conservation–the overall body size could be influenced by the phenotypic response to al-tered nutrients. Yet, the proportions of the body shape iso-metrically scaled with this phenotypic change, leading to low overall variability.
Conclusions
Overall, we have shown that the threshold elemental ra-tio rule [18,26,60], applies to a wide range of traits and also to dietary caused intraspecific variation of multiple traits (= phenotypic plasticity) in a model system exclud-ing genotypic variation. Thus, there seems not only to be a nutritional optimum for a traits’mean, but also its vari-ation, which further strengthens the balanced diet
hypothesis [25]. Highly imbalanced food results in lower trait means and higher trait variability (Figs. 2, 5, 6), po-tentially caused by more/stronger trade-offs across re-sources arising from physiological stress. Additionally, some traits seem to have higher inherent variation than others, irrespective of“trait type”. Based on our empirical evidence we propose the following hypotheses, leading to further experimental evaluation; i) the mean trait variation calculated based on all trait variation within a resource could be used as an indicator for the food quality and ii) given that there is a direct link of both mean and variation of traits (Fig. 6), the latter might also be indicative for trade-offs an animal faces when feeding on imbalanced di-ets [20]. Finally, using a single parthenogenetic lineage ex-cludes genotypic plasticity and creates a phenotypically tractable model species. This is a first step to establish an experimental platform to ultimately disentangle how vari-ation (or the capacity to express plasticity) affects the fit-ness of individuals [65].
Additional files
Additional file 1:Raw data table. (XLSX 560 kb)
Additional file 2:Morphometric data. (PDF 370 kb)
Additional file 3:Trait data used for Fig.2. (PDF 253 kb)
Additional file 4:Post-hoc test results. (PDF 94 kb)
Acknowledgments
We thank Andrea Hilpert, Ursula Lebong, Christian Storm, Sonja Elberich, Danny Rothe and Tim Bergmann for experimental assistance as well as Nico Blüthgen for helpful discussion.
Funding
AB was supported by the German Nation Academic Foundation (Studienstiftung des deutschen Volkes) and is a Simons Fellow of the Life Sciences Research Foundation (LSRF). This study was supported by the German Science Foundation (DFG; HE 4593/5–1).
Availability of data and materials
All experimental data can be found in the Additional file1.
Authors’contributions
MH and AB designed the research; AB, RS and KW performed the experiment, AB performed chemical analyses; AB analyzed the data; AB and MH wrote the paper. All authors discussed and approved the final manuscript.
Ethics approval and consent to participate
There are no legal restrictions on working with mites.
Consent for publication
Not applicable.
Competing interests
The authors declare no competing financial interests.
Publisher’s Note
Springer Nature remains neutral with regard to jurisdictional claims in published maps and institutional affiliations.
Author details
1
Ecological Networks, Technische Universität Darmstadt, Schnittspahnstraße 3, 64287 Darmstadt, Germany.2Division of Biology and Biological Engineering, California Institute of Technology, 1200 E California Boulevard, Pasadena, CA 91125, USA.
Received: 20 September 2018 Accepted: 23 November 2018
References
1. Mayr E, Provine WB. The evolutionary synthesis: perspectives on the unification of biology: Harvard University Press; 1998.
2. Schlichting CD, Pigliucci M. Phenotypic evolution: a reaction norm perspective. Sinauer Associates Incorporated; 1998.
3. Whitman DW, Agrawal AA. What is phenotypic plasticity and why is it important. Phenotypic plasticity of insects: Mechanisms and Consequences. 2009:1–63.
4. Kelly SA, Panhuis TM, Stoehr AM. Phenotypic plasticity: molecular mechanisms and adaptive significance. Comp Physiol. 2012;2:1417–39. 5. Piersma T, Van Gils JA. The flexible phenotype: a body-centered integration
of ecology, physiology, and behaviour: Oxford University Press; 2011. 6. Fordyce JA. The evolutionary consequences of ecological interactions
mediated through phenotypic plasticity. J Exp Biol. 2006;209:2377–83. 7. Krause S, Le Roux X, Niklaus PA, Van Bodegom PM, Lennon JT, Bertilsson S,
Grossart H-P, Philippot L, Bodelier PL. Trait-based approaches for understanding microbial biodiversity and ecosystem functioning. Front Microbiol. 2014;5:251.
8. Violle C, Navas ML, Vile D, Kazakou E, Fortunel C, Hummel I, Garnier E. Let the concept of trait be functional. Oikos. 2007;116:882–92.
9. Bjørnstad ON, Hansen TF. Individual variation and population dynamics. Oikos. 1994;69:167–71.
10. Grant P, Price T. Population variation in continuously varying traits as an ecological genetics problem. Ame Zool. 1981;21:795–811.
11. Bolnick DI, Amarasekare P, Araújo MS, Bürger R, Levine JM, Novak M, Rudolf VH, Schreiber SJ, Urban MC, Vasseur DA. Why intraspecific trait variation matters in community ecology. Trends Ecol Evol. 2011;26:183–92.
12. Bolnick DI, Svanbäck R, Fordyce JA, Yang LH, Davis JM, Hulsey CD, Forister ML. The ecology of individuals: incidence and implications of individual specialization. Am Nat. 2002;161:1–28.
13. Pachepsky E, Bown JL, Eberst A, Bausenwein U, Millard P, Squire GR, Crawford JW. Consequences of intraspecific variation for the structure and function of ecological communities part 2: linking diversity and function. Ecol Model. 2007;207:277–85.
14. Wood CM, McKinney ST, Loftin CS. Intraspecific functional diversity of common species enhances community stability. Ecol Evol. 2017;7:1553–60. 15. Berg MP, Ellers J. Trait plasticity in species interactions: a driving force of
community dynamics. Evo Ecol. 2010;24:617–29.
16. Malerba ME, Heimann K, Connolly SR. Nutrient utilization traits vary systematically with intraspecific cell size plasticity. Funct Ecol. 2016;30:1745–55. 17. Pascacio-Villafán C, Williams T, Birke A, Aluja M. Nutritional and
non-nutritional food components modulate phenotypic variation but not physiological trade-offs in an insect. Sci Rep 2016; 6:srep29413. 18. Raubenheimer D, Lee K, Simpson S. Does Bertrand's rule apply to
macronutrients? Proc R Soc Lond B. 2005;272:2429–34.
19. Simpson SJ, Raubenheimer D. The hungry locust. Advances in the study of behavior. Volume 29: Elsevier. 2000:1–44.
20. Simpson SJ, Raubenheimer D. The nature of nutrition: a unifying framework from animal adaptation to human obesity: Princeton University Press; 2012. 21. Wetzel WC, Kharouba HM, Robinson M, Holyoak M, Karban R. Variability in
plant nutrients reduces insect herbivore performance. Nature. 2016;539:425. 22. Gibert JP, Allen RL, Hruska RJ, DeLong JP. The ecological consequences of
environmentally induced phenotypic changes. Ecol Lett. 2017;20:997–1003. 23. Liang D, Silverman J.“You are what you eat”: diet modifies cuticular
hydrocarbons and nestmate recognition in the argentine ant,Linepithema humile. Naturwissenschaften. 2000;87:412–6.
24. Lee KP, Jang T, Ravzanaadii N, Rho MS. Macronutrient balance modulates the temperature-size rule in an ectotherm. Am Nat. 2015;186:212–22. 25. DeMott WR. Utilization of a cyanobacterium and a phosphorus-deficient
green alga as complementary resources by daphnids. Ecology. 1998;79: 2463–81.
26. Boersma M, Elser JJ. Too much of a good thing: on stoichiometrically balanced diets and maximal growth. Ecology. 2006;87:1325–30. 27. Lefcheck JS, Whalen MA, Davenport TM, Stone JP, Duffy JE. Physiological
effects of diet mixing on consumer fitness: a meta-analysis. Ecology. 2013; 94:565–72.
28. Senior AM, Nakagawa S, Lihoreau M, Simpson SJ, Raubenheimer D. An overlooked consequence of dietary mixing: a varied diet reduces interindividual variance in fitness. Am Nat. 2015;186:649–59.
29. Bunning H, Bassett L, Clowser C, Rapkin J, Jensen K, House CM, Archer CR, Hunt J. Dietary choice for a balanced nutrient intake increases the mean and reduces the variance in the reproductive performance of male and female cockroaches. Ecol Evol. 2016;6:4711–30.
30. Han CS, Dingemanse NJ. You are what you eat: diet shapes body composition. personality and behavioral stability BMC Evol Biol. 2017;17:8. 31. Sterner RW, Elser JJ. Ecological stoichiometry: the biology of elements from
molecules to the biosphere: Princeton University Press; 2002.
32. Heethoff M, Bergmann P, Laumann M, Norton RA. The 20th anniversary of a model mite: a review of current knowledge aboutArchegozetes longisetosus
(Acari, Oribatida). Acarologia. 2013;53:353–68.
33. Bergmann P, Laumann M, Norton RA, Heethoff M. Cytological evidence for automictic thelytoky in parthenogenetic oribatid mites (Acari, Oribatida): Synaptonemal complexes confirm meiosis inArchegozetes longisetosus. Acarologia. 2018;58:342–56.
34. Woltereck R. Weitere experimentelle Untersuchungen über Artveränderung, speziell über des Wesen quantitativer Artunterschiede beiDaphniden. Ver Deutsche Zool Gesell. 1909;19:110–72.
35. Stearns SC. Trade-offs in life-history evolution. Funct Ecol. 1989;3:259–68. 36. Scharloo W. Developmental and physiological aspects of reaction norms.
Bioscience. 1989;39:465–71.
37. Norton RA. Evolutionary aspects of oribatid mite life histories and consequences for the origin of the Astigmata. In: Houck MA, editor. Mites: ecological and evolutionary analyses of life-history patterns. Chapman & Hall edition. New York: Chapman & Hall; 1994. p. 99–135.
38. Heethoff M, Raspotnig G. Triggering chemical defense in an oribatid mite using artificial stimuli. Exp Appl Acarol. 2012;56:287–95.
39. Raspotnig G. Chemical alarm and defence in the oribatid mite
40. Heethoff M, Koerner L, Norton RA, Raspotnig G. Tasty but protected-first evidence of chemical defense in oribatid mites. J Chem Ecol. 2011;37:1037– 43.
41. Heethoff M, Rall BC. Reducible defence: chemical protection alters the dynamics of predator–prey interactions. Chemoecology. 2015;25:53–61. 42. Peschel K, Norton RA, Scheu S, Maraun M. Do oribatid mites live in
enemy-free space? Evidence from feeding experiments with the predatory mite
Pergamasus septentrionalis. Soil Biol Biochem. 2006;38:2985–9. 43. Jeffries M, Lawton J. Enemy free space and the structure of ecological
communities. Biol J Linnean Soc. 1984;23:269–86.
44. Brückner A, Heethoff M. The ontogeny of oil gland chemistry in the oribatid miteArchegozetes longisetosusAoki (Oribatida, Trhypochthoniidae). Int J Acarol. 2017;43:337–42.
45. Heethoff M. Regeneration of complex oil-gland secretions and its importance for chemical defense in an oribatid mite. J Chem Ecol. 2012;38: 1116–23.
46. Dunn OJ. Multiple comparisons using rank sums. Technometrics. 1964;6: 241–52.
47. Benjamini Y, Hochberg Y. Controlling the false discovery rate - a practical and powerful approach to multiple testing. J Roy Stat Soc B Met. 1995;57: 289–300.
48. Anderson MJ. Permutation tests for univariate or multivariate analysis of variance and regression. Can J Fish Aquat Sci. 2001;58:626–39. 49. Jombart T, Devillard S, Balloux F. Discriminant analysis of principal
components: a new method for the analysis of genetically structured populations. BMC Genet. 2010;11:94.
50. Nakagawa S, Poulin R, Mengersen K, Reinhold K, Engqvist L, Lagisz M, Senior AM. Meta-analysis of variation: ecological and evolutionary applications and beyond. Methods Ecol Evol. 2015;6:143–52.
51. R Core Team. R: a language and environment for statistical computing. Vienna, Austria: R Foundation for Statistical Computing; 2016.
52. Fox J, Weisberg S. An R companion to applied regression: Sage Publications; 2011.
53. Bates D, Maechler M, Bolker B, Walker S. Fitting linear mixed-effects models using lme4. J Stat Soft. 2015;67:1–48.
54. Pohlert T. The pairwise multiple comparison of mean ranks package (PMCMR). R package. 2014:2004–6.
55. Oksanen J, Kindt R, Legendre P, O’Hara B, Stevens MHH, Oksanen MJ, Suggests M. The vegan package. Com Ecol Pack. 2007;10:631–7.
56. Fox J, Andronic L, Ash M, Boye T, Calza S, Chang A, Grosjean P, Heiberger R, Kerns G, Lancelot R. Rcmdr: R Commander. R package version. 2009;1:5–4. 57. Lynch M. Destabilizing hybridization, general-purpose genotypes and
geographic parthenogenesis. Q Rev Biol. 1984;59:257–90.
58. Zehnder CB, Hunter MD. More is not necessarily better: the impact of limiting and excessive nutrients on herbivore population growth rates. Ecol Entomol. 2009;34:535–43.
59. Van Amelsvoort P, Usher M. Egg production related to food quality in
Folsomia candida(Collembola: Isotomidae): effects on life history strategies. Pedobiologia. 1989;33:61–6.
60. Bertrand G. On the role of trace substances in agriculture. Eighth Int Congr Appl Chem. 1912;28:30–40.
61. Reger J, Lind MI, Robinson MR, Beckerman AP. Predation drives local adaptation of phenotypic plasticity. Nature Ecol Evol. 2018;2:100. 62. Draghi JA, Whitlock MC. Phenotypic plasticity facilitates mutational variance,
genetic variance, and evolvability along the major axis of environmental variation. Evolution. 2012;66:2891–902.
63. Forsman A, Wennersten L. Inter-individual variation promotes ecological success of populations and species: evidence from experimental and comparative studies. Ecography. 2016;39:630–48.
64. Price TD, Qvarnström A, Irwin DE. The role of phenotypic plasticity in driving genetic evolution. Proc R Soc Lond B. 2003;270:1433–40. 65. Forsman A. Rethinking phenotypic plasticity and its consequences for
individuals. populations and species Heredity. 2015;115:276.
66. Blum MS. Chemical defenses of arthropods. New York: Academic Press, Inc.; 1981.
67. Eisner T, Meinwald J. Defensive secretions of arthropods. Science. 1966;153: 1341–50.
68. Pasteels JM, Grégoire J-C, Rowell-Rahier M. The chemical ecology of defense in arthropods. Annu Rev Entomol. 1983;28:263–89.
69. Spencer KC. Chemical mediation of coevolution. San Diego, California. USA: Academic Press, Inc.; 1988.
70. Baldwin IT, Dusenbery DB, Eisner T. Squirting and refilling: dynamics of p-benzoquinone production in defensive glands ofDiploptera punctata. J Chem Ecol. 1990;16:2823–34.
71. Fescemyer HW, Mumma RO. Regeneration and biosynthesis of dytiscid defensive agents (Coleoptera: Dytiscidae). J Chem Ecol. 1983;9:1449–64. 72. Stearns SC, Kawecki TJ. Fitness sensitivity and the canalization of life-history
traits. Evolution. 1994;48:1438–50.
73. Brey T, Hain S. Growth, reproduction and production ofLissarca notorcadensis(Bivalvia: Philobryidae) in the Weddell Sea. Antarctica Marine Ecology Progress Series. 1992:219–26.
74. Thessalou-Legaki M, Kiortsis V. Estimation of the reproductive output of the burrowing shrimpCallianassa tyrrhena: a comparison of three different biometrical approaches. Mar Biol. 1997;127:435–42.
75. Brose U, Berlow EL, Martinez ND. Scaling up keystone effects from simple to complex ecological networks. Ecol Lett. 2005;8:1317–25.
76. Jennings S, Mackinson S. Abundance–body mass relationships in size-structured food webs. Ecol Lett. 2003;6:971–4.
77. Yodzis P, Innes S. Body size and consumer-resource dynamics. Am Nat. 1992;139:1151–75.
78. Burns J, Di Nardo P, Rodd F. The role of predation in variation in body shape in guppiesPoecilia reticulata: a comparison of field and common garden phenotypes. J Fish Biol. 2009;75:1144–57.


![Fig. 3 Ordination (discriminant analysis of principal components) of the relative composition of defensive gland exudates [%] (eleven morphometric characters [% relative to notogaster length] (group mean (centroid) of each respective group, ellipsoid hulls](https://thumb-us.123doks.com/thumbv2/123dok_us/385640.1531272/10.595.59.540.500.695/ordination-discriminant-components-composition-morphometric-characters-notogaster-respective.webp)
![Fig. 5 The relationship of the mean trait variation [ln CV] of one resource across all traits plotted against the C/N ratio](https://thumb-us.123doks.com/thumbv2/123dok_us/385640.1531272/11.595.60.539.86.372/fig-relationship-trait-variation-resource-traits-plotted-ratio.webp)
![Fig. 6 The relationship of trait means [normalized trait value t0.38,’] to trait variation [ln CV] of the different univariate traits across resources](https://thumb-us.123doks.com/thumbv2/123dok_us/385640.1531272/12.595.58.539.86.354/relationship-trait-normalized-variation-different-univariate-traits-resources.webp)