Open Access
Research
Parameters of proteome evolution from histograms of amino-acid
sequence identities of paralogous proteins
Jacob Bock Axelsen
1,2, Koon-Kiu Yan
2,3and Sergei Maslov*
2,3Address: 1Center for Models of Life, Niels Bohr Institute, Blegdamsvej 17, DK-2100, Copenhagen Ø, Denmark, 2Department of Condensed Matter Physics and Materials Science, Brookhaven National Laboratory, Upton, New York 11973, USA and 3Department of Physics and Astronomy, Stony Brook University, Stony Brook, New York 11794, USA
Email: Jacob Bock Axelsen - [email protected]; Koon-Kiu Yan - [email protected]; Sergei Maslov* - [email protected] * Corresponding author
Abstract
Background: The evolution of the full repertoire of proteins encoded in a given genome is mostly driven by gene duplications, deletions, and sequence modifications of existing proteins. Indirect information about relative rates and other intrinsic parameters of these three basic processes is contained in the proteome-wide distribution of sequence identities of pairs of paralogous proteins.
Results: We introduce a simple mathematical framework based on a stochastic birth-and-death model that allows one to extract some of this information and apply it to the set of all pairs of paralogous proteins in H. pylori, E. coli, S. cerevisiae, C. elegans, D. melanogaster, and H. sapiens. It was found that the histogram of sequence identities p generated by an all-to-all alignment of all protein sequences encoded in a genome is well fitted with a power-law form ~ p-γwith the value of the
exponent γ around 4 for the majority of organisms used in this study. This implies that the intra-protein variability of substitution rates is best described by the Gamma-distribution with the exponent α ≈ 0.33. Different features of the shape of such histograms allow us to quantify the ratio between the genome-wide average deletion/duplication rates and the amino-acid substitution rate.
Conclusion: We separately measure the short-term ("raw") duplication and deletion rates ,
which include gene copies that will be removed soon after the duplication event and their
dramatically reduced long-term counterparts rdup, rdel. High deletion rate among recently duplicated
proteins is consistent with a scenario in which they didn't have enough time to significantly change their functional roles and thus are to a large degree disposable. Systematic trends of each of the four duplication/deletion rates with the total number of genes in the genome were analyzed. All
but the deletion rate of recent duplicates were shown to systematically increase with Ngenes.
Abnormally flat shapes of sequence identity histograms observed for yeast and human are consistent with lineages leading to these organisms undergoing one or more whole-genome duplications. This interpretation is corroborated by our analysis of the genome of Paramecium tetraurelia where the p-4 profile of the histogram is gradually restored by the successive removal of
paralogs generated in its four known whole-genome duplication events.
Published: 26 November 2007
Biology Direct 2007, 2:32 doi:10.1186/1745-6150-2-32
Received: 1 November 2007 Accepted: 26 November 2007
This article is available from: http://www.biology-direct.com/content/2/1/32 © 2007 Axelsen et al; licensee BioMed Central Ltd.
This is an Open Access article distributed under the terms of the Creative Commons Attribution License (http://creativecommons.org/licenses/by/2.0), which permits unrestricted use, distribution, and reproduction in any medium, provided the original work is properly cited.
rdup∗ rdel∗
Open peer review
This article was reviewed by Eugene Koonin, Yuri Wolf (nominated by Eugene Koonin), David Krakauer, and Eugene Shakhnovich.
Background
The recent availability of complete genomic sequences of a diverse group of living organisms allows one to quantify basic mechanisms of molecular evolution on an unprece-dented scale. The part of the genome consisting of all pro-tein-coding genes (the full repertoire of its proteome) is at the heart of all processes taking place in a given organism. Therefore, it is very important to understand and quantify the rates and other parameters of basic evolutionary proc-esses shaping thus defined proteome. The most important of those processes are:
• Gene duplications that give rise to new protein-coding regions in the genome. The two initially identical proteins encoded by a pair of duplicated genes subsequently diverge from each other in both their sequences and func-tions.
• Gene deletions in which genes that are no longer required for the functioning of the organism are either explicitly deleted from the genome or stop being tran-scribed and become pseudogenes whose homology to the existing functional genes is rapidly obliterated by muta-tions.
• Changes in amino-acid sequences of proteins encoded by already existing genes. This includes a broad spectrum of processes including point substitutions, insertions and deletions (indels), and transfers of whole domains either from other genes in the same genome or even from genomes of other species.
The BLAST (blastp) algorithm [1] allows one to quickly obtain the list of pairs of paralogous proteins encoded in a given genome whose amino-acid sequences haven't diverged beyond recognition. The set of their percentage identities (PIDs) is a dynamic entity that changes due to gene duplications, deletions, and local changes of sequences. Duplication events constantly create new pairs of paralogous proteins with PID = 100%, while subse-quent substitutions, insertions and deletions result in their PID drifting down towards lower values. A paralo-gous pair disappears from this dataset if one of its constit-uent genes is deleted from the genome, becomes a pseudogene, or when the PID of the pair becomes too low for it to pass the E-value cutoff of the algorithm. Thus the PID histogram contains a valuable if indirect information about past duplications, deletions, and sequence diver-gence events that took place in the genome. In what fol-lows we propose a mathematical framework allowing one
to extract some of this information and quantify the aver-age rates and other parameters of the basic evolutionary processes shaping protein-coding contents of a genome.
The list of all paralogous pairs generated by the all-to-all alignment of protein sequences encoded in a given genome is generally much larger than the list of pairs of sibling proteins created by individual duplication events. For example, a family consisting of F paralogous proteins contributes up to F(F - 1)/2 pairs to the all-to-all BLAST output, while not more than F - 1 of these pairs connect the actual siblings to each other. The identification of the most likely candidates for these "true" duplicates is in gen-eral a rather complicated task which involves reconstruct-ing the actual phylogenetic tree for every family in a genome. This goes beyond the scope of this study, where we employ a much simpler (yet less precise) Minimum Spanning Tree algorithm to extract a putative non-redun-dant subset of true duplicated (sibling) pairs.
The idea of quantifying evolutionary parameters using the histogram of some measure of sequence similarity of duplicated genes in itself is not new. It was already dis-cussed by Gillespie (see [2] and references therein) and later applied [3] to measure the deletion rate of recent duplicates. There are two important differences between our methods and those of the Ref. [3]:
• We use relatively slow changes in amino-acid sequences of proteins as opposed to much faster silent substitutions of nucleotides used in the Ref. [3]. This allows to dramat-ically extend the range of evolutionary times amenable to this type of analysis.
• In addition to PID distributions in the non-redundant set of true duplicated pairs used in the Ref. [3] we also study that in the highly redundant set of all paralogous pairs detected by BLAST. It turned out that both these dis-tributions contain important and often complimentary information about the quantitative dynamics of the underlying evolutionary process. The shape of the latter (all-to-all) histogram is to a first approximation inde-pendent of duplication and deletion rates and thus it allows us to concentrate on fine properties of amino-acid substitution.
The central results of our analysis are:
• The upper part of the PID histogram corresponding to recently duplicated pairs (PID>90%) deviates from this powerlaw form. It is exactly this subset of paralogous pairs that was extensively analyzed in Ref. [3]. This feature is consistent with the picture of frequent deletion of recent duplicates proposed in Ref. [3].
• The analysis of various features of the PID histogram of all paralogous pairs and that of a subset consisting of true duplicated (sibling) pairs allows us to quantify both the long-term average duplication and deletion rates in a given genome as well as a dramatic increase in those rates for recently duplicated genes.
• Abnormally flat PID histograms observed for yeast and human are consistent with lineages leading to these organisms undergoing one or more Whole-Genome Duplications (WGD). This interpretation is corroborated by the genome of Paramecium tetraurelia where the PID-4 profile of the sequence identity histogram is gradually restored by the successive removal of paralogs generated in its four known WGD events.
• Applying the same methods to large individual families of paralogous proteins allows one to study the variability of evolutionary parameters within a given genome. It is
shown that larger or slower evolving families are charac-terized by higher inter-protein variability of amino-acid substitution rates.
Results
Distribution of sequence identities of all paralogous pairs in a genome
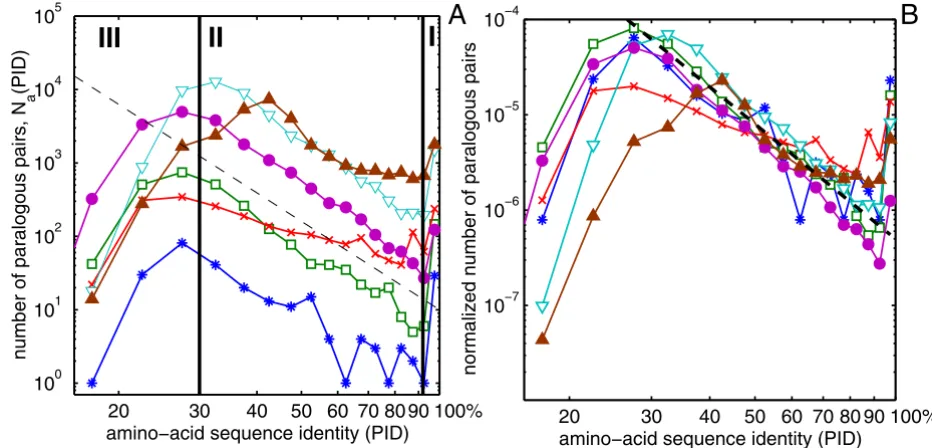
We studied the distribution of Percent Identity (PID) of amino acid sequences of all pairs of paralogous proteins in complete genomes of bacteria H. pylori, E. coli, a single-celled eukaryote S. cerevisiae, and multi-cellular eukaryo-tes C. elegans, D. melanogaster, and H. sapiens. Every pro-tein sequence contained in a given genome was attempted to be aligned with all other sequences in the same genome using the blastp algorithm [1]. To avoid including pairs of multidomain proteins homologous over only one of their domains we have filtered the data by only keeping the pairs in which the length of the aligned region constitutes at least 80% of the length of the longer protein. Infrequent spurious alignments between different splicing variants of the same gene or between proteins listed in the database under several different names were dropped from our final dataset. The exact details of our procedure are described in the Methods section. Fig. 1A shows the histo-gram Na(p) of amino-acid sequence identities (PIDs) p of all pairs of paralogous proteins encoded in different
Histogram of all amino-acid sequence identities
Figure 1
Histogram of all amino-acid sequence identities. The histogram Na(p) (panel A) and the normalized histogram na(p) =
Na(p)/[Ngenes(Ngenes - 1)/2] (panel B) of amino acid sequence identities p for all pairs of paralogous proteins in complete
genomes of H. pylori (blue stars), E. coli (green open squares), S. cerevisiae (red crosses), C. elegans (cyan open triangles), D. mel-anogaster (magenta filled circles) and H. sapiens (brown filled triangles). The dashed line is a power-law p-4. Note the logarithmic
scale of both axes. Vertical lines separate regions I, II and III described in the text.
20 30 40 50 60 70 80 90 100% 100
101 102 103 104 105
amino−acid sequence identity (PID)
number of paralogous pairs, N
a
(PID)
20 30 40 50 60 70 80 90 100% 10−7
10−6 10−5 10−4
amino−acid sequence identity (PID)
normalized number of paralogous pairs
I
II
genomes. The p-dependence of these histograms has three distinct regions I, II, III.
• Region I: There is a sharp and significant upturn in the PID histogram above roughly 90–95% compared to what one expects from extrapolating Na(p) from lower values of p. Apparently the constants (or possibly even mecha-nisms) of the dynamical process shaping Na(p) are differ-ent in this region.
• Region II: This region covers the widest interval of PIDs 30% <p < 90%. Na(p) in this region can be approximated
by a power-law form of p-γwith γ≈ 4 (shown as a dashed line in Fig. 1A.) The best fits to the power-law form in the Region II are listed in Table 1 and (with the exception of yeast and human) they fall in the 3 – 5 range. The near-universality of the shape of the PID histogram is perhaps best illustrated by an approximate collapse of PID histo-grams in different genomes when they are normalized by the total number Ngenes(Ngenes - 1)/2, of all (both paralo-gous and non-paraloparalo-gous) gene pairs in the genome (Fig. 1B).
• Region III: In this region p < 25 – 30% the histogram Na(p) starts to deviate down from the p-γpowerlaw behav-ior. This decline is an artifact of the inability of sequence-based algorithms such as BLAST to detect some of the bona fide paralogous pairs with low sequence identity. This explanation is corroborated by the observation that the exact position of the downturn of Na(p) in the region III is determined by the E-value cutoff (see Additional file 1).
Birth-and-death model of the proteome evolution
In an attempt to interpret the empirical features of the PID distribution described above we propose a simple sto-chastic birth and death model of the proteome evolution. It consists of a sequence of random gene duplications, deletions, and changes in amino-acid sequences of
pro-teins they encode. Several versions of such models were previously studied [4-7] most recently in the context of powerlaw distribution of family sizes. Our model extends these previous attempts by concentrating on evolution of sequence identities as opposed to just the number of pro-teins in different families.
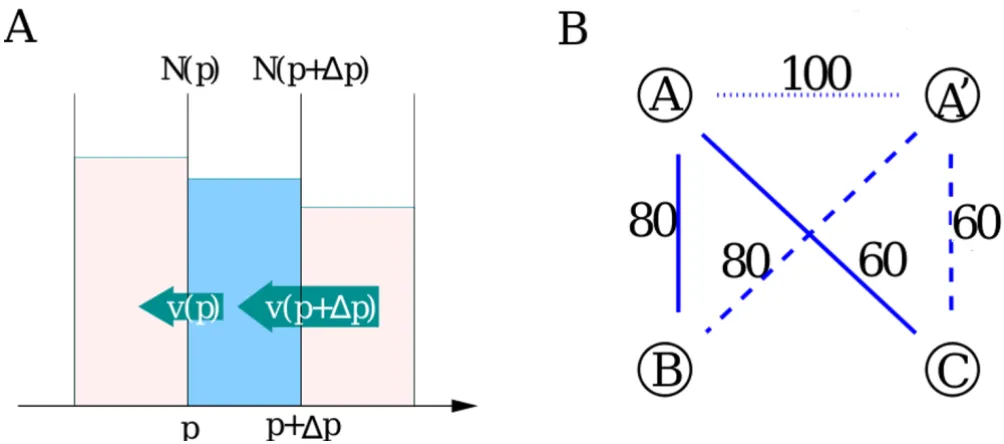
Amino acid substitutions, insertions and deletions cause the sequence identity of any given pair of paralogous teins to decay with time. Consider two paralogous pro-teins with PID = p × 100% aligned against each other. In the simplest possible case changes in their sequences hap-pen uniformly at all amino acid positions at a constant rate µ= const. The effective "substitution" rate µcombines the effects of actual substitutions and short indels. The PID of this paralogous pair changes according to the equa-tion dp/dt = -2µp. The factor two in the right hand side of this equation comes from the fact that substitutions can happen in any of the two proteins involved, while the fac-tor p – from the observation that only changes in parts of the two sequences that remain identical at the time of the given change lead to a further decrease of the PID. This equation results in an exponentially decaying PID: p(t) ~ exp(-2µt). More generally the drift of PID could be described by the equation dp/dt = -v(p). When substitution rate varies for different amino acids within the same pro-tein the relationship between v(p) and p would in general be non-linear. For our immediate purposes we will leave it unspecified. The negative drift of PIDs generates a p -dependent flux of paralogous pairs down the PID axis given by v(p)Na(p). The net flux into the PID bin of the width ∆p centered around p is given by
(see Fig. 2A).
∆p∂∂p[ ( )v p N pa( )]
Table 1: Deletion and duplication rates. The first column contains the name of the organism, the second column – Ngenes, the number
of genes in its genome, the third column is the value of the exponent γin the best fit with p-γ to N
a(p) in the region II. The fourth, fifth, sixth and seventh columns are correspondingly the ratios , rdup/ , rdel/ , and defined and measured as described in
the text.
Organism Proteome size γ r
dup/ rdel/
H. pylori 1590 3.1 0.73 0.032 0.16 67
E. coli 4288 4.4 1.37 0.038 0.10 64
S. cerevisiae 5885 1.8 1.61 0.24 0.24 27
C. elegans 19099 4.2 3.16 0.27 0.37 41
D. melanogaster 14015 4.4 0.35 0.084 0.22 30
H. sapiens 25319 2.4 2.82 0.85 0.16 19
rdup∗ /µ µ µ rdel∗ /µ
rdup∗ /µ
µ µ
Our model also involves random gene duplication and deletion events (birth and death of new protein-coding genes) which happen at rates rdup and rdel correspondingly. In Fig. 2B we illustrate the details of how a gene duplica-tion event creates new pairs of paralogous proteins. When a gene A is duplicated to A' a new pair of paralogs with PID = 100% is created (dotted line) and added to the rightmost bin of the PID histogram. Furthermore the freshly created gene A' inherits both paralogous partners (B and C) of the gene A. The PIDs of these two newly cre-ated paralogous pairs A'-B and A'-C (dashed lines) are also added to the respective bins in the histogram. Thus a duplication of any of the two paralogous genes with PID = p among other things results in the creation of a new pair of paralogs with the same PID. This process increases Na(p) at a rate 2rdupNa(p). Similarly the deletion of any of the two genes in this paralogous pair decreases Na(p) at the rate 2rdelNa(p). The bin containing PID = 100% (p = 1) has an extra flux term rdupNgenes from PIDs of the freshly created pair of duplicated genes (A-A' in our example). Here Ngenes is the total number of protein-coding genes in the genome. Adding up contributions of the three main processes (substitutions, duplications and deletions) one gets
In our model the total number of genes Ngenes in the genome exponentially grows (or decays) according to
dNgenes/dt = (rdup - rdel)Ngenes. When the genome size of an
organism remains (approximately) constant with time one can find the stationary asymptotic solution of the pre-vious equation. In this case one must have rdup = rdel so that the second term in the right hand side is equal to zero.
In the case of an exponentially growing or shrinking genome the stationary solution for Na(p, t) does not exist. However, it exists for the histogram normalized by the total number of protein pairs: It is easy to show that since
∂na(p, t)/∂t = (∂Na(p, t)/∂t)/[Ngenes(Ngenes - 1)/2] - 2(rdup
-rdel)Na(p, t)/[Ngenes(Ngenes - 1)/2] the equation for
normal-ized PID histogram na(p, t) acquires an extra negative term -2(rdup - rdel)na(p, t). This term exactly cancels the duplica-tion and deleduplica-tion terms in the equaduplica-tion for Na(p, t) and
considerably simplifies the equation for the normalized
∂
∂ = ∂∂
+ − +
Na p t
t p v p N p t
r N p t r N p t r
a
a a
( , )
[ ( ) ( , )]
( , ) ( , )
2dup 2del dupNNgenesδ(p−1).
Illustration of dynamical processes changing the PID histogram
Figure 2
Illustration of dynamical processes changing the PID histogram. (panel A) The PID decay generates a negative flux
v(p)Na(p) down the PID-axis. The net flux into a given bin ∆p is given by v(p + ∆p)Na(p + ∆p) - v(p)Na(p) ≈
(panel B) A single gene duplication event A →A' gives rise to three new paralogous pairs: A' - A, A' - B and A' - C. Immediately after the duplication the pair A - A' has the PID = 100%, while PIDs of A' - B and A' - C are equal to those of A - B and A - C. Thus the PID of every previously existing paralogous pair involving A gets duplicated along with the duplication A →A'.
histogram :
In the steady state solution one has ∂na(p, t)/∂t = 0 = ∂/
∂p[v(p)na(p)] or
na(p) ~ Na(p) ~ 1/v(p). (2)
The conjecture that the normalized PID histogram na(p) =
Na(p)/[Ngenes(Ngenes - 1)/2] indeed is nearly stationary
dur-ing the course of evolution is corroborated by the fact that all six na(p) curves in various genomes used in our study approximately lie on top of each other in Fig. 1B (com-pared to unnormalized Na(p) shown in Fig. 1A).
Comparing the Eq. 2 with the empirical form of Na(p) ~ 1/p4 in the region II of Fig. 1 one concludes that the drift velocity in real genomes must obey v(p) ~ p4. Such a non-linear dependence of v(p) could be explained by the vari-ability of the effective substitution rate within proteins (intra-protein variability). Assuming the intra-protein var-iability of substitution rates µdescribed by a PDF ρ(µ) one gets the following expression for p(t) and v(t):
Eq. 3 is a generalization of the previously discussed expo-nential decay of p(t) derived for a constant substitution rate µ. It simply weighs these exponentials by ρ(µ) – their likelihood of occurrence. For any given ρ(µ) one could exclude time from Eqs. 3 and 4 and express v as a function of p. Such v(p) dependence could then be directly com-pared with the empirically derived formula. In the absence of an analytical expression relating v(p) to (µ) one is limited to use a trial-and-error method. We start with Gamma-distributed ρ(µ) ~ µα-1 exp(-µ/µ
0) which has been predominantly used in the literature [8-10]. Inserting thus defined ρ(µ) into Eqs. 3 and 4 one gets p(t) = (2µ0)-α/(t + (2µ0)-1)αand v(t) = α(2µ
0)-α/(t + (2µ0)-1)α+1 which leads to v(p) ~ p(α+1)/αand thus to N
a(p) ~ p-(α+1)/α.
Robustness of the functional form of Na(p) with respect to assumptions used in the model
The birth-and-death model described above is based on a simplified picture of genome evolution. In particular it implicitly assumes:
• The neutrality of individual gene duplication and dele-tion events resulting in identical rates of these two proc-esses in all paralogous families in the genome.
• Identical average amino-acid substitution rates µ0 in all individual proteins.
Both of these assumptions are known to be not, strictly speaking, true. Sequences of some "important" proteins (e.g. constituents of the ribosome) are known to evolve very slowly. Also, the families containing essential (lethal knockout) genes were recently shown [11] to be character-ized by higher average duplication and deletion rates than those lacking such genes.
However, the validity of our main results goes well beyond the validity of the approximations that went into our birth-and-death model. The advantage of using the histogram of sequence identities generated by the all-to-all alignment (Na(p)) lies in its remarkable universality and robustness. When the Eq. 2 is applied to individual families one can see that family-to-family variation of (and correlations between) the duplication rate rdup, the deletion rate rdel, and the average substitution rate µ0 affect only the prefactor in the powerlaw form of Na(p). Thus the
exponent γ = 1 + 1/α describing this powerlaw is very robust with respect to assumptions of the model and depends only to the exponent αquantifying the intra-pro-tein variability of amino-acid substitution rates.
The exact mechanisms behind this apparent universality of α are not entirely clear. Chances are that it is dictated more by the protein physics rather than by organism-spe-cific evolutionary mechanisms. A possible path towards derivation of the exponent α from purely biophysical principles starts with the results of Ref. [12], which mod-els the effects of (correlated) multiple amino-acid substi-tutions on stability of the native state of a protein. However, such analysis goes beyond the scope of the present work and will be reserved for a future study.
Distribution of sequence identities of true duplicated pairs
A highly redundant dataset consisting of all paralogous pairs present in the genome enabled us to quantify the variability of intra-protein substitution rates. Another set of important parameters describing proteome evolution are average deletion/inactivation and duplication rates rdel and rdup. As will be shown in the following, the reduced non-redundant dataset consisting only of protein pairs
∂
∂ = ∂∂ + − −
na p t
t p v p n p t
r
N p
a
( , )
[ ( ) ( , )] 2 ( ).
1 1
dup genes δ
(1)
p t( )=
∫
∞ρ µ( )e−2µtdµ; 0(3)
v t dp t
dt e d
t
( )= − ( )=
∫
∞2 ( ) −2 .0 µρ µ µ
directly produced in duplication events allows us to esti-mate these rates.
To better understand the difference between those two datasets we illustrate it with a simple example. The family of four evolutionary related proteins A, B, C, D contrib-utes six paralogous pairs to Na(p). This family was actually
created by three subsequent duplication events: first A duplicated to give rise to B, then B duplicated to C and finally C duplicated to D. Thus only three out of total six paralogous pairs are directly produced in gene duplication events. The actual number of duplicated pairs could be even smaller if some intermediate genes were deleted in the course of the evolution. In general a family consisting of F proteins contributes at or around F(F - 1)/2 paralo-gous pairs to Na(p), but only F - 1 duplicated pairs to Nd(p).
Nothing in the BLAST output for a given paralogous pair contains any information if it should or should not be included in the Nd(p). However, using the set of all sequence identities of proteins for a given family one could tentatively reconstruct the course of duplication events that led to the appearance of this family. Generally speaking, this is a rather complicated task involving reconstructing the actual phylogenetic tree for every fam-ily in a genome. In this study we use a much simpler alter-native based on the Minimum Spanning Tree (MST) algorithm (see Methods for more details). For each pro-tein family this algorithm generates a tentative set of duplication events in its past history. Numbers of pairs included in Na(p) and Nd(p) distributions in different organisms are listed in the Table 2.
The dynamics of the distribution of duplicated pairs Nd(p, t) is described by simply excluding the duplication term 2rdupN (p, t) from the equation for Na(p, t). Indeed, this term is caused by PIDs of non-duplicated paralogs A'-B and A'-C (dashed lines in Fig. 2(B)) generated when a
gene A was duplicated. However, only the actual dupli-cated pair A-A' with initial PID of 100% (dotted line in Fig. 2(B)) is included in the distribution of duplicated pairs Nd(p). Thus the dynamics of Nd is described by
Once again the stationary solution exists for the normal-ized distribution. However, in this case the correct nor-malization factor is given by Ngenes and not Ngenes(Ngenes -1)/2 as for Na(p). Indeed, every duplication event increas-ing the number of genes by one adds just one duplicated pair to Nd(p) but up to Ngenes pairs to Na(p). Thus the
nor-malized PID histogram of duplicated pairs nd(p, t) = Nd(p,
t)/Ngenes evolves according to
According to our empirical findings the average rate of sequence divergence of paralogous proteins in most organisms is described v(p) = 2 pγ, where is the sub-stitution rate averaged over all amino-acid positions in all proteins, and γ≈ 4 is the exponent related to the intra-pro-tein variability of µ. The steady state of Eq. 5: ∂nd/∂t = 0 is
satisfied by:
Numerical test of analytical predictions
The analytical results derived above were confirmed by a numerical simulation. An artificial "proteome" used in
∂
∂ = ∂∂ − + −
Nd p t
t p v p N p td r N p td r N p
( , )
[ ( ) ( , )] 2del ( , ) dup genesδ( 1).
∂
∂ = ∂∂ − + + −
nd p t
t p v p n p td r r n p td r p
( , )
[ ( ) ( , )] (dup del) ( , ) dupδ( 1).
(5)
µ µ
N p n p r
p
r r
p
d( ) ~ d( ) exp
( ) .
= − +
− −
dup dup del
2µ γ 2µ γ 1 γ 1
(6)
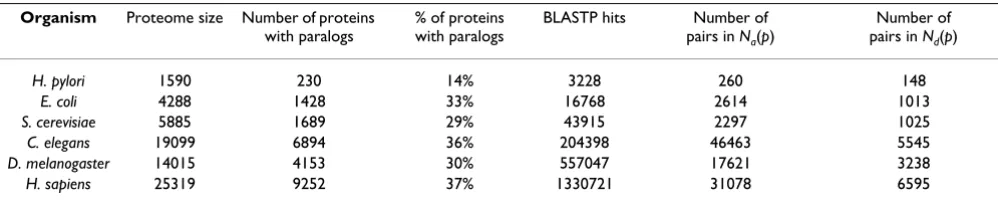
Table 2: Statistics of datasets used in this study. The first column is the name of the organism, the second column – the number of protein-coding genes in its genome, Ngenes, the third column – the number of proteins for which we found at least one paralogous partner, the fourth column is the percentage of proteins with at least one paralog, the fifth column – the total number of distinct BLAST hits generated before we applied subsequent filtering, the sixth column – the number of paralogous pairs included in Na(p), and the seventh column – in Nd(p).
Organism Proteome size Number of proteins with paralogs
% of proteins with paralogs
BLASTP hits Number of
pairs in Na(p)
Number of pairs in Nd(p)
H. pylori 1590 230 14% 3228 260 148
E. coli 4288 1428 33% 16768 2614 1013
S. cerevisiae 5885 1689 29% 43915 2297 1025
C. elegans 19099 6894 36% 204398 46463 5545
D. melanogaster 14015 4153 30% 557047 17621 3238
our numerical model consists of a fixed number of "pro-teins" of identical lengths. At every timestep one takes the sequence of a randomly selected protein and uses it to overwrite the sequence of another randomly selected pro-tein. This corresponds to a stationary genome case when rdup = rdel. Each combined duplication/deletion event is followed by random substitutions of several "amino-acids" (see Methods for details of our simulation). In the beginning of the simulation each amino-acid position within every protein was randomly assigned a substitu-tion rate drawn from the Gamma-distribusubstitu-tion with α= 1/ 3. The proteome generated by this dynamical process is periodically analyzed in terms of sequence identity of all pairs of its proteins. The resulting distributions Na(p) (filled circles) and Nd(p) (open circles) are shown in Fig.
3. They agree quite well with our theoretical predictions: Na(p) ~ 1/p4 (solid line) and N
d(p) ~ 1/p4 exp(-rdel/[3µp3]) (dashed line). The best fit to Nd(p)/Na(p) generated in our numerical simulation with A exp(-rdel/[3µp3]) gives r
del/µ
= 0.237 in excellent agreement with the actual value of rdel/µ = 0.25 used in our simulation. This demonstrates that evolutionary parameters can be successfully recon-structed from the shapes of Nd(p) and Na(p). This is
espe-cially encouraging in case of Nd(p) because of the
approximations that went into identifying true duplicated (sibling) pairs by the Minimum Spanning Tree algorithm.
Fitting evolutionary parameters of real proteomes: the long-term deletion rate
To estimate the average of deletion and duplication rates we performed a two-parameter fit to the Nd(p)/Na(p) ratio with A exp(-B/(γ- 1)pγ-1) (see Eqs. 2,6) in the 30% <p < 90% interval (region II in Fig. 1). Here A and B = (rdup + rdel)/(2 ) are the two free fitting parameters. The expo-nent γ used in the fitting formula itself was obtained from the best fit to Na(p) in the same region with the power-law form p-γ(see column 3 in Table 1). The ratio r
del/ was
extracted from the best-fit value of B and the independ-ently calculated duplication rate ratio rdup/ (see subsec-tion below). It is listed in the sixth column of the Table 1.
Fitting evolutionary parameters of real proteomes: the short-term deletion rate of recent duplicates
A very pronounced and reproducible feature in all organ-ism-wide histograms is an abrupt drop as is lowered from 100% down to about 90–95% (region I in Fig. 1.) The drop is as large as 30-fold in prokaryotes and is around 3-to-10 fold in eukaryotes. It is subsequently followed by a increase of in the region II which at low 25% (region III) turns down again only due to limitations of our ability to detect evolutionary related sequences. There exists several possible explanations for this initial drop in the region I :
• The gene conversion process. In a gene conversion proc-ess a part or the whole sequence of one of the paralogous genes is used as a template to modify the sequence of another. It happens with a reasonable frequency only if those two genes are sufficiently close to each other in their sequences so that DNA repair mechanisms might mistak-enly assume that one of them is the corrupted version of the other. If gene conversion events are sufficiently com-mon, the initial separation of a pair of freshly duplicated genes may take a long time, as one of them would be get-ting constantly converted back to the other. This would result in an abnormally small drift velocity v(p) for p close to 100% and hence to an abnormally high Na(p) ~ 1/v(p).
Another, more plausible explanation is that freshly dupli-cated genes are characterized by a much higher deletion
rate Ŭrdel [3]. Functional roles of such genes have not had enough time to diverge from each other making each of them more disposable than an average gene in the genome. Indeed, for S. cerevisiae and C. elegans it was empirically demonstrated [13,14] that the deletion or inactivation of genes with a highly similar paralogous
µ
µ
µ
rdel∗
Histogram of sequence identities in a numerical simulation of proteome dynamics
Figure 3
Histogram of sequence identities in a numerical sim-ulation of proteome dynamics. The histogram of sequences identities of all paralogous pairs Na(p) (filled cir-cles) and duplicated pairs Nd(p) (open circles) in an artificial
proteome generated by our numerical model for α = 0.33 and rdup/ = rdel/ = 0.25 as described in the text. Solid line
has the slope -4, while the dashed one is given by 6 with γ = 4 and the best fit value of rdel/ = 0.237.
10 20 30 40 50 60 70 80 90 100
101 102 103 104 105 106
PID
Na
(PID), N
d
(PID)
100
µ µ
partner in the genome is up to 4 times more likely to have no consequences for the survival of the organism than the deletion/inactivation of genes lacking such a partner.
The Na dynamics in the region I (p ⯝ 100%) is then
described by
while the normalized distribution na = Na/[Ngenes(Ngenes -1)/2] obeys
Here 2 = v(100%) is the average substitution rate in freshly duplicated pairs and is the deletion rate inside region I. The equation has an exponentially decaying
sta-tionary solution which for Ŭrdel is simply given by na(p) ~ exp( ) This functional form is consistent with the empirical data for p just below 100% and the best fits to are listed in the seventh column of the Table
1. Ref. [3] analyzed the distribution of silent substitution numbers per silent site Ks between pairs of recently
dupli-cated genes. Under the same "drift and deletion" hypoth-esis used to derive the Eq. 7 such Ks-distribution Nd(Ks)
should also have an exponential decaying form Nd(Ks) ~ exp( ), where is the average drift velocity of
Ks immediately following the duplication event. Fits to this exponential functional form performed in Ref. [3]
resulted in ~ 7 – 24. Our estimates ~ 20 – 70 are consistent with those of [3] provided that the
s ratio is in 0.1 – 1 interval.
Fitting evolutionary parameters of real proteomes: long- and short-term duplication rates
The number of paralogous pairs with PID⯝100% also
contains information about the raw duplication rate
in the genome. This rate is subsequently trimmed down to its long-term stationary value rdup by the removal of a large fraction of freshly created pairs as described in the previ-ous subsection. New pairs with PID = 100% are created at
a rate Ngenes, while they leave the bin containing PID = 100% at a rate 2 Na(100%)/∆p. Here ∆p is the width
of the bin and Na(100%) is the number of pairs in this last bin. The width of the bin is assumed to be small enough so that the removal of genes from the bin due to deletion is negligible in comparison to that due to the drift in their
sequences. Thus = 2Na(100%)/(Ngenes∆p). The average duplication rates calculated this way are presented in the fourth column of Table 1. They are compatible with
calculated in [15], where the same idea was
applied to Nd(Ks).
The rate includes the creation of some extra
dupli-cated pairs which are then quickly (on an evolutionary timescale) eliminated from the genome during a "trial period" while their PID>90%. We have already
demon-strated that such a deletion happens at a very high rate and thus has to be treated separately from the background deletion rate rdel. The duplication rapidly followed by a deletion does not change the overall distribution of paral-ogous pairs. Therefore, the long-term average duplication rate rdup used in Eqs. 2, 6 is in fact considerably lower than the raw duplication rate . An approximate way to
cal-culate it is to use power-law fits to Na(p) in the region II to extrapolate it up to 100%. Such extrapolated value
(100%) could then be used to calculate the
long-term average duplication rate as rdup/ = 2 (100%)/
(Ngenes∆p). (see the fifth column of Table 1).
Discussion and Conclusion
An estimate of the number of superfamilies in different genomes
Any sequence-based method is bound to miss similarities between some of the distant paralogs. The situation could be somewhat improved [7] if one compares proteins' three-dimensional structures which are conserved over longer evolutionary times. The addition of previously undetected paralogous pairs results in some of the sequence-based families merging together to form larger superfamilies. Our empirical observations allow us to esti-mate the number of such superfamilies contained in a given genome. Indeed, the fraction of paralogous pairs among all gene pairs in a genome consisting of NF
mutu-ally unrelated superfamilies is given by 1/NF. A rough esti-mate of NF is provided by extrapolation of the p-4 powerlaw into the Region III down to some cutoff PIDmin:
∂
∂ = ∂∂ + − +
∗ Na p t
t p N p ta r r N p ta r N
( , )
[2µ ( , )] (2dup 2del) ( , ) dup genesδδ(p−1)
∂
∂ = ∂∂ + − ∗ +
na p t
t p n p t r r n p t
r N
a a
( , )
[2µ ( , )] (2del 2del) ( , ) 2dup
geness−1δ(p−1)
(7)
µ
rdel∗
rdel∗ rdel∗ p/µ
rdel∗ /µ
−rdel∗ Ks/µs µs
rdel∗ /µs rdel∗ /µ
µ µ/ s
rdup∗
rdup∗
µ
rdup∗ /µ
rdup∗ /µs
rdup∗
rdel∗
rdup∗
Naext
µ Naext
N F=Ngenes Ngenes−
∫
Ap dp− PID( )
.
min
1 2
4 1
Here A is the best fit to Na(p) with the p-4 in the region II. Remarkably, the results of such calculation are roughly genome independent. Using the lowest theoretical limit PIDmin = 5% (the sequence identity of two unrelated sequences composed of 20 amino-acids) results in the effective number of superfamilies NF ranging between 4.7 in C. elegans and 9.9 in D. melanogaster. A more realistic limit PIDmin = 8% [7], which takes into account the non-uniform frequency among 20 amino-acids, somewhat increases the number of superfamilies to 36, 28, 31, 19, 40, and 35 for H. pylori, E. coli, S. cerevisiae, C. elegans, D. melanogaster, and H. sapiens correspondingly. These num-bers are still respectably small compared to NF ⯝ 1000 one gets by using the cutoff PIDmin = 25% imposed by the inadequacy of sequence-based methods to detect similar-ity of remote paralogs.
The exponent α in large individual families
The Gamma-distribution ~ µα-1 exp(-2µ/µ
0) was tradition-ally used to model and fit the distribution of substitution rates in individual families of proteins (this tradition goes back to [16]). Our approach extends this approach to a proteome-wide scale and demonstrates that beyond its role as a ad hoc fitting function the Gamma-distribution indeed provides an excellent quantitative description of variability of intra-protein substitution rates.
The genome-wide value of the exponent α ⯝ 0.33 obtained in our analysis is consistent with its previous estimates in large protein families. For example, the best fits with the Gamma-distribution performed in Refs. [9,10] resulted in the exponent α in the 0.2 – 0.4 range. The authors of Ref. [8] quantified the variability of substi-tution rates using a large set of orthologous proteins in different genomes (this should be contrasted with paralo-gous proteins used in our analysis). The fits with Gamma-distribution resulted in a broad range of exponents α for individual proteins. Still the distribution of exponents α peaks around 0.25 (solid histograms in the Fig. 4 of Ref. [8]).
In principle, our methods could be also applied to large individual families of paralogous proteins. However, only a few of the largest families in any genome contain suffi-cient number of paralogous pairs (up to F(F - 1)/2 in a family of size F) to have a meaningful individual Na(p) histogram. Fig. 5 shows the results of such analysis in C. elegans with individual curves corresponding to Na(p) in the 5 largest families of paralogous proteins. Without exception all these histograms are well fitted by Cp-γwith
γLF ⯝ 5 – 6. This corresponds to the exponent α⯝ 0.17 – 0.25, which is a somewhat lower than the exponent α= 0.33 that we observed for genomes as a whole.
Smaller individual families do not hold sufficient statisti-cal power to analyze the shape of Na(p). One approach would be to group them together by some shared charac-teristic (e.g. by their size, or by whether or not they con-tain an essential gene as described in Ref. [11]). However, the Na(p) histogram in such a group would depend on
additional parameters such as the rate of creation and removal of families of a given type and thus will not be amenable to our type of analysis. For example the collec-tion of families binned by their size would have addi-tional birth-and-death events due to whole families entering or leaving the selected bin. The rates of these processes would have a non-trivial dependence on the age of a family and thus cannot be easily incorporated into our mathematical framework.
It is important to emphasize once again that the exponent
α quantifies only the intra-protein variability of substitu-tion rates at different amino-acid posisubstitu-tions within indi-vidual proteins. Such variability should not be confused with a much larger protein-to-protein variability of aver-age substitutions rates. Indeed, sequences of different
pro-Correlation between the number of genes in an organism and its duplication/deletion rates
Figure 4
Correlation between the number of genes in an organism and its duplication/deletion rates. Evolution-ary parameters rdup/ (open diamonds), rdel/ (filled
cir-cles), (open squares), and (filled triangles)
plotted versus the total number of genes Ngenes in an organ-ism. Organisms in the order of increasing number of genes are H. pylori, E. coli, S. cerevisiae, D. melanogaster, C. elegans, and H. sapiens. As explained in the text, more complex organisms (those with larger Ngenes) tend to be characterized by higher values of the first three ratios but lower values of the last ratio.
103 104 105
10−2 10−1 100 101 102
Ngenes
r/
µ
µ µ
teins encoded in the same genome are known to evolve at vastly different rates (see [8,10] and references therein). Some sequences, such as e.g. those of ribosomal proteins, remain virtually unchanged over billions of years of evo-lution, while others change at a much faster pace. In fact, the very importance of a protein is sometimes quantified by its average rate of evolution as more essential proteins involved in core cellular processes tend to evolve at slower than average rates.
Genome size dependence and other properties of long- and short-term duplication and deletion rates
Our data indicate that the long-term duplication rate rdup is of the same order of magnitude as the long-term dele-tion rate rdel (see columns 5 and 6 in the Table 1). This is to be expected since any large discrepancy in these rates would generate much greater differences in genome sizes than actually observed in these model organisms. How-ever, as was proposed by [3], both of these rates are con-siderably smaller than their short-term ("raw")
counterparts and that include recently
dupli-cated proteins.
Our results for the fruit fly D. melanogaster are consistent with an earlier observation [15] of an abnormally low average duplication rate in this organism. According to
our data is about nine times lower than that in the
genome of C. elegans. The long-term stationary duplica-tion rate rdup/ in the fly is also the lowest in all eukary-otic genomes used in this study but is only three times lower than that in the worm.
Intriguingly, rdel/ , rdup/ , and ratios are all positively correlated with the complexity of the organism quantified by the total number of genes in its genome (see correspondingly filled circles, open diamonds, and open squares in Fig. 4). This means that either the per-gene duplication rate in more complex organisms is consist-ently higher than in their simpler counterparts or that their average amino-acid substitution rate is lower. It is likely that both above trends operate simultaneously. One possible explanation for the latter trend is that the more sophisticated mechanisms of DNA copying and repair of higher organisms lead to lower average amino-acid substi-tution rates.
On the other hand, we find that the deletion rate of recent
duplicates, , (filled triangles in Fig. 4) is negatively
correlated with the number of genes in the genome. This result is in agreement with Ref. [17] where this trend was attributed to the decrease in effective population size in more complex organisms.
The effects of whole genome duplications on the histogram of sequence identities
Two of the organisms used in our study (S. cerevisiae and H. sapiens) are characterized by a dramatically lower value of the power-law exponent γ (1.8 for yeast and 2.4 for human) and the overall poor quality of the power law fit to Na(p). One plausible explanation of this anomaly is in terms of Whole Genome Duplications (WGD) in lineages leading to these genomes. It is well established [18] that baker's yeast underwent a WGD event, which most likely occurred about 100 Myrs ago. While the subject remains controversial, it is also commonly believed that the verte-brate lineage leading to H. sapiens (among many other vertebrate genomes) also underwent one or several large-scale duplication events [19,20]. In the immediate after-math of a WGD event the PID distribution changes as
fol-rdup∗ rdel∗
rdup∗ /µ
µ
µ µ rdup∗ /µ
rdel∗ /µ
Histogram of sequence identities of individual families in the genome of C. elegans
Figure 5
Histogram of sequence identities of individual fami-lies in the genome of C. elegans. The histogram of amino acid sequence identities for pairs of paralogous proteins con-tained in each of the 5 largest families in the genome of C. ele-gans. Families in the order of decreasing size (measured by the number of proteins) are marked with green stars (243 proteins), cyan squares (188 proteins), red x's (162 proteins), brown triangles (105 proteins), and magenta +'s (73 pro-teins). Solid blue circles show the distribution of all paralo-gous pairs in the genome (as in Figure 1), while solid black diamonds – what is left after removing the above 5 largest families. Dashed line corresponds to a power law with the slope -4, while the solid one – the slope -5.
20 30 40 50 60 70 80 90100
100 101 102 103 104 105
AA sequence identity − PID
number of paralogous pairs − N
a
lows: Na(p) → 4Na(p) for p < 100%, while Na(100%) → 4Na(100%) + Ngenes. Indeed, every ancestral paralogous pair A-B would give rise to 3 new pairs with the same PID: A-B', A'-B, and A'-B'. At the same time the bin containing the PID = 100% would in addition get Ngenes (or fewer for a large segmental duplication) of freshly created dupli-cated pairs of the type A-A' and B-B'. The subsequent spread of this sharp peak at PID = 100% towards lower values of PID accompanied by a rapid deletion of redun-dant copies of duplicated genes would result in an effec-tive flattening of the Na(p) histogram in its upper range and thus in lower effective value of the exponent γ.
To further test this hypothesis we analyzed the recently sequenced genome [21] of a ciliate Paramecium tetraurelia. This organism underwent as many as four separately iden-tifiable WGD events [21]. We used our standard methods to construct the PID histogram Na(p) from the all-to-all alignment of its nearly 40,000 genes. Due to the sheer size of this proteome we employed the same conservative 10 -30 E-value cutoff we used for H. sapiens and C. elegans. Solid diamonds in the Fig. 6 correspond to the full PID histogram in Paramecium tetraurelia consisting of all 103,828 paralogous pairs detected by our methods. Authors of Ref. [21] identified the lists of putative pairs of duplicated genes generated in each of the four WGD events in the lineage leading to this genome. By dropping one randomly-selected gene from these WGD pairs we generated the set of four progressively more narrow PID histograms. These histograms are also shown in Fig. 6: 41,890 pairs excluding the genes generated in the latest WGD event (solid squares), 25,342 pairs excluding the genes generated in the last two WGD events (solid circles), 22287 pairs excluding the genes generated in the latest three WGD events (open triangles), and 21,417 pairs excluding the genes generated in all four WGD events (red stars). For comparison, the Fig. 6 also reproduces the his-togram of 31,078 pairs in the Na(p) of H. sapiens (blue ×-es). One can see that progressive elimination of pairs gen-erated in WGD events gives rise to the Na(p) histogram approaching the universal scaling form: Na(p) ~ p-4 (the dashed line in Fig. 6). Furthermore, the PID distribution of gene pairs generated in each of the WGD events has a shape that is qualitatively consistent with the predictions of our birth-and-death model. In particular, the gene pairs from the latest round of WGD did not have time to suffi-ciently diverge. As a result, their PID-distribution (shown in black in the Fig. 3a of the Ref. [21]) has a peak around 95% sequence identity with a half-maximum at 75%. The analysis of Paramecium tetraurelia genome provides an additional strong support to our conjecture that the unu-sually flat PID histograms in human and baker's yeast are caused by WGD events in lineages leading to these two organims.
Methods
The details of generating lists of paralogous proteins
The proteomes of H. pylori strain 26695 and E. coli strain K12-MG1655 were downloaded from the Comprehensive Microbial Resource (CMR) [22] version 1.0. Sequences of S. cerevisiae proteins are from the Saccharomyces Genome Database (SGD) [23] version number 20031001. The D. melanogaster's sequences are from the Berkeley Drosophila Genome Project [24], release 3.1. C. elegans – Wormbase [25], release WS127.H. sapiens – the NCBI database [26], build 34.1. The initial set of paralo-gous pairs for each of the organisms was identified by an all-to-all alignment of sequences of its proteins to each other using the BLASTP program [1]. For H. pylori, E. coli, S. cerevisiae, and D. melanogaster genomes, the E-value threshold of 10-10 was employed. This corresponds to
p-Histogram Na(p) of sequence identities and four rounds
Whole Genome Duplications (WGD) in Paramecium
tetraure-lia
Figure 6
Histogram Na( p) of sequence identities and four
rounds Whole Genome Duplications (WGD) in Para-mecium tetraurelia. The histogram of sequence identities of 103,828 paralogous pairs among 39,642 proteins in the genome of Paramecium tetraurelia (solid diamonds) detected by an all-to-all BLASTp alignment (see methods for details). Other histograms shown in this plot correspond to a pro-gressive removal of new proteins created in the four WGD events [21]: 41,890 pairs among 27,616 proteins excluding those generated in the latest WGD event (solid squares), 25,342 pairs among 23,618 proteins excluding those gener-ated in the last two WGD events (solid circles), 22,287 pairs excluding those generated in the latest three WGD events (open triangles), and 21,417 pairs among 22,635 proteins excluding those generated in all four known WGD events (red stars). For comparison we copy from Fig. 1A the histo-gram of 31,078 pairs among 25,319 H. sapiens proteins (blue
times-es). One can see that by progressive elimination of pairs generated in WGD events the functional form of the
Na(p) histogram in Paramecium tetraurelia approaches the uni-versal scaling form: Na(p) ~ p-4 (dashed line).
20 30 40 50 60 70 80 90 100 101
102 103 104 105
amino−acid sequence identity (PID)
number of paralogous pairs, N
a
(PID)
I II
values of the order of 10-12 (for H. pylori) and lower. Due to larger genome sizes of C. elegans and H. sapiens an even more conservative E-value of 10-30 was used to reduce the number of hits generated by the algorithm.
The "raw" datasets for worm, fly and human often contain multiple overlapping protein sequences predicted by dif-ferent gene models of the same gene (including but not limited to different splicing variants). To avoid spurious hits we first mapped entries in raw datasets to unique gene IDs. This was easy to accomplish in the fly and worm data-sets, where names of different gene models differ from each other by the last letter. In human genome, this was done by mapping the gi numbers of sequences in the raw dataset to unique GeneID (LocusLink) identifiers from the Entrez Gene database [27]. Subsequently, if multiple BLAST hits were connecting the same pair of gene IDs we kept the one with the longest aligned region. This way we were guaranteed that one and only one pair of splicing (or gene model) variants per pair of gene IDs would contrib-ute to the PID histogram.
In all genomes, only pairs in which the aligned region constituted at least 80% of the length of the longer protein were kept [15]. This excludes contribution from pairs of multi-domain proteins paralogous over only one of their domains.
Initially, the PID histogram in S. cerevisiae had two very sharp peaks at 51% and 70%. A close inspection revealed that these peaks are produced by evolutionary related sub-families of nearly identical transposable elements. To cor-rect for this obvious artifact in S. cerevisiae we removed 108 proteins encoded by known transposable elements listed in the Saccharomyces Genome Database [23] and their homologs.
The overall shape of the PID histogram in regions I and II is not sensitive to the E-value cutoff chosen. In Fig. 1S we show that when the E-value cutoff in the fly dataset was changed from a less conservative 10-10 to a more conserv-ative 10-30 value, the shape of the histogram above 40% remained virtually unchanged. Similarly, the results are nearly independent on the type of the BLOSUM substitu-tion matrix used (in the end we opted for the BLOSUM45.) Finally, we verified that our results are inde-pendent of the alignment algorithm utilized to calculate PIDs. Indeed, in the fly dataset we have recalculated PIDs for all paralogous pairs detected by BLAST using much more sophisticated Smith-Waterman algorithm [28]. The resulting histogram (shown as blue stars in Fig. 1S) is vir-tually indistinguishable from that based on the blastp output.
Numerical model of the proteome evolution
We numerically simulated a birth and death model mim-icking the evolution of a fixed-size proteome by duplica-tion, deletion and substitutions. We first randomly fill a 2,000 × 100 matrix with integer numbers ranging from 1 and 20 (20 types of "amino-acids"). This constitutes the initial state of our artificial genome/proteome, encoding 2,000 "proteins" of 100 "acids" each. Every amino-acid position in each of the proteins is randomly assigned the substitution rate µdrawn from a Gamma-distribution with α= 1/3. One evolutionary timestep consists of:
1. Duplicate a randomly selected gene in the genome and use this duplicated copy to replace another randomly selected gene (deletion). Thus in this model the deletion rate is exactly equal to the duplication rate.
2. Randomly pick 400 amino-acid positions in the whole genome and substitute amino-acids at those positions to a randomly selected new value. The probability of a par-ticular amino-acid position to be picked is proportional to its substitution rate µ.
This choice of parameters in our model corresponds to
. Indeed, the
average substitution rate per amino acid during one timestep is given by 400/(100 × 2000) = 1/500. It is equal to 0.25 of the per-gene per timestep duplication/deletion rate of 1/2000. In this artificial evolutionary process we have the advantage of keeping track of all the duplicated pairs. Thus, after each duplication event the list of all duplicated pairs is updated and can be directly read off. After repeating the above steps for 20,000 times the full genome alignment of all proteins is produced and stored. The distributions of duplicated and all paralogous pairs shown in Fig. 3 are generated by averaging over 20 such samples.
Identification of true duplicated (sibling) pairs by the Minimum Spanning Tree algorithm
We are naturally not in possession of the set of protein pairs that actually underwent duplication in the course of evolution of a given genome. The identification of the most likely candidates for these "true" duplicates is in gen-eral a rather complicated task which involves reconstruct-ing the actual phylogenetic tree for every family in a genome. However, we could make a much simpler edu-cated guess about past duplication events by connecting paralogous proteins in a given family with the Minimum Spanning Tree (MST) that is the tree maximizing the sum of PIDs along its edges (or, to agree with its name, mini-mizing its opposite sign value). For a family consisting of F proteins such tree has exactly F - 1 edges representing
our best guess about the actual duplication events. One can prove the truth of this by induction: when a freshly duplicated pair is created with PID = 100% it extends the previously existing Minimum Spanning Tree of a family by one edge. Assuming a constant rate of divergence for all paralogous pairs in a given family, the set of duplicated pairs would continue to form the Minimum Spanning Tree at all times. We used the Kruskal algorithm [29] to approximately detect the MST.
Detection of families of paralogous genes
Families of paralogous proteins used in Figure 5 are defined as mutually isolated clusters of proteins in the network in which paralogous pairs are connected by a link. Every two nodes within a family are either directly or indirectly connected to each other by at least one chain of paralogous links, while different clusters (families) are completely disconnected from each other. Because of our requirement for the length of the aligned region to be >80% of the length of the longest protein in a pair, all pro-teins within such families are rather homogeneous in their lengths.
Authors' contributions
SM and designed the study and its analytical framework. KKY acquired the genomic data and performed the sequence alignment. SM and KKY analyzed the results. JBA and SM wrote the manuscript. JBA performed numer-ical simulations of the model proteome and the MST algo-rithm. All authors read and approved the manuscript.
Reviewers comments
Reviewer 1: Eugene V Koonin, National Center for Biotechnology Information, National Institute of Health, Bethesda, Maryland, USA
This is quite an interesting, elegant study that presents a mathematical model connecting the distribution of per-cent sequence identity in paralogous protein families with the parameter of the gamma-distribution of intra-protein variability. The latter parameter had been explored before, and the values reported here are within the previously esti-mated ranges, but to my knowledge, this is the first work that derives this parameter theoretically from completely independent data. It is intriguing and, I suppose, impor-tant that the distributions of the identities between para-logs and, accordingly, the gamma-distribution parameter are almost genome-independent. It seems like the latter parameter is almost a "fundamental constant" that fol-lows from the physics of protein structure that is, of course, universal.
I have three comments that are rather technical but bear on the robustness and generality of the conclusions.
1. A trivial point ... but, I feel it would have been helpful to increase the number of analyzed genomes, both in terms of diversity, and by including more than one genome from each of the included lineages (and others). The analysis of sets of related genomes would (hopefully) demonstrate the robustness of the obtained distributions, and would also help assessing the significance of the dif-ferences in the exponents seen among genomes. In partic-ular, similar, flat distributions found in human and in yeast are somewhat strange given the huge difference in the size and complexity of these genomes. This is attrib-uted to the legacy of whole-genome duplications but I find that explanation dubious. Traces of this duplication in yeast and, especially, in vertebrates are very weak. Including more genomes would help to clarify this issue. The reported genome analysis is very simple, it cannot be computationally prohibitive.
Authors response
We agree that extending our analysis to include more genomes is fairly straightforward. However, we want to save the subject of lineage-dependence of the exponent γ (apart from that related to Whole Genome Duplications (WGD)) for future studies and to report it in a separate publication. To check our hypothesis that WGD are responsible for unusual profile of the PID-histograms in human and yeast we analyzed the genome of Paramecium tetraurelia. The lineage leading to this organ-ism underwent as many as four separately identifiable WGD events. The results of our analysis presented in Fig. 6 and the accompanying section of the manuscript have beautifully con-firmed our initial hypothesis: while the all-to-all Na(p)
histo-gram in the whole proteome of Paramecium tetraurelia (solid diamonds in Fig. 6) has an unusually flat profile similar to the one we saw in human (blue ×-es in Fig. 6), the removal of pro-teins generated in WGD events results in a stepper PID-histo-gram (red stars in Fig. 6) which is in excellent agreement with the universal p-4 functional form (dashed line in Fig. 6). This provides necessary support to our original conjecture that unu-sually flat PID histograms in human and baker's yeast are also due to (possibly less obvious) duplicated pairs of proteins gener-ated in WGD events in these two lineages.
2. The mathematical model developed in the paper is a typical birth-and-death model. I wonder why the phrase is not used (it would immediately clarify the matter to those familiar with the field) and some of the relevant literature is not cited.
Authors response
We have modified our notation to incorporate this comment. We also cited the appropriate literature on birth-and-death models [4-6].