HELGOLANDER MEERESUNTERSUCHUNGEN Helgol~inder Meeresunters. 43,489--499 (1989)
O n t r e n d s in n u t r i e n t c o n c e n t r a t i o n in t h e n o r t h e r n
W a d d e n S e a of Sylt*
Peter Martens
Biologische Anstalt Helgoland, Wattenmeerinstitut List;
D-2282 List/Sylt, Bundesrepublik Deutschland
ABSTRACT: The mean values on hydrographical parameters in the Wadden Sea of Sylt taken weekly over a period of seven years (1975, 1978 and 1984 to 1988) were compared in order to detect trends in concentrations of nutrients or plankton. An increase in NO2, NO3, PO4 and Si could be found in summer. NH4 showed a negative trend. Corresponding with the rising nutrient-level, chlorophyU-a and pH show a positive trend. Salinity decreased significantly. Changes in NH4 and NO2 were correlated with rainfall.
INTRODUCTION
The n o r t h e r n W a d d e n Sea of Sylt lies east of the n o r t h e r n part of the i s l a n d of Sylt; it is s e p a r a t e d from other parts of the W a d d e n Sea by two dams a n d is c o n n e c t e d with the North Sea only b y a relatively n a r r o w tidal inlet, the Lister Deep (Fig. 1). M e a s u r e m e n t s on the biological o c e a n o g r a p h y of this part of the W a d d e n Sea h a v e b e e n p e r f o r m e d since 1972. Several p u b l i c a t i o n s (Hickel, 1980, 1983, 1989; Martens, 1980, 1981, 1982, 1986a, 1986b) deal with the hydrography, phyto- a n d z o o p l a n k t o n of this area.
Since Radach & Berg (1986) have s h o w n a n i n c r e a s i n g positive t r e n d in the n u t r i e n t c o n c e n t r a t i o n in the G e r m a n Bight a n d Hickel (1989) suggests a n i n c r e a s e in p h o s p h a t e - c o n c e n t r a t i o n i n the n o r t h e r n W a d d e n Sea of Sylt, a comparison of the v a l u e s t a k e n over 6 years was carried out to verify trends i n various h y d r o g r a p h i c a l parameters.
MATERIALS AND METHODS
From M a y 1975 onwards, m e a s u r e m e n t s have b e e n p e r f o r m e d twice a week, if possible, ( d e p e n d i n g on w e a t h e r conditions), on the following h y d r o g r a p h i c a l p a r a m e - ters (for position of station Lister Ley see Fig. 1):
(1) w a t e r t e m p e r a t u r e (reversing t h e r m o m e t e r ; __ 0.05 ~ (2) salinity (Autosal 8400a Salinometer; ___ 0.001 S) (3) PO4 (after GraBhoff, 1976)
(4) NH4, NO2 a n d NO3 (after Graghoff, 1976) (5) Si (after Graghoff, 1976)
" Presented at the VI International Wadden Sea Symposium (Biologische Anstalt Helgoland, Wattenmeerstation Sylt, D-2282 List, FRG, 1-4 November 1988)
4 9 0 P e t e r M a r t e n s
G e r m a n B i g h t
O~
.ii i!i 8 ~ 2 O" 8 ~ 3 0 '
N u t r i e n t c o n c e n t r a t i o n in the n o r t h e r n W a d d e n Sea 491 (6) chlorophyll-a ( U N E S C O - s t a n d a r d - m e t h o d )
(7) daily rainfall (Deutscher Wetterdienst, Wetterstation List).
The analyses were carried out on discrete w a t e r s a m p l e s t a k e n with T P N - w a t e r s a m - piers n e a r the surface. Strong t u r b u l e n c e p r e v e n t s stratification i n these w a t e r s (Hickel, 1975; Martens, u n p u b l , data).
M a t h e m a t i c a l p r o c e d u r e s
B e t w e e n 1975 a n d 1988, s e v e n years w e r e chosen for statistical analysis w h e r e r e g u l a r m e a s u r e m e n t s from the s a m e station were available (1975, 1976 a n d 1984-1988). Sets of data were tested for d e v i a t i o n from n o r m a l distribution b y Chi2-test, R/s-test a n d KS-test, a n d log-transformed w h e n necessary.
Simple regression analyses were performed to show l i n e a r trends i n the c o n c e n - tration of the p a r a m e t e r s m e a s u r e d . To verify significant t r e n d s (P < 0.05), partial correlation analyses were performed to ascertain a n i n f l u e n c e of time on the c o n c e n - tration of the p a r a m e t e r s w h e n the tidal i n f l u e n c e (temperature a n d salinity) was e h m i n a t e d .
As some of the sets of data s h o w e d significant deviation from the n o r m a l distribution in at least one of the tests used, a S p e a r m a n - R a n k - c o r r e l a t i o n w a s carried out to verify significant findings.
Finally, a stepwise variable selection was performed for all p a r a m e t e r s that h a d s h o w n a significant trend. If, i n addition to the m e t h o d s m e n t i o n e d above, the a d d i t i o n of the time-factor to the p r e d i c t i o n - m o d e l gave a significantly better result (F-test), a positive or n e g a t i v e t r e n d was assumed.
T h e statistical analyses were performed with STATGRAPHICS Statistical Graphics System version 2.6.
RESULTS
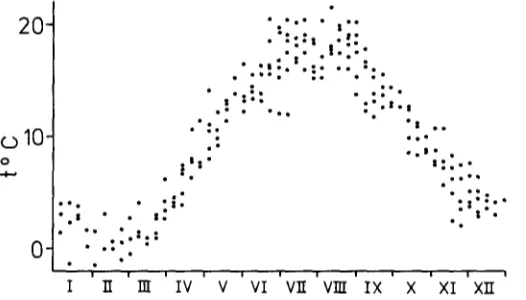
Figure 2 gives the water t e m p e r a t u r e d u r i n g the a n n u a l cycle for all 6 years. Little variability is to b e s e e n in contrast to salinity (Fig. 3).
To ascertain trends (decrease or increase) in this or other p a r a m e t e r s , the d a t a were
20 ~
o10-
0
O.
9 9 " | ' 9
"~:~,.,.::.
9 | 9
9 .,:..:... :.
9 I 0 |
, z~: : ' . i . ,
|2z"
s : . . .9
s:
"'.::~'~
| ! , , e , e , , s e ,
TIT IV V VI V ~ V H IX X XI X ~
492
P e t e r M a r t e n sO3 - 4 "
r (3 t/1
32 t
9 : t ' - : :o 9 | * 9 9 1 4 9 1 4 9 1 4 9 9 1 4 9 1 4 9
2g-
....:1". ; ' ' ' . "
"." " . ' . . .
"'-i:~..
* * ' - ' : " ,
. : ":26-
Q 0I I
2 3
,
. . .
I ]I ]]I IV V VI Vll VIII IX X Xl XII
Fig. 3. Salinity S in the Wadden Sea of Sylt. Annual cycle over six years of investigation
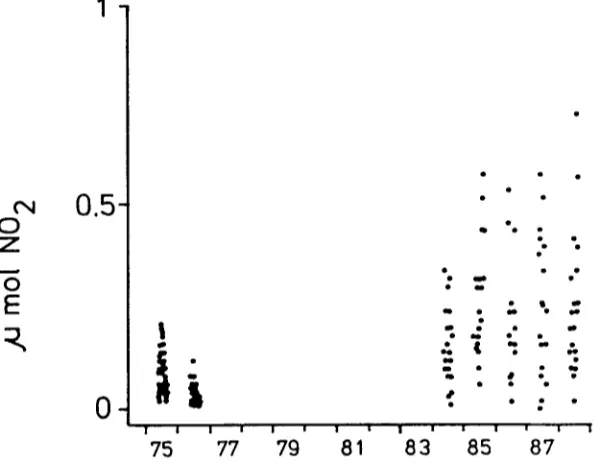
g r o u p e d a c c o r d i n g to d i f f e r e n t " e c o l o g i c a l s e a s o n s " ; t h e s e w e r e w i n t e r ( D e c e m b e r 15 th to M a r c h 15th), s p r i n g ( M a r c h 15 th to M a y 31st), n u t r i e n t s u m m e r - m i n i m u m ( J u n e I st to A u g u s t 31 st) a n d z o o p l a n k t o n s u m m e r / a u t u m n - m a x i m u m ( J u n e I 5 th to S e p t e m b e r 31st). N e a r l y all n u t r i e n t s m e a s u r e d s h o w a p o s i t i v e t r e n d f r o m 1975 to 1988, as c a n b e s e e n in F i g u r e s 4 to 7 a n d T a b l e 1.
NO2 (Fig. 4) s h o w s a n i n c r e a s e of at l e a s t 300 % f r o m t h e m i d - s e v e n t i e s to 1988; t h e s a m e is t r u e for NO3 (Fig. 5) w h i c h s h o w s c o n c e n t r a t i o n s of u p to 12 ~ g a t 1-1 in s u m m e r , v a l u e s w h i c h w e r e r e a c h e d o n l y in w i n t e r 10 y e a r s a g o .
CN
0
Z
m
0
E
0.5
0
Q o 9 9
o
o 9 9
o
. . : . ,
,."
[ i
"
J I I l I ! l ~ | a 1 [ 1 ~ i
75
77
7g
81
8 3
85
8 7
N u t r i e n t c o n c e n t r a t i o n i n t h e n o r t h e r n W a d d e n S e a 493
co
O
Z
o
E
1 2 -
_
0
Q m I
9 l
I I I I I I I 1 I I I I I I I
75
77
79
81
83
85
87
Fig, 5, NO3 irt #gat 1-1 in d if f e r e n t years in summer. X - a x i s = y e a r Y-axis = NO3
6
. 4
3
O
n
o
E
0
9 9 9 S
:.
.
9
.
.:
i!
*!
I i I ! i ! I a i ! I I | I
75
77
79
81
8 3
85
87
494 Peter M a r t e n s
O
E
1 2 -
9 9
i.
:
9
0
I | ! ! ! ! I ! I ! i I l | I
75
77
79
81
83
85
87
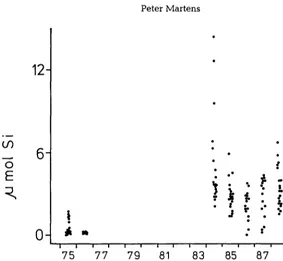
Fig. 7. Si in ~gat 1-1 in different years in summer. X-axis = year. Y-axis = Silicate
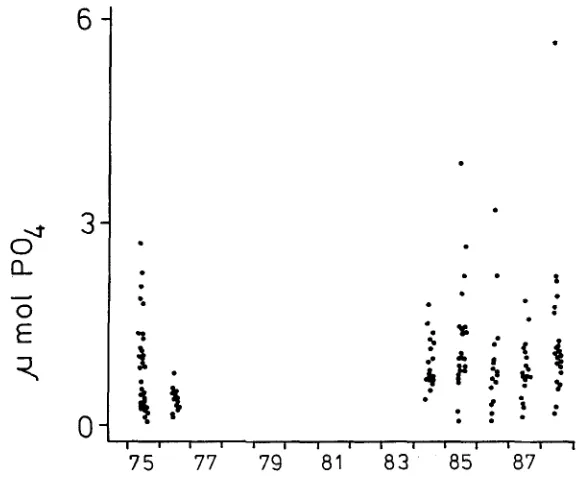
T h e c h a n g e s i n PO4-concentration are not so drastic (Fig. 6) as those i n silicate (Fig. 7) w h i c h shows m i n i m a of less t h a n 1Bgat 1 - t only on o n e or two days d u r i n g the year.
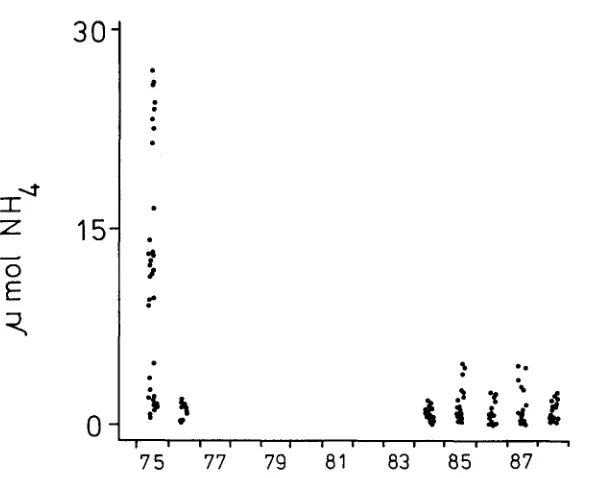
NH4 is the only n u t r i e n t m e a s u r e d which s h o w e d a n e g a t i v e t r e n d over the years (Fig. 8). This is d u e to very high v a l u e s in the m i d - s e v e n t i e s a n d a shift in the relation of N H 4 - N O 2 - N O 3 , as c a n be s e e n b y a c o m p a r i s o n of Figures 4, 5 a n d 8.
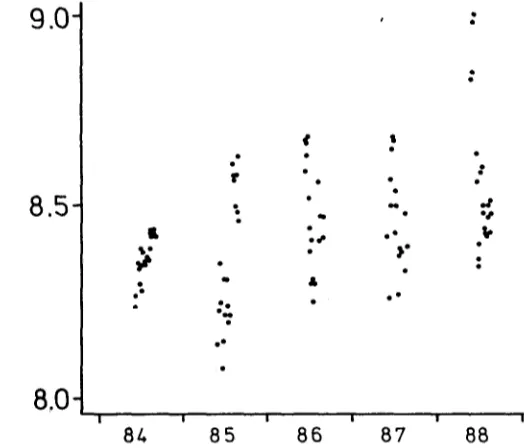
For chlorophyll a n d pH, m e a s u r e m e n t s started as late as 1984. N e v e r t h e l e s s , signifi- c a n t positive t r e n d s could b e a s c e r t a i n e d for both p a r a m e t e r s as c a n b e s e e n b y T a b l e 1 a n d Figures 9 a n d 10.
A stepwise v a r i a b l e selection analysis (Table 2) s h o w e d (besides t h e i n f l u e n c e of time) the n e g a t i v e relation b e t w e e n chlorophyll-a, NH4 a n d t e m p e r a t u r e .
No i n f l u e n c i n g factors besides time could be a s c e r t a i n e d for p H (Table 2).
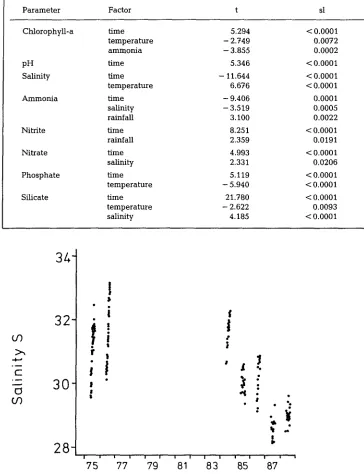
Si, NH4 a n d NO3 show a significant correlation (negative in NH4 a n d positive in Si a n d NO3) with salinity (Table 2), which itself has d e c r e a s e d drastically i n s u m m e r d u r i n g the past years (Fig. 11) in close relation with t e m p e r a t u r e (Table 2).
DISCUSSION
Up to the m i d - s e v e n t i e s , the W a d d e n Sea of Sylt was a n area w h i c h w a s far less e u t r o p h i c a t e d t h a n c o m p a r a b l e areas in the Dutch W a d d e n Sea. T h e W a d d e n Sea of Sylt h a d distinct n u t r i e n t m i n i m a d u r i n g s u m m e r (Hickel, 1989), w h e r e a s the D u t c h W a d d e n Sea s h o w e d p h o s p h a t e - m a x i m a d u r i n g this season (de J o n g e & Postma, 1974).
:E
Z
O
E
N u t r i e n t c o n c e n t r a t i o n i n t h e n o r t h e r n W a d d e n S e a
3 0
1 5
9 9 e e
0
"
I ! u u , 1 r m l m m m , .
75
77
79
81
83
85
87
Fig. 8. NH4 in ggat 1 -t in different gears in summer. X-axis = gear. Y-axis = NH4 495
Table 1. A -- Correlation-coefficient for the relation b e t w e e n time a n d the different parameters, in brackets probability P. B = S p e a r m a n - R a n k correlation coefficent for the relation b e t w e e n time a n d the different parameters, in brackets probability P. C = Partial correlation coefficient for the relation b e t w e e n time a n d the different parameters; the influence of t e m p e r a t u r e a n d salinity excluded; in
brackets probability P
P a r a m e t e r A B C
Chlorophyll-a 0.410 (0.00003) 0.353 (0.0005) 0.355 (<0.001)
pH ().463 (0.00001) 0.488 (0.0001) 0.265 ( 0.01)
Salinity - 0.618 (0.00001) - 0.374 (0.0001) - -
A m m o n i a - 0 . 4 1 0 (0.00001) - 0 . 5 2 2 (0.0001) - 0 . 5 1 1 (<0.001)
Nitrite 0.492 (0.00001) 0.356 (0.0001) 0.346 (<0.001)
Nitrate 0.245 (0.00009) 0.250 (0.0001) 0.319 (<0.001)
P h o s p h a t e 0.320 (0.00001) 0.178 (0.0053) 0.196 (<0.001)
Silicate 0.702 (0.00001) 0.633 (0.0001) 0.813 (<0.001)
a b o u t f o u r t i m e s h i g h e r i n t h e W a d d e n S e a of Sylt, a s s h o w n b y H i c k e l (1989) w h o m e n t i o n s t h e p o s s i b l e i n f l u e n c e of c l i m a t i c d i f f e r e n c e s b e t w e e n t h e s e y e a r s .
4 9 6 P e t e r M a r t e n s
m
E
- 0
cJ
I
r - (J
E~
50
25
0
e l 9
,,,"
I I I I I I
8~
85
86
87
88
Fig. 9. C h l o r o p h y l l - a i n ~tg 1 -I i n d i f f e r e n t y e a r s i n s u m m e r . X - a x i s = y e a r . Y - a x i s = C h l o r o p h y l l - a
: E
CL
9.0-
8.5
8,0
e 9
f 9
9 9
I 9 1 4 9 %"
, " A
I I I I I I
8l.
8 5
8 6
8 7
88
N u t r i e n t c o n c e n t r a t i o n i n t h e n o r t h e r n W a d d e n S e a 4 9 7
T a b l e 2. List of p a r a m e t e r s of significant i n f l u e n c e (P < 0.05) on the different p a r a m e t e r s m e a s u r e d , d e r i v e d from a s t e p w i s e v a r i a b l e selection. Factor = P a r a m e t e r of significant i n f l u e n c e , t = R e g r e s s i o n c o e f f i c i e n t / s t a n d a r d error, sl = significance level for the t-value (the p r o b a b i l i t y t h a t a l a r g e r a b s o l u t e t - v a l u e w o u l d occur if t h e r e w e r e no m a r g i n a l contribution f r o m t h a t p a r a m e t e r )
P a r a m e t e r Factor t sl
C h l o r o p h y l l - a time 5.294 < 0.0001
t e m p e r a t u r e - 2.749 0.0072
a m m o n i a - 3.855 0.0002
p H time 5.346 < 0.0001
Salinity time - 11.644 < 0.0001
t e m p e r a t u r e 6.676 < 0.0001
A m m o n i a t i m e - 9.406 0.0001
salinity - 3.519 0.0005
rainfall 3.100 0.0022
Nitrite time 8.251 < 0.0001
rainfall 2.359 0.0191
Nitrate time 4.993 < 0.0001
salinity 2.331 0.0206
P h o s p h a t e time 5.119 < 0.0001
t e m p e r a t u r e - 5.940 < 0.0001
Silicate time 21.780 < 0.0001
t e m p e r a t u r e - 2.622 0.0093
sahnity 4.185 < 0.0001
cO
> . , c "
E~
(/3
34.-
3 2 -
3 0
2 8 84
!
I,
i
i
11
|
i
r i
; I
!II
$ |!
! ' ,(%
II
P I ! i i ! i i i I I | | I |75
77
79
81
83
85
87
498 Peter M a r t e n s
T h e m a g n i t u d e of w a t e r e x c h a n g e b e t w e e n the W a d d e n Sea of Sylt a n d the G e r m a n Bight of a b o u t 7 % p e r tide (Hickel, 1980) m a k e s it r a t h e r likely that t h e i n c r e a s e of n u t r i e n t s i n the G e r m a n Bight w o u l d show up i n the W a d d e n Sea as well. This is s h o w n here for NO2, NO3, PO4 a n d Si a n d a s i g n i f i c a n t i n f l u e n c e of rainfall could b e d e m o n - strated d u r i n g s u m m e r m o n t h s on n i t r o g e n c o m p o u n d s . T h e r e are at least two possible explanations.
M e a s u r e m e n t s b y the "Niedersachsische L a n d e s a m t fiir Wasserwirtschaft" (Rost, 1987) h a v e s h o w n that n e a r the i s l a n d N o r d e r n e y rain contains a b o u t 80 ~gat N 1-1 (1.6 m g NO3 a n d 0.9 m g NH4). T h e W a d d e n Sea of Sylt e x t e n d s over a n area of a b o u t 419 k m 2. A typical r a i n y s u m m e r c a n l e a d to a rainfall of a b o u t 20 1 w e e k -1 m -2, as h a s b e e n s h o w n b y m e a s u r e m e n t s b y the "Deutscher Wetterdienst, Wetterstation List". If w e a s s u m e that rain at Sylt contains as m u c h n i t r o g e n as r a i n at Norderney, this w o u l d l e a d to a w e e k l y i n p u t of 6.7 x 10¹¹ ~gat N for the whole area. T h e v o l u m e of the W a d d e n S e a is a b o u t 8.45 • 1011 liters. Thus rainfall is r e s p o n s i b l e for a n i n c r e a s e of a b o u t 0.15 ~gat N 1-1 day -1. This is 20 % to 30 % of the actual n i t r o g e n c o n t e n t i n s u m m e r a n d m a y b e a possible e x p l a n a t i o n for the significant correlation b e t w e e n n i t r o g e n a n d rainfall.
This relation b e t w e e n n i t r o g e n a n d rainfall was only true for NH4 a n d NO2, not for NO~ w h i c h w a s positively related to salinity i n contrast to the other n i t r o g e n c o m p o u n d s . P r e s u m a b l y , NO3 enters the W a d d e n Sea area b y tidal w a t e r m o v e m e n t s ; t h e s a m e holds true for silicate. Radach & Berg ( 1 9 8 6 ) h a v e s h o w n that Elbe discharge has i n c r e a s e d significantly over the last 23 years, as has the n i t r o g e n - c o n c e n t r a t i o n in the H e l g o l a n d Bight.
Hickel has s h o w n that the Elbe has a significant i n f l u e n c e o n the W a d d e n Sea of Sylt which is 6 times as h i g h as the i n f l u e n c e b y local freshwater inflow. Thus, a n i n f l u e n c e b y i n c r e a s e d Elbe discharge with its n u t r i e n t - l o a d on th4 W a d d e n Sea is v e r y likely.
T h e significant n e g a t i v e correlation b e t w e e n p h y t o p l a n k t o n (chlorophyll-a) a n d NH4 is t h o u g h t to reflect the u p t a k e of n i t r o g e n d u r i n g algal growth; Si- a n d PO4-concen- trations are too high to b e i n f l u e n c e d b y the small a m o u n t of p h y t o p l a n k t o n c o m p a r e d to the b e n t h i c microflora.
W h a t c a n clearly b e s e e n from the p r e s e n t p a p e r is the strong v a r i a b i l i t y of the p a r a m e t e r s m e a s u r e d w i t h i n the W a d d e n Sea area. O n l y d u r i n g the s e a s o n of least variability (summer), could a t r e n d in the c o n c e n t r a t i o n s b e verified for s o m e parameters. Longer time series are n e e d e d to prove t r e n d s d u r i n g other seasons a n d for other parameters.
O n the other hand, it seems s o m e w h a t a l a r m i n g that, e v e n in areas of great n a t u r a l variability, a positive t r e n d i n n u t r i e n t c o n c e n t r a t i o n could b e found.
Acknowledgements.
Thanks are due to the staff of the Wetterstation List of the Deutsche Wetter-dienst for meteorological data, to C. Reineke and the crew of F. K. Mya for technical assistance, and to K. Reise for valuable comments on the paper.
LITERATURE CITED
Grasshoff, K., 1976. Methods of seawater analysis. Verl. Chemie, Weinheim, 317 pp.
N u t r i e n t c o n c e n t r a t i o n i n t h e n o r t h e r n W a d d e n S e a 499
Hickel, W., 1980. The influence of Elbe River water on the W a d d e n Sea of Sylt (German Bight, North
Sea). - Dt. hydrogr. Z. 33, 43-52.
Hickel, W., 1983. Seston in the W a d d e n Sea of Sylt (German Bight, North Sea). - Publ. Ser. Neth.
Inst. Sea Res. 10-1984, 113-131.
Hickel, W., 1989. Inorganic micronutrients in relation to phytoplankton a n d the eutrophication in the W a d d e n Sea of Sylt (German Bight, North Sea). - Proceedings of the 21 st E u r o p e a n Marine Biology Synposium, Gdansk, Poland (in press).
Jonge, V. N. de & Postma, H., 1974. Phosphorous compounds in the Dutch W a d d e n Sea. - Neth. J. Sea Res. 8, 139-153.
Lucht, F. & Gfllbricht, M., 1978. Long-term observations on nutrient contents n e a r Helgoland in
relation to nutrient input of the river Elbe. - Rapp. P.-v. R4un. Cons. int. Explor. M e t 172,
358-360.
Martens, P., 1980. Beitr&ge zum M e s o z o o p l a n k t o n des Nordsylter Wattenmeers. - H e l g o l & n d e r Meeresunters. 34, 41-53.
Martens, P., 1981. On the Acartia species of the n o r t h e r n Wadden Sea of Sylt. - Kieler Meeresforsch. (Sonderh.) 5, 153-163.
Martens, P., 1982. Zur Biologie des Planktons des KSnigshafens (Nordsylter Wattenmeer). - H e l g o - ]&nder Meeresunters. 35, 243-251.
Martens, P., 1986a. Short-term fluctuations in h y d r o g r a p h i c parameters during a declining
Phaeocystis-bloom in M a y 1984. - Annls biol., Copenh. 41, 4?-49.
Martens, P., 1986b. On the h y d r o g r a p h y of the north Fzisian Wadden Sea in June 1984. - Annls biol.
Copenh. 41, 46-47.
Radach, G. & Berg, J , 1986. Trends in d e n Konzentrationen der N~ihrstoffe u n d des Phytoplanktons in der Helgol~inder Bucht (Helgoland Reede Daten). - Ber. Biol. Anst. Helgoland 2, 1-63. Rost, J., 1987. Stoffeintrag durch Niederschl~ige. In: Umwelt Vorsorge Nordsee. Ed. by W. Remmers.
Nieders~chs. Umweltmin., Hannover, 366 pp.