HELGOLJkNDER MEERESUNTERSUCHUNGEN Helgol~inder Meeresunters. 47, 243-263 (1993)
The human impact in the German Bight: Eutrophication
during three decades (1962-1991)
W. Hickel, P. Mangelsdorf & J. Berg
Biologische Anstalt Helgoland, Notkestr. 31, D-22607 Hamburg,
Federal Repubh'c of Germany
ABSTRACT: The h u m a n impact in the G e r m a n Bight, in the form of a n t h r o p o g e n i c eutrophication, has b e e n d o c u m e n t e d b y a 30-year time-series m e a s u r e m e n t n e a r the island of Helgoland. Since 1962, the Biologische Anstalt Helgoland has m e a s u r e d inorganic nutrients a n d p h y t o p l a n k t o n a b u n d a n c e from daffy samples at Helgoland Roads, a position 60 k m off the m a i n source of eutrophication, the River Elbe. Since the early 'sixties, p h o s p h a t e concentrations rose for a b o u t a decade, levelling off to about twice the former concentrations for a n o t h e r decade, a n d t h e n d e c r e a s i n g (since 1982) as a result of p h o s p h a t e - r e d u c i n g measures. Nitrate concentrations, how- ever, h a v e only i n c r e a s e d since 1980/81, following Elbe river flood events. In 1987, t h r e e times the former concentrations were reached. A decrease h a s b e e n o b s e r v e d only since 1991. This different d e v e l o p m e n t of p h o s p h o r u s a n d nitrogen eutrophication led to a shift of inorganic N/P-ratios in the G e r m a n Bight. T h e p h o s p h a t e increase was more p r o n o u n c e d in t h e late s u m m e r " r e g e n e r a t i o n m o d e " conditions, the nitrate increase in the winter months. The eutrophication is not restricted to the i n n e r G e r m a n Bight a n d coastal waters of a salinity of < 33, but has also occurred in more saline waters at S > 33 psu (practical salinity unit), as characteristic for the outer G e r m a n Bight. In this more saline water, p h o s p h a t e a n d nitrate m a x i m u m levels occurred t h r e e years later, c o m p a r e d with the a v e r a g e H e l g o l a n d data, w h i c h are more r e p r e s e n t a t i v e of the i n n e r G e r m a n Bight. It is s u g g e s t e d that s u s p e n d e d particulate organic matter, as a long-distance carrier of nutrients, m i g h t h a v e c a u s e d this d e l a y e d eutrophication in the outer G e r m a n Bight waters. While the h u m a n i m p a c t is obvious as to n u t r i e n t concentrations, it is less obvious in p h y t o p l a n k t o n stock e n h a n c e m e n t . A g e n e r a l increase in p h y t o p l a n k t o n biomass (about 3-4 times) was found, b u t this was mainly due to unidentified nanoflagellates of u n k n o w n trophic state, a n d subject to methodological errors. The causal relation- ships of p h y t o p l a n k t o n stocks and eutrophication are not clearly understood, as natural variability is large a n d hydrographical factors possibly dominate. Additional n u t r i e n t input by Elbe river floods did not always result in elevated p h y t o p l a n k t o n stocks n e a r Helgoland, while e x t e n d e d periods of vertical density stratification of the G e r m a n Bight w a t e r c a u s e d large p l a n k t o n blooms.
I N T R O D U C T I O N
T h e h u m a n i m p a c t i n t h e G e r m a n B i g h t d e p e n d s n o t o n l y o n t h e l o c a l r i v e r i n e i n p u t s , b u t a l s o o n t h e v o l u m e of t h e c o a s t a l w a t e r a n d o n t h e r e s i d u a l c u r r e n t s y s t e m of t h e s o u t h e r n N o r t h S e a . T h e p o s i t i o n of t h e e s t u a r i e s of t h e m a i n r i v e r s t h a t d r a i n c e n t r a l E u r o p e , a l o n g w i t h t h e c o u n t e r c l o c k w i s e r e s i d u a l c u r r e n t p a t t e r n w h i c h c a r r i e s r i v e r - b o r n e s u b s t a n c e s f r o m w e s t to e a s t , f a v o u r t h e a c c u m u l a t i o n of e u t r o p h y i n g s u b s t a n c e s i n t h e G e r m a n B i g h t . L o c a l a n d d i s t a n t s o u r c e s , a n d t h e r e l a t i v e l y s m a l l w a t e r v o l u m e m a k e t h e s h a l l o w G e r m a n B i g h t a m a j o r ( a n d p r o b a b l y t h e m o s t e x t e n s i v e ) e u t r o p h i e d a r e a of t h e N o r t h S e a . R e v i e w s s u c h a s G e r l a c h (1990), B r o c k m a n n e t al. (1988), a n d N e h s s e n & S t e f e l s (1988) d e s c r i b e t h e h y d r o g r a p h i c a l a n d n u t r i e n t s i t u a t i o n of t h e s o u t h e r n N o r t h S e a .
244 W. H i c k e l , P. M a n g e l s d o r f & J. B e r g
S i n c e 1962, t h e B i o l o g i s c h e A n s t a l t H e l g o l a n d h a s c o n t i n u o u s l y m e a s u r e d i n o r g a n i c n u t r i e n t s a n d p h y t o p l a n k t o n n e a r H e l g o l a n d , a s m a l l i s l a n d i n t h e G e r m a n B i g h t (Fig. 1), a b o u t 60 k m n o r t h w e s t of t h e E l b e r i v e r e s t u a r y , w h i c h is t h e m a i n s o u r c e of f r e s h w a t e r .
7 0 8 0 9 ~
J [ J I I ' J + i i I I ~m,.,, I~ J i'...|'::. I.. I i i-':- 9 i , I I I I
r" t C-.
i
~.j.i
S \ )
'..
,.
("
;:::::::
"5
"',
"',
5 5 ~
)
, *~ ~5 o':"-.. r ... "~o"" ~"-,
\
'\
-._
....
\
Z ; i l
"
\
".f-~
t , . t f
" ,
/ 7 ~..~
\ " A .
3zs
\x'X...~
"\\ f
5 r
... ~o .... .
;
12o-~
- / _ . . - 5 4 ~
, . <- . . . - . < . . . ? : = ; - ! . . - . . . c-"", ""<'"q,. r S'~" ... ::::, "-.. : C..~ ,1-. ".,'u..x. ~..- " . ... ,.:, '... "..
. --> "-.b ... 4o-: ... i ~
7 o 8 ~ 9 ~
Fig. 1. T h e G e r m a n Bight with the island of H e l g o l a n d (monitoring station). Sahnity isopleths show the Elbe river w a t e r p l u m e after a flood e v e n t in 1954 (Kalle, 1956}, depicting the typical situation of
E u t r o p h i c a t i o n in the G e r m a n Bight 245
F i g u r e 1 i n c l u d e s the isopleths of surface salinities, w h i c h s h o w the c h a r a c t e r i s t i c s p r e a d i n g of the Elbe river w a t e r p l u m e after a l a r g e river flood event. This e x a m p l e from Kalle (1956) w a s c h o s e n b e c a u s e of the close s p a c i n g of s a m p l i n g stations, o p t i m a l l y c o v e r i n g the river plume. This flood e v e n t shows that the river p l u m e e x t e n d s b e t w e e n the p e n i n s u l a of E i d e r s t e d t a n d t h e i s l a n d of H e l g o l a n d ; the H e l g o l a n d Roads s a m p l i n g station is easily r e a c h e d b y the river p l u m e , s h o u l d the w i n d t u r n to a n e a s t e r l y direction. T h e H e l g o l a n d Roads t i m e - s e r i e s is one of the l o n g e s t - a n d c e r t a i n l y t h e o n e with t h e shortest t i m e - i n t e r v a l s - of t h e d a t a sets from the N o r t h Sea; it p r o v i d e s a n a d e q u a t e d a t a set to d e s c r i b e a n d e v a l u a t e the e u t r o p h i c a t i o n process in the G e r m a n Bight. The H e l g o l a n d d a t a h a v e b e e n a n a l y z e d b y Lucht & Gillbricht (1978) with r e s p e c t to n u t r i e n t s in r e l a t i o n to Elbe river input, a n d H a g m e i e r (1978) for the p h y t o p l a n k t o n u p to 1974. Gillbricht (1983) i n v e s t i g a t e d a p l a n k t o n b l o o m e v e n t a n d he also (1988) a n a l y z e d n u t r i e n t a n d p h y t o p l a n k t o n d y n a m i c s u p to 1986. R a d a c h & Berg (1986) a n d R a d a c h et al. (1990) u s e d t h e d a t a u p to 1984 for t r e n d a n a l y s e s ; R a d a c h & B o h l e - C a r b o n e l l (1990) a n a l y z e d the structure a n d v a r i a b i l i t y of the H e l g o l a n d d a t a a l o n g with m e t e o r o l o g i c a l data.
M a j o r c h a n g e s in n u t r i e n t c o n c e n t r a t i o n s a n d ratios h a v e o c c u r r e d d u r i n g t h e last d e c a d e - not c o v e r e d b y the a b o v e p u b l i c a t i o n s - in the G e r m a n Bight. T h e s e w e r e obviously a result of h u m a n i n t e r f e r e n c e . T h e p r e s e n t p a p e r d e s c r i b e s t h e c h a n g e s in e u t r o p h i c a t i o n of t h e s e a w a t e r n e a r the i s l a n d of H e l g o l a n d d u r i n g a p e r i o d of 30 y e a r s of continuous m e a s u r e m e n t s .
M E T H O D S
Since 1962, t i m e - s e r i e s m e a s u r e m e n t s of i n o r g a n i c nutrients, p h y t o p l a n k t o n stocks a n d h y d r o g r a p h i c a l p a r a m e t e r s h a v e b e e n c a r r i e d out at H e l g o l a n d Roads (54 ~ 11.3' N, 7 ~ 54.0' E), a n a r r o w c h a n n e l b e t w e e n the m a i n i s l a n d of H e l g o l a n d a n d a small, s a n d y i s l a n d n e a r b y . N o r m a l l y at 9.00 h in the morning, surface w a t e r s a m p l e s are t a k e n from a boat. T h e s e s a m p l e s w e r e t a k e n to b e r e p r e s e n t a t i v e of the w a t e r c o l u m n of only 5 m d e p t h , as strong tidal currents mix the w a t e r column. Salinity a n d t e m p e r a t u r e w e r e d e t e r m i n e d 5 times p e r w e e k from w o r k d a y samples; nutrients a n d p l a n k t o n 3 t i m e s p e r w e e k until 1974, a n d five times p e r w e e k since 1975. Silicate has b e e n m e a s u r e d since
1966.
Salinity w a s m e a s u r e d with a n inductive salinometer (except for the first years, w h e n
chloride titration w a s used). Inorganic nutrients w e r e a n a l y z e d using standard m e t h o d s
according to Grasshoff et al. (1983), with s o m e modifications. W a t e r s a m p l e s w e r e
a n a l y z e d for nutrients i m m e d i a t e l y after sampling, except for silicate w h i c h w a s a n a l y z e d
f r o m d e e p - f r o z e n samples.
T h e m i c r o p l a n k t o n w a s c o u n t e d with a n inverted m i c r o s c o p e after fixation with
neutralized Lugol's iodine solution. T h e determination w a s d o n e to the species or g e n e r a
level, s o m e t i m e s to higher t a x o n o m i c levels as the fixed material a n d fast c o u n t i n g
p r o c e d u r e d o not allow better identification. This w a s particularly true for the minute,
n a k e d nanoflageUates. C o u n t e d plankters w e r e converted to organic carbon, using
factors calculated f r o m size a n d s h a p e of the species b a s e d o n H a g m e i e r (1961). T h e s e
b i o m a s s values w e r e s u m m e d u p for d i a t o m a n d n o n - d i a t o m (= "flagellate") plankton, or
basically n o n m o t i l e a n d motile phytoplankton. T h e "flagellates" thus i n c l u d e d various
246 W. Hickel, P. M a n g e l s d o r f & J. Berg
RESULTS
M o n t h l y m e d i a n v a l u e s w e r e u s e d for a n n u a l cycles, a n d y e a r l y m e d i a n s for i n t e r a n - n u a l v a r i a t i o n s a n d trends. T h e m o n t h l y m e d i a n v a l u e s of i n o r g a n i c d i s s o l v e d o r t h o p h o s - p h a t e (Fig. 2) s h o w the i n c r e a s e of p e a k concentrations, in winter, u p to 1981 a n d t h e i r d e c l i n e thereafter. M i n i m u m c o n c e n t r a t i o n s after t h e s p r i n g p h y t o p l a n k t o n blooms, or t h e e x c e s s p h o s p h a t e not u s e d b y t h e blooms, i n d i c a t e no c l e a r trend. T h e m o n t h l y m e d i a n v a l u e s of n i t r a t e (Fig. 3) s h o w t h e i n c r e a s e of p e a k c o n c e n t r a t i o n s in w i n t e r as w e l l as of m i n i m u m c o n c e n t r a t i o n s in s u m m e r . Silicate c o n c e n t r a t i o n s (Fig. 4) d e c l i n e d until 1986, after p e a k v a l u e s following E l b e river floods in 1975. T h e n a d r a m a t i c i n c r e a s e w a s f o u n d a l t e r t h e E l b e river floods in 1987.
T h e a n n u a l m e d i a n v a l u e s of p h o s p h a t e a n d n i t r a t e c o n c e n t r a t i o n s (Fig. 5) s h o w m o r e c l e a r l y the different d e v e l o p m e n t of the two m a j o r n u t r i e n t e l e m e n t s in the p a s t t h r e e d e c a d e s . T h e p h o s p h a t e e u t r o p h i c a t i o n s t a r t e d r i g h t from the b e g i n n i n g of t h e t i m e - s e r i e s in the 'sixties - following t h e i n t r o d u c t i o n of d e t e r g e n t s on a l a r g e r scale. A l m o s t a d o u b l i n g of c o n c e n t r a t i o n s w a s r e a c h e d after a d e c a d e , a l e v e l l i n g off for
a n o t h e r d e c a d e a n d a s u b s e q u e n t d e c r e a s e to a l m o s t the original c o n c e n t r a t i o n s , o v e r t h e
last years. Nitrate concentrations, h o w e v e r , i n c r e a s e d m u c h l a t e r (in t h e ' e i g h t i e s only), to r e a c h t h r e e times t h e former level w i t h i n a few years. A d e c r e a s e w a s o b s e r v e d o v e r t h e last 2 years.
It is n e c e s s a r y to differentiate b e t w e e n w i n t e r a n d s u m m e r n u t r i e n t c o n c e n t r a t i o n s , as t h e s e r e p r e s e n t t h e situation of a c c u m u l a t e d n u t r i e n t stocks b e f o r e the s p r i n g p h y t o - p l a n k t o n b l o o m on the one h a n d , a n d the " r e g e n e r a t e d n u t r i e n t " c o n d i t i o n in s u m m e r , w h e n n u t r i e n t c o n c e n t r a t i o n s are the r e s u l t of the difference b e t w e e n r e m i n e r a l i s a t i o n a n d c o n s u m p t i o n p r o c e s s e s . F i g u r e s 6 a n d 7 s h o w - b e s i d e s the y e a r l y m e d i a n v a l u e s - t h e m e d i a n s of w i n t e r ( J a n u a r y - M a r c h ) a n d s u m m e r ( J u n e - A u g u s t ) v a l u e s . T h e i n c r e a s e of p h o s p h a t e (Fig. 6) is l a r g e r in s u m m e r , u n d e r r e g e n e r a t e d n u t r i e n t c o n d i t i o n s , w h i l e t h e rise of n i t r a t e c o n c e n t r a t i o n s (Fig. 7) is m o r e e v i d e n t in winter.
D u e to t h e different d e v e l o p m e n t of p h o s p h o r u s a n d n i t r o g e n e u t r o p h i c a t i o n , t h e n u t r i e n t ratios in the G e r m a n Bight h a v e c h a n g e d m a r k e d l y (Fig. 8). A r e g u l a r y e a r - c y c l e
of t h e N / P - r a t i o is normal, with a P - s u r p l u s in s u m m e r a n d a n N - s u r p l u s in w i n t e r , as
c o m p a r e d w i t h the "normal" ratio of N / P = 16, the "Redfield ratio". This is b e c a u s e the p h o s p h a t e r e m i n e r a l i s a t i o n p r o c e e d s faster t h a n the n i t r o g e n r e m i n e r a l i s a t i o n , t h e r e f o r e p h o s p h a t e c o n c e n t r a t i o n s i n c r e a s e f a s t e r (after the m i n i m u m following t h e s p r i n g p h y t o - p l a n k t o n blooms) t h a n nitrate concentrations. As e a r l y as May, p h o s p h a t e c o n c e n t r a t i o n s a r e rising, w h i l e n i t r a t e c o n c e n t r a t i o n s are still declining. W h i l e this u s e d to r e s u l t in a p h o s p h o r u s s u r p l u s in s u m m e r , n o w e v e n in s u m m e r the N - s u r p l u s r e m a i n s , d u e to t h e l a r g e s u r p l u s of n i t r a t e in w i n t e r w h i c h is not u s e d u p b y the p h y t o p l a n k t o n . T h e a m m o n i a c o n c e n t r a t i o n s , w h i c h h a v e d e c r e a s e d d u r i n g t h e l a s t two d e c a d e s - as t h e y d i d in D u t c h coastal w a t e r s (Schaub & G i e s k e s , 1991), a r e of d e c r e a s i n g q u a n t i t a t i v e i m p o r t a n c e for t h e i n o r g a n i c n i t r o g e n stock in t h e w a t e r s a r o u n d H e l g o l a n d . T y p i c a l m o n t h l y m e d i a n v a l u e s in t h e last d e c a d e r a n g e from 1.5 to 6 ~mol d m -3.
E u t r o p h i c a t i o n i n t h e G e r m a n B i g h t 247
9
C~
I
I
(27
. r - , 4
9
9
- I
~ e
I ~ | o ,
~ o I -4
|
~ ~ 9
a ,, i ~
~ ,
9 - - a
~ "
i i i t ~
T 9
O
0
.:2
~o
r
r3 t~
r
248
W. Hickel, P. Mangelsdorf & 3. Berg
0 C ) 0
~ ~ _
~ ~ _ _ = , - ,
,
Q
~ , n
~ ~ . - _ " ~ t . - - t ~ _
0
~ " _
:::_- _~_.----.
~
~ ~ -
.~'----~'~
~ ' ~ - ~ ~ -
_
~: ~
~ - .
~
. . . .a
o
~
Z
' , 1 , 1
0 I - - ' .
.I,,,=, ~
Eutrophication in the German Bight 2 4 9
~
9
i
"5
C/3
w 9
C'q 7:
O
P - r ' ' I . . . . I . . . . I . . . . I . . . . I ' ~ ' " l I . . . .
O
250 W. Hickel, P. Mangelsdorf & J. Berg
"~
tZ
~
o
.
.
.
.
.
-
~ o
~ . ~
9
:
-- '~ . . . i .... I . . . . a " " l ... i ... I i .... I
, , 0
Eutrophication in the German Bight 251
9 ~ ~ ~
N m ~
o~
0
0
G ~
- , - ~
m
~
~ t ' I , l , i I , L , I , i
,
o
~
~
d
d
d
/
F~
l
d
d
t~
i
t0 > ta
Y=
r
(3
O r ~9 ~
O
0 0 0 0 W. Hickel, P. M a n g e l s d o r f & J. Berg
z
o
o
9
ul
r'~
?
252
~D
I
~D 0
m J
O"~-
C~..:" -',2-
" , / 2
" - / 2
O~
CO
==_
CO--
o~__-
9
0
I
0~ Crq
0
0
Eutrophication in the German Bight
253I
0
7 .
I
0
-r'-~
,-c
9 r"-4 . . ~0
o
i
o
9 9 0
c~
L _ ' "
- c ' q
I - ~ ' u ' " ' l " " u ' " ' i " " L ' " ' l ' " i ' " l ' " n " ' I ' " ' ~ ' " ' } '" J " " l ' " ' J " ' l
254 W. Hickel, P. M a n g e l s d o r f & J, Berg
a n d this correlation e x t e n d s farther out into the G e r m a n Bight t h a n t h e p h o s p h a t e - sahnity correlation does. T h e i m p a c t of large Elbe river floods o n n u t r i e n t levels n e a r H e l g o l a n d is s h o w n i n Figure 9, b y c o m p a r i n g the years 1987 a n d 1988 (with large flood events) with the d e c a d e before. In 1987 a n d 1988, with almost twice as m u c h E l b e w a t e r discharge t h a n normal, approximately a d o u b h n g of nitrate c o n c e n t r a t i o n s w a s found. T h e i n c r e a s e i n silicate c o n c e n t r a t i o n s was e v e n greater: u p to t e n times more i n M a y / J u n e t h a n i n the years before. P h o s p h a t e concentrations, however, w e r e n o t elevated.
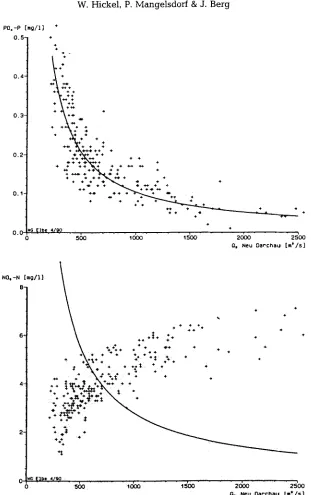
DISCUSSION
T h e difference i n p h o s p h a t e a n d nitrate e u t r o p h i c a t i o n is thus most c o n s p i c u o u s a n d m u s t b e t r a c e d b a c k to the m a i n source, the River Elbe. M a n y years of m o n i t o r i n g of the Elbe w a t e r b y the Wassergfitestelle Elbe (ARGE Elbe, 1990, 1991) h a v e s h o w n the different b e h a v i o u r of p h o s p h a t e a n d nitrate in relation to the river w a t e r d i s c h a r g e v o l u m e s (Pig. I0, see also Lucht & Gillbricht [1978]). Phosphate c o n c e n t r a t i o n s follow the theoretical dilution curve; therefore the c o n t r i b u t i o n of r a i n w a t e r a n d w a s h - o u t from the l a n d c a n n o t b e v e r y important. Nitrate concentrations, in contrast, do n o t follow the dilution curve, b u t i n c r e a s e in c o n c e n t r a t i o n with i n c r e a s i n g rainfall a n d river discharge. While i n o r g a n i c dissolved p h o s p h a t e b e h a v e s h k e a (constant) p o i n t source, follow- ing the dilution curve (Pig. I0}, i n o r g a n i c n i t r o g e n comes m a i n l y from diffuse sources a n d d e p e n d s o n w a s h - o u t b y rainfall. T h e agricultural runoff of excess fertilizer is a k n o w n n i t r o g e n source i n the rivers. In G e r m a n y , n i t r o g e n fertilizer use has i n c r e a s e d consider- a b l y (3-4 times) d u r i n g the last d e c a d e s (ARGE Elbe, 1990), while the u s e of p h o s p h o r u s fertilizer has not. Besides this source of nitrogen, w e t deposition of a i r b o r n e n i t r o g e n from car e x h a u s t s a n d i n t e n s i v e cattle b r e e d i n g i n c r e a s i n g l y adds to the n i t r o g e n load of the rivers. Direct w e t deposition on the sea surface is b e c o m i n g a significant N-source, b u t is t h o u g h t to b e of m i n o r i m p o r t a n c e for the coastal water, with its high n u t r i e n t level.
While r i v e r i n e sources m i g h t e x p l a i n rising c o n c e n t r a t i o n s of n i t r o g e n i n t h e coastal water, the d e l a y e d n i t r a t e - e u t r o p h i c a t i o n process is less clear: nitrate c o n c e n t r a t i o n s i n c r e a s e d a b o u t a d e c a d e later t h a n p h o s p h a t e concentrations. This raises t h e q u e s t i o n of w h e t h e r the adsorptive capacity of soil particles for i n o r g a n i c n i t r o g e n h a d to first b e reached, i n order to r e l e a s e i n o r g a n i c n i t r o g e n into the g r o u n d w a t e r a n d t h e rivers. Such a process could e x p l a i n the u n e x p e c t e d l y rapid rate of the nitrate increase.
T h e silicate c o n c e n t r a t i o n s s e e m to d e p e n d a lot on d i s c o n t i n u o u s i n j e c t i o n s b y large Elbe river floods w h i c h c a n obviously l e a d to a n i n c r e a s e in silicate c o n c e n t r a t i o n s of 3 - 1 0 times. A d d i t i o n a l d a t a on horizontal g r a d i e n t s of Si, c o r r e s p o n d i n g to those of salinity, show t h a t t h e River Elbe is i n d e e d the m a i n source of e l e v a t e d silicate c o n c e n t r a t i o n s (Hickel et al., 1989). I n b e t w e e n flood events, sihcate c o n c e n t r a t i o n s d e c r e a s e from y e a r to year, m a k i n g t h e role of silicate, as t h e first n u t r i e n t to b e e x h a u s t e d i n t h e y e a r cycle, more a n d more likely.
E u t r o p h i c a t i o n i n t h e G e r m a n B i g h t 255
I I
o
o
~
~ ' ' ' 1 . . . .
0
o
~
~
I . . . . I . . . . I . . . . I . . . . I ' ' ' ' l ' ' ' ; i i ' ' ~
. S
o..~l ~
o o 0 0 0 0
o~
o ~
?
,
-4 d r
.~o
o
I~ ua
o .~
~g
Ob 0
~_~ 0 . ~ 0
o 2 ~ L 0a~0
e
U i
~ ' ~
~ , e'~
~ u
2 5 6
W. Hickel, P. Mangelsdorf & J. Berg
POo-P [mg/l] 0.5-
0.4.
0.3-
0.2-
0.0
+
,++
k
§ .i, 4-
§ + +
-~ +..i.-~ + § §
4 , + §
****+ ~,- + + . +
.M. .(.4. 4 + §
" ~ + -~'+ * + +..I- ' ~ ~' ,e § +
§
~G l ~ ] o e . 4 / W ) .
560 " ~ o ~ o " ~'oo "
§
2o~o
- 25o0Q, N e u Dar'cnau [ m ' / s ]
NO,-N e~[mg'/] }
+ + 4
§ + * §
§ -t.w, 4
6 , § : . . , . "
,~+ + - , , :t . ~ + +
~. ~ + . . . , . ~ t + + ,,
*i
G E~,D,. 4 ; ~ .
0 5 0 0 i 0 0 0 1 5 0 0 2 0 0 0 2 5 0 0
O , N e u O a r c h a u [ m J / S ] i
Eutrophication i n the G e r m a n Bight 257
biological processes. Salinities of -> 33 p s u r e p r e s e n t the w a t e r of the outer G e r m a n Bight, well outside the direct influence of the Elbe river water p l u m e {Hickel, 1980}. Figures 11 a n d 12 show the n u t r i e n t concentrations as m e a n v a l u e s of the respective w i n t e r s (with 95 % c o n f i d e n c e intervals a n d no. of values}; the result is that the above a s s u m p t i o n m u s t be rejected. T h e increase m p h o s p h a t e a n d nitrate c o n c e n t r a t i o n s are similarly large in the w a t e r of S >- 33 psu, b u t their p e a k c o n c e n t r a t i o n s occurred 3 years later t h a n i n the a v e r a g e H e l g o l a n d data. M a x i m u m c o n c e n t r a t i o n s in the high-salinity water were f o u n d in w i n t e r 1975/76 for phosphate, a n d 1983/84 for nitrate. C o m p a r e d with the yearly a v e r a g e v a l u e s from Helgoland, the i n c r e a s e of p h o s p h a t e i n the w a t e r with S -->_ 33 psu occurred e v e n a b o u t a decade later.
As the eutrophication of the outer G e r m a n Bight ( r e p r e s e n t e d by salirdfies of --- 33) occurs later a n d is d i s c o n n e c t e d from r e d u c e d salinities, it seems likely that n u t r i e n t s were carried b y p l a n k t o n a n d detritus (organic seston), g o i n g t h r o u g h cycles of s e d i m e n - tation a n d r e m i n e r a l i z a t i o n - which could e x p l a i n the delay. This a s s u m p t i o n b e c o m e s more credible as other e v i d e n c e points to the s a m e direction: the n o r t h e r n m o s t G e r m a n W a d d e n Sea b a s i n (of Sylt) also s h o w e d a very d e l a y e d eutrophication (Hickel, 1980,
1989), which c a n b e e x p l a i n e d b y n u t r i e n t transports as organic seston.
Other e v i d e n c e for l o n g - d i s t a n c e transport of organic particles along the residual c u r r e n t direction comes from the site of the o x y g e n d e p l e t i o n i n the bottom w a t e r of the s o u t h - e a s t e r n North Sea. E x t e n d e d areas of severe o x y g e n shortage have b e e n f o u n d there since the early 'eighties, far a w a y (about 100 k m a n d more) from potential sources of n u t r i e n t i n p u t (von W e s t e r n h a g e n et al., 1986}. Settlin 9 p h y t o p l a n k t o n in the bottom w a t e r was f o u n d c o n c e n t r a t e d farther north, in t h e direction of the residual currents, t h a n blooms of the same species in the surface waters (Hickel et al., 1989)
This p a p e r describes the h u m a n i m p a c t i n the G e r m a n Bight, u s i n g n u t r i e n t a n d phyto- p l a n k t o n data from the H e l g o l a n d time-series. T h e a n t h r o p o g e n i c i n f l u e n c e on n u t r i e n t c o n c e n t r a t i o n s a n d ratios can be d e m o n s t r a t e d : the i n c r e a s e of p h o s p h a t e levels d u r i n g the 'sixties a n d early 'seventies, the p h o s p h a t e d e c r e a s e as a result of P-reducang m e a s u r e s , a n d t h e late i n c r e a s e in nitrate in the 'eighties, led to a m a r k e d shift of the N:P-ratios.
2 5 8
W. Hickel, P. Mangelsdorf &
3.Berg
~Q
o
0
P~
0
t~
IIV
r
0 0 ~'~ ~ ~ ~
I I I 1 I I I I I I I ,1
0 ' ~ _ -
O ' l -
e , D -
o~-:
0
0
I
,~
~
,
I
~o
~
r-I-~
~
o
r-l--1 :
F-I~ ~_
E I 3 ~
EzD~
~:o_-~__z
r - l ~
m ~
r-l-1 ~
F-lm -~
c - - p ~
r - - t - - n :
I_
I
~ . . . O "~
~O ~-~
o
~'~
0 I V
P--m ~'-"
r ~ O0
('D
Eutrophication in the G e r m a n Bight
C~
AI
.,.,-4
.,--.-4
I .~,--(
9
9
,---4
9
- I
t " l I I
= r - l - - i
~ r - - I - I
I
I, - Z " ~- o
~
_~
_~
~
O~ O~
I 259
n5
L~
c~
cJ
. r ~ r
o
0 ; . ~
m
t~
I1J e.,
0
q.l
o
260 W. H i c k e l , P. M a n g e l s d o r f & J. B e r g
Carbon
Phytoplankton
] . I ~ / l M e d i a n s M a r c h 15 - S e p t . 1 5
I001
60
40-
20-
Carbon
~g/l
100-80-
60-
40-
20-
O-
C a r b o n
~g/1
Flagellates
M e d i a r m June 15 - S e p t . 15
~.[~1841~leole~l~[0917o]~ll~ 73 74 ~5 70 77 ~8 ~ eo 81 ~ 83 8~ e~ 06 8~ 88 89 ~o191~
D i a t o m s
M e d i a n s A p r i l 1 - S e p t . 15
1 0 0 ~ . . .
80 . . . = "
6 0 . . .
40 . . .
i i i i , i l
Years 1 9 6 2 - 1991
Fig. 13. Total phytoplankton biomass in the G e r m a n Bight near Helgoland, 1962-1991: yearly m e d i a n values of the growing season (mid-March - mid-September), upper g r a p h . Flagellate a n d diatom biomass, m e d i a n values for their respective main growing season (potential blooming
Eutrophication i n the G e r m a n Bight 261
T h e observed increase in p h y t o p l a n k t o n seems to b e m a i n l y d u e to n a k e d n a n o - flagellates, which could not b e identified in the p r e s e r v e d samples. T h e s e delicate species formed a large p o p u l a t i o n of a b o u t 5 ~g of organic c a r b o n d m -3 i n t h e first half of the period a n d a b o u t 25 ~tg in the last decade; these p o p u l a t i o n s w e r e r e m a r k a b l y c o n s t a n t t h r o u g h o u t the year. Overall, the flagellates smaller t h a n 10 ~m w e r e about as n u m e r o u s i n w i n t e r as in s u m m e r . As light conditions in w i n t e r are poor, in the turbid, tidally-mixed H e l g o l a n d waters, it is u n l i k e l y that such a large a n d c o n s t a n t p o p u l a t i o n of phototrophic flagellates could survive at this time. It is h a r d to b e l i e v e that a n e t p r i m a r y p r o d u c t i o n of autotrophic p h y t o p l a n k t o n could occur i n winter; the lack of a significant diatom p o p u l a t i o n in the H e l g o l a n d waters d u r i n g that period also i n d i c a t e s this. Therefore the n a n o f l a g e l l a t e population i n the H e l g o l a n d waters should - at least in w i n t e r - b e r e g a r d e d as composed of the m a n y k n o w n heterotrophic or mixotrophic species. T h e values in Figure 13 i n c l u d e the a b o v e - m e n t i o n e d fraction of n a n o f l a g e l l a t e s of u n k n o w n trophic state.
In general, the n a n o f l a g e l l a t e n u m b e r s c a n n o t be c o n s i d e r e d as reliable as the n u m b e r s of a r m o u r e d dinoflagellates a n d diatoms. This is b e c a u s e m a n y of the minute, n a k e d n a n o f l a g e l l a t e s t e n d to disrupt by fixation, which is w e l l - k n o w n from the literature (e. g. Reid et al., 1990). A m o n g the successfully p r e s e r v e d nanoflageUates, m a n y might disintegrate later after some period of storage, b u t we h a v e insufficient e v i d e n c e of this effect in order to e v a l u a t e the p r e s e n t data: in the first half of the series, part of the p l a n k t o n s a m p l e s were stored for c o n s i d e r a b l e (but varying) periods, contrary to the second half of the time-series, w h e n p l a n k t o n s a m p l e s w e r e stored for only a few days. U n n o t i c e d losses by different storage periods might thus a d d to the o b s e r v e d c h a n g e s in n a n o f l a g e l l a t e stocks.
As m e n t i o n e d above, the causal relationship b e t w e e n i n o r g a n i c n u t r i e n t eutrophica- tion a n d p h y t o p l a n k t o n stocks is n o t clearly d e m o n s t r a b l e from the H e l g o l a n d data. This is mainly because massive extra nutrient supply during large Elbe river flood events -
such as in the years 1987 a n d 1988 (Figs 13 a n d 9) - failed to e n h a n c e phytoplankton
stocks near Helgoland. A comparison b e t w e e n two periods of large Elbe river floods
might be helpful to explain possible reasons for differing response of phytoplankton to
Elbe river floods (Hickel et aL, 1992). While such flood events in winter a n d s u m m e r 1981
resulted in the largest phytoplankton
(Ceratium)
blooms ever recorded in the G e r m a nBight, winter/spring floods in 1987 a n d 1988 h a d no such effect. T h e difference w a s an
extended period of calm weather in 198 i, which, along with abundant freshwater inflow,
led to a strong vertical density stratification, whereas in 1987/1988 n o such stratification
w a s observed, due to w i n d y weather. Hence, the improved light condition in a stratified
water c o l u m n w a s probably the dominant factor for the plankton blooms. T h e varying
hydrographic structure of the G e r m a n Bight might be the reason w h y the response of
phytop!ankton growth to eutrophication is so different from that in the D u t c h coastal
w a t e r : i n f l u e n c e d b y the River Rhine (Schaub & Gieskes 1991).
262 W. H i c k e l , P. M a n g e l s d o r f & J. B e r g
m a j o r l o n g - d i s t a n c e c a r r i e r of n u t r i e n t s m u s t b e f u r t h e r i n v e s t i g a t e d , i n o r d e r to u n d e r - s t a n d m e c h a n i s m s of e u t r o p h i c a t i o n a n d p o l l u t i o n .
P h y t o p l a n k t o n s t o c k s , a s p o t e n t i a l l y e n h a n c e d b y e u t r o p h i c a t i o n , s e e m to h a v e i n c r e a s e d d u r i n g t h e i r g r o w t h s e a s o n . B u t a d i r e c t c o r r e l a t i o n w i t h n u t r i e n t l o a d s of t h e R i v e r E l b e w a s n o t f o u n d ; it is r a t h e r t h e v e r t i c a l d e n s i t y s t r a t i f i c a t i o n t h a t d o m i n a t e s t h e p h y t o p l a n k t o n m a s s o c c u r r e n c e i n s u m m e r , a s a n e x a m p l e f r o m t h e y e a r 1981 s h o w s . O n l y if c o n d i t i o n s of s t r a t i f i e d w a t e r c o l u m n s b e c o m e m o r e f r e q u e n t , is it l i k e l y t h a t t h e i m p a c t of e u t r o p h i c a t i o n o n p h y t o p l a n k t o n will b e c o m e m o r e e f f e c t i v e . B u t t h i s e f f e c t w i l l b e f o u n d to b e m o r e p r o n o u n c e d i n t h e o u t e r G e r m a n B i g h t w a t e r s , w h e r e n u t r i e n t c o n c e n t r a t i o n s i n s u m m e r a r e c l o s e r to g r o w t h - l i m i t i n g l e v e l s t h a n n e a r H e l g o l a n d . S u c h e f f e c t s a r e n o t s u f f i c i e n t l y m o n i t o r e d w i t h t h e H e l g o l a n d R o a d s t i m e - s e r i e s , a n d a d d i - t i o n a l r e g i o n a l l y e x t e n d e d t i m e - s e r i e s w o u l d b e r e q u i r e d .
A c k n o w l e d g e m e n t s , We w a n t to t h a n k all those who continued the tedious work on the Helgoland time-series samples for decades, particularly Dr. E. Hagmeier, who counted most of the plankton in the first half, and K. Treutner, who counted in the second half of the time-series.
L I T E R A T U R E C I T E D
ARGE Elbe, 1990. NShrstoffstudie d e r Elbe. ARGE Elbe, Hamburg, 53 pp.
ARGE Elbe, 1991. Trend-Entwicklung der NShrstoffe im Elbwasser yon 1980-1989. ARGE Elbe, Hamburg, 23 pp.
Brockmann, U., Billen. G. & Gieskes, W. W. C.. 1988. North Sea nutrients and eutrophication. In: Pollution of the North Sea. Ed. by W. Salomons B. L. Bayne, E. K. Dnursma & U. F6rstner. Springer. Berlin, 348-389.
Colijn, F., Dooley, H., Owens, N. J. P. & Skjoldal. H. R.. 1992. Report of the Expert Group on nutrients to Paris Commission Working Group on nutrients. Oslo and Paris Commn., Oslo, 1-27 (1'14/2E). Gerlach, S. A. 1990, Nitrogen, phosphorus, plankton a n d oxygen deficiency in t h e G e r m a n Bight
and in Kiel Bay. - Kieler Meeresforsch. (Sonderh.) 7, 1-341.
GiUbricht. M., 1983. Eine "red tide" in der sfidlichen Nordsee und ihre B e z i e h u n g e n zur Umwelt. - HelgolSnder M e e r e s u n t e r s 36, 393-426.
Gillbricht. M.. 1988. Phytoplankton a n d nutrients in the Helgoland region. - HelgolSnder M e e r e s - unters. 42 435-467.
Grasshoff, K,. Ehrhard. M. & Kremling. K. (Eds), 1983. M e t h o d s of s e a w a t e r analysis. VerL Chemie. Weinheim. 419 pp.
Hagmeier. E.. 1961. Plankton-,~quivalente. - Kieler Meeresforsch. 17, 32-47.
Hagmeier. E., 1978. Variations in phytoplankton n e a r Helgoland. - Rapp. P.-v. R~un , Cons. int. Explor. M e t 172, 361-363,
Hicke] W., 1980. The influence of Elbe river water on the W a d d e n Sea of Sylt (German Bight, North Sea). - Dt. hydrogr. Z. 33. 43-52.
Hickel. W . 1989. Inorganic micronutrients and the eutrophication in the W a d d e n Sea of Sylt (German Bight, North Seal. In: Proceedings of the 21st European Marine Biology Symposium. Ed, by R. Z. K]ekowski, E. Styczinska-Jurewicz & L. Falkowski. Polish A c a d e m y of Science Institute of Oceanology, Wroclaw. 309-318.
Hickel. W., Bauerfeind, E.. Niermann. U. & Westernhagen, H. yon, 1989. O x y g e n deficiency in the south-eastern North Sea: Sources a n d biological effects. - Bet. Biol. Anst. Helgoland 4, 1-148. Hickel. W.. Berg, J. & Treutner. K., 1992. Variability in phytoplankton biomass in the G e r m a n Bight
(North Sea) n e a r Hetgoland, 1980-1990. - ICES mar. ScL Syrup. I95, 247-257,
Kafle, K., 1956, C h e m i s c h - h y d r o g r a p h i s c h e U n t e r s u c h u n g e n in der i n n e r e n D e u t s c h e n Bucht. - Dt. hydrogr. Z, 9, 55-65.
Lucht. F. & Gillbricht. M., 1978, Long-term observations on nutrient contents n e a r H e l g o l a n d m relation to nutrient input of the Elbe river. - Rapp. P.-v. R~un. Cons. int. Explor. M e t 172.
E u t r o p h i c a t i o n i n t h e G e r m a n B i g h t 263
Nelissen, P. H. M. & Stefels, J., 1988. Eutrophication in the North Sea. NIOZ-Rapp. I988-4, 1-100. Radach, G. & Berg, J., 1986. Trends in d e n Konzentrationen der N~ihrstoffe und des Phytoplanktons
in der Helgol~inder Bucht (Helgoland Reede Daten). - Ber. Biol. Anst. Helgoland 2, 1-83. Radach, G. & Bohle-Carbonell, M., 1990. Strukturuntersuchungen der meteorologischen, hydro-
graphischen, N6hrstoff- u n d Phytoplankton-Zeitreihen in der Deutschen Bucht bei Helgoland. - Ber. Biol. Anst. Helgoland 7, 1-425.
Radach, G., Berg, J. & Hagmeier, E., 1990. Long-term c h a n g e s of the annual cycles of meteorologi- cal, hydrographic, nutrient and phytoplankton time series at Helgoland and at LV Elbe 1 in the G e r m a n Bight. - Cont. Shelf Res. 10, 305-328.
Reid, P. C., Lancelot, C., Gieskes, W. W. C., Hagmeier, E. & Weichart, G., 1990. Phytoplankton of the North Sea and its dynamics: a review. - Neth. J. Sea Res. 26, 295-331.
Schaub, B. E. M. & Gieskes, W. W. C., 1991. Eutrophication of the North Sea: the relation b e t w e e n Rhine river discharge and chlorophyll-a concentration in Dutch coastal waters. In: Estuaries and coasts: temporal and spatial intercomparisons. Ed. by M. Elliot & J.-P. Ducrotoy. Olsen & Olsen, Fredensborg, 85-90.