R E S E A R C H
Open Access
Feed conversion ratio, residual feed intake
and cholecystokinin type A receptor gene
polymorphisms are associated with feed
intake and average daily gain in a Chinese
local chicken population
Zhenhua Yi
1,2†, Xing Li
1,2†, Wen Luo
1,2, Zhenqiang Xu
3, Congliang Ji
3, Yan Zhang
3, Qinghua Nie
1,2,
Dexiang Zhang
1,2,3*and Xiquan Zhang
1,2*Abstract
Background:The feed conversion ratio (FCR) and residual feed intake (RFI) are common indexes in measuring feed efficiency for livestock. RFI is a feed intake adjusted for requirements for maintenance and production so these two traits are related. Similarly, FCR is related to feed intake and weight gain because it is their ratio. Cholecystokinin type A receptor (CCKAR) plays an important role in animal digestive process. We examined the interplay of these three parameters in a local Chinese chicken population.
Results:The feed intake (FI) and body weights (BW) of 1,841 individuals were monitored on a daily basis from 56 to 105 d of age. There was a strong correlation between RFI and average daily feed intake (ADFI) and a negative correlation between the FCR and daily gain (rg=−0.710). Furthermore, we identified 51 single nucleotide polymorphisms (SNPs) in theCCKARand 4 of these resulted in amino acid mutations. The C334A mutation was specifically associated with FI and the expected feed intake (EFI) (P< 0.01) and significantly associated with the average daily gain (ADG) (P< 0.05). G1290A was significantly associated with FI and EFI (P< 0.05).
Conclusion:FCR is apply to weight selecting, and RFI is more appropriate if the breeding focus is feed intake. And C334A and G1290A of theCCKARgene can be deemed as candidate markers for feed intake and weight gain.
Keywords:CCKAR, Chicken, FCR, RFI, SNP
Background
Feed expenses account for approximately 70% of chicken production costs [1]. One way to reduce fodder costs is by increasing the utilization rate of feed. The FCR and RFI are pivotal indicators for measuring poultry feed ef-ficiency. The FCR is calculated using FI and body weight gain (BWG) and is a proportional trait that does not have a normal statistical distribution, the degree of ab-normal distribution will increase with the increase of the
variable coefficient of the denominator, the mean values and standard deviations have no actual statistical signifi-cance [2–4].
As a selection index, the FCR is cannot be used to de-termine whether FI or BWG predominate and this re-duces the group selection difference and affects the efficiency of selection [5]. From a population genetic standpoint, the FCR is a moderately heritable trait and used as an indicator of the outcomes of other genetic improvements [6]. This type of selection results in the synchronous selection of FI and BWG with a population improvement bias towards high FI and high BWG. The outcome is an increase in BWG and the feed cost, and
* Correspondence:[email protected];[email protected]
†Zhenhua Yi and Xing Li contributed equally to this work.
1Department of Animal Genetics, Breeding and Reproduction, College of
Animal Science, South China Agricultural University, Guangzhou 510642, Guangdong, China
Full list of author information is available at the end of the article
the weight of the traits in the selection index is deter-mined by their desired gains.
In order to make up for the defects of FCR calcula-tions, the RFI has been used as a production perform-ance evaluation index for layer chickens since the 1970s. RFI is a measure of the feed utilization efficiency index of livestock first proposed in 1963 [7]. The RFI is the dif-ference between the actual animal FI and its EFI deter-mined by the growth rate and mean BW. By dividing the total energy of livestock and poultry into growth energy and maintenance energy, RFI can accurately reflect the metabolic differences among individuals in which meta-bolic differences are determined by genetic background [8]. The feed intake of high RFI individuals is higher than with low RFI individuals. Therefore, using the RFI as a negative selection trait is more likely to produce a population with low feed intake and high productivity.
The brain-gut axis encompasses the hypothalamus, vagus nerve, stomach and intestine and regulates eating behaviors [9–11]. Cholecystokinin (CCK) is a regulatory peptide of the brain-gut axis that is widely distributed in central and peripheral nerves and the digestive system. Its primary function is to promote gallbladder contrac-tion and pancreatic secrecontrac-tion [12]. However, CCK can-not properly function without the cholecystokinin receptor (CCKR). There are two CCKR subtypes (CCKAR and CCKBR). CCKAR mainly exists in periph-eral tissues and is responsible for regulating satiety and inhibiting gastric emptying [13–16]. CCKBR is distrib-uted in the central nervous system and is involved in nerve responses [17]. Thus, the main route for the regu-lation of feeding by CCK is its stimuregu-lation of the vagus nerve through peripheral CCKAR. The activated vagus nerve stimulates the central nervous system to produce CCK resulting in satiety and termination of feeding be-havior [18]. The expression levels ofCCKARin the indi-vidual brains are inversely proportional to growth rate [17]. Furthermore,CCKAR knockout mice have signifi-cantly higher FI levels than their wildtype counterparts [14]. Therefore,CCKARinfluences the regulation of feed intake and growth of animals.
Chinese local chickens have several excellent produc-tion traits such as high meat quality, strong adaptaproduc-tion and crude feed tolerance [19]. However, their growth rates and feed utilization efficiency are low. The purpose of this study was to analyze both these parameters in Chinese local chickens, and increase growth rate and feed efficiency by selection. We calculated FCR and RFI in a Tianlu black chicken population and assessed gen-etic parameters and the relative selection efficiency of FCR and RFI. In addition, Xu et al. [20] performed a genome-wide association study (GWAS) and RNA se-quencing on RFI of the yellow-plumage dwarf chicken line N301, and found that CCKAR is a potential
candidate gene associated with energy improvement, so we also analyzed the associations between variation in theCCKARand the phenotypes measured.
Methods
Animals and measurement of feeding traits
A Chinese local chicken population, a Tianlu Black chicken pure-line N416, was used for measurement of growth and feed conversion rate traits in this study. Chickens were housed in a closed type henhouse to con-trol the temperature and illumination during the brooding period (0–35 d of age). After 35 d of age, chickens were transferred to a half-open vertical ventilation hoop hen-house, and electronic chips were placed in the middle of shank. A total of 912 male individuals were kept in three fence-separated pens (every pen had 304 birds) on one side of the henhouse, and 929 female ones were kept in three fence-separated pens (309 birds in one pen, 310 ones in other two pens) on the other side of the same hen-house. Each pen had seventeen 9ZC-5 intelligent type breeding and feeding automatic measurement stations (Guangdong Guangxing Animal Husbandry Co., Ltd., China) and 40 nipple water bowls, the 9ZC-5 stations can recognize each chicken’s electronic chip and record the FI and BW of the chicken. The chickens were fed a diet con-taining 12.1 MJ/kg ME and 190 g CP/kg. Daily feed intake and body weights were recorded for each bird throughout the feeding trial from 56 to 115 d of age, and this working was performed as previously described [20], as some indi-viduals were died or the electronic chips were not identi-fied by the 9ZC-5 stations during the feeding period, at the end of the data screening, 538 sires and 682 dams con-tributed to these males and females under feed recording finally. For reducing cost, we selected 527 individuals from these 1,220 individuals for sequencing, these individuals are randomly selected.
Calculation of RFI and FCR
The RFI calculation was based on a previously described model [21]. The experimental period was conducted during the rapid growth period of the animals so the in-dividual BW and ages were linearly related. The regres-sion equation was
BW¼μþaDOTþe ð1Þ
where μ is the intercept, ais the regression coefficient, DOT was the day of testing and e is the residual. A DOT value of 25 is put into Eq. 1 to get the mid-test body weight (MBW) and the mid-test metabolic body weight, (MMBW) = MBW0.75.
ADFI¼FI=DOT ð2Þ
ADFI¼b0þb1MMBWþb2ADGþe ð3Þ
and
R FI¼AD FI-ðb0þb1MMBWþb2ADGÞ ð4Þ
In these models, ADFI is the average of the daily feed intake of individuals during the period of the ex-periment, b0 is the intercept, b1 and b2 are partial
re-gression coefficients for MMBW and ADG, respectively, and e was the residual and the RFI is the e of these models. The experimental data were then divided into two groups by sex and two equations were developed using ADFI, MBW and an ADG estimate of the EFI.
FCR is the net feed consumption of livestock unit weight gain. The FCR for each individual was estimated based on the ratio between unit weight gain and feed consumption.
Genetic parameters estimation
We constructed the multi-trait animal model:
Y¼XbþZaþe ð5Þ
to obtain estimates of the phenotypic and genetic (co) variance and heritability, and this model was based on the restricted maximum likehood method of the DMU statistical package [4, 20, 22]. Yis the vector under ob-servation, Xand Z was incidence matrices,bis a vector of fixed effects (including two gender levels and 6 pen levels), ais the vector of the animal additive genetic ef-fect andeis the vector of random residuals.
Relative selection efficiency estimation
Relative selection efficiencies were used to compare the expected effects of selection on FCR and RFI on other growth traits. In order to estimate the correlated re-sponse to selection on feed efficiency, we referred to previous report [23] and constructed the following equation:
CΔG=ΔG¼ðh1=h2Þ rA1A2 ð6Þ
whereCΔGrepresents the FCR and RFI for indirect se-lection efficiencies on growth. ΔG represents direct se-lection efficiencies that are induced through sese-lection of growth and other primary traits.rA1A2represents genetic
correlation coefficients between primary and secondary traits andh1andh2represents the heritability of primary
and secondary traits, respectively.
DNA manipulations and genotyping procedure
DNA was extracted from whole blood using the EZNA Blood DNA Kit (OMEGA Biotek, Doraville, GA). PCR primers for chicken CCKAR (NCBI Gene
ID: 422801) were designed using Primer Premier 5.0 software (http://www.premierbiosoft.com). Primers were synthesized by Shanghai Jierui Biological Tech-nology. Five pairs of primers were designed to per-form mixed pool sequencing for an initial screen of SNPs in CCKAR (Additional file 1: Table S1). For this purpose, data from the 10% highest- and 10% lowest-ranked RFI birds (each group had 48 individ-uals) were pooled randomly in 12 pools for sequen-cing. PCR was performed in a 40-μL volume consisting of 10 pmol of each primer, 20 μL of 2× Easy Taq SuperMix (Beijing TransGen Biotech Co., Ltd., China) and 50 ng of genomic DNA. The PCR procedure was as follows: 94 °C for 3 min, followed by 36 cycles of 94 °C for 30 s, 55–60 °C for 30 s and 72 °C for 2 min and a final step of 72 °C for 10 min. The PCR products were sequenced by Beijing Tsingke Biological Technology, China.
SNP genotyping was performed using the SNaPshot method [24]. Based on the preliminary SNP screening, 5 pairs of primers were designed for the 10 SNPs. P1 was de-signed for G176A, G219A, C334A, C448T, P2 for G1290A, P3 for C5818T, G6058A, A6163G, P4 for T3325C, and P5 for G6768A. PCR was performed in 15 μL, consisting of 3 pmol of each primer, 0.3 μL of 2× Easy Taq SuperMix, 30 ng of genomic DNA, 1.5μL MgCl2, 0.3μL dNTP and 1.
5μL 10× buffer. The PCR procedure was as follows: 94 °C for 3 min, followed by 36 cycles of 94 °C for 15 s, 55 °C for 30 s and 72 °C for 30 s with a final step of 72 °C for 10 min. The PCR products were purified by using ExoI (Thermo Fisher Scientific Inc., USA) and FastA (Thermo Fisher Sci-entific Inc., USA). Genotyping was performed using a com-mercial kit (SNaPshot Multiplex Kit, Thermo Fisher Scientific Inc., USA) using 2μL of purified products as di-rected by the specification, the purified primers were showed in Additional file1: Table S1.
Linkage disequilibrium and haplotype analysis
Linkage disequilibrium (LD) and haplotype analysis for this study population was performed using SHEsis soft-ware (http://analysis.bio-x.cn/myAnalysis.php). We ex-cluded polymorphic sites that did not conform to the Hardy-Weinberg Equilibrium (HWE) for the analysis. D´ was a standardized Lewontin LD coefficient as the evalu-ation criterion for LD. │D´│> 0.75 represented a strong LD between each pair of polymorphic sites. A full-precise-iteration algorithm was used for haplotype analysis. This was based on the equation:
N ð11Þ ¼2 Nð11=11Þ þNð12=11Þ þNð11=12Þ
þP½ð11=22Þ j ðXXÞ NðXXÞ ð7Þ
“12″ haplotype on one chromosome and “11″ on an-other,N(XX) represents the number of samples carrying both“1/2″genotypes at the two loci that was ambiguous for haplotype recognition.
Association analysis between SNPs and characters
The PROC-GLMR algorithm [25] was used to analyze the correlation of SNPs, FI and related traits. A statis-tical model was developed as follows:
Y¼μþGþFþSþe ð8Þ
where Y is the observed value of growth traits, μ is the population mean value of growth traits, G is the effect of genotype on growth performance, F is the fixed effect of family, S is the gender effect (two levels), andeis the random error effect corresponding to the ob-served value. The evaluation of traits among individuals with different genotypes was performed using the paired comparison method of ANOVA using SPSS version 19.0 software.
Results
BW, ADFI, MBW and RFI of Chinese local chickens
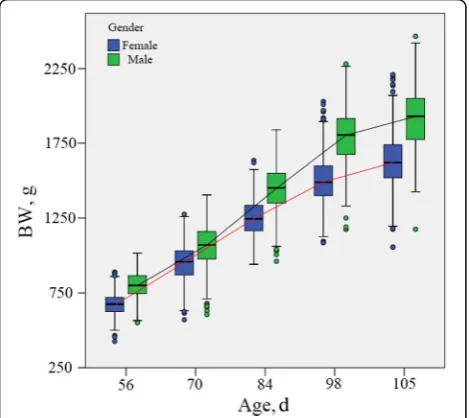
At the beginning of the feeding trial, the average BWs of male and female individuals at 56 d of age were 802 ± 86 g and 671 ± 73 g respectively. The average BWs at 115 d of age were 1,915 ± 191 g for male and 1,632 ± 175 g for females (Fig. 1). During the study period, the ADFI of males and females were 22.7 ± 3.31 g and 19.6 ± 2.97 g respectively. According to the Eq. 1, we obtained the MBW. The average MBW of male and female chickens was 1,426 ± 142 g and 1,182 ± 123 g,
respectively. The determination coefficients of male and female individuals were 0.409 and 0.545, respectively. Equations were as follows,
E FI¼0:381 MBW0:75þ1:09 ADG−5:14 ðfor male;ð9ÞÞ
E FI¼0:069 MBW0:75þ1:48 ADG−37:8ðfor female;ð10ÞÞ
Performance of growing and feed efficiency Chinese local chickens with different RFI values
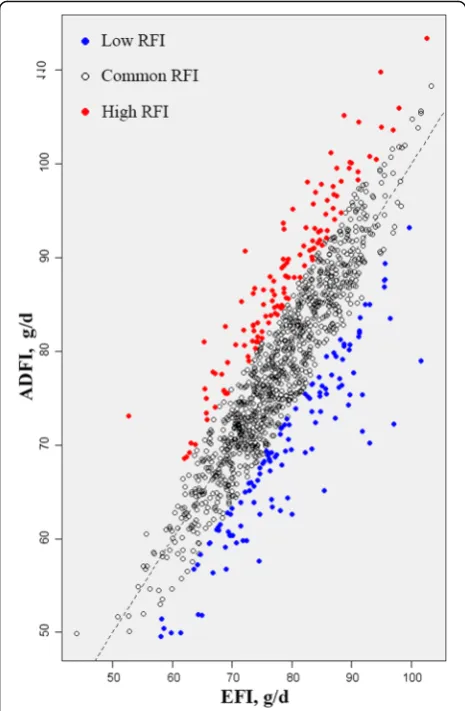
We observed growth performance and feed efficiency in chickens that possessed different RFI values and defined two groups of individuals with the 10% lowest and the 10% highest RFI values. We found that ADG, MBW, EFI and BW15 differences between the two groups were not signifi-cant. However, FCR and ADFI were significantly different in the higher and lower RFI group with a difference of 0.90 for FCR and a difference of 17.90 g for ADFI. The BW8 of the lower RFI group was significant (P< 0.05) less than the higher RFI group (Table 1). In addition, the ADFI in the higher RFI group was more than the predicted value whereas the situation with the lower RFI group was re-versed (Fig. 2). This indicated that the energy utilization rate of the lower RFI group exceeded the higher RFI group.
Heritability of the FCR, RFI and related traits
We estimated heritability of 7 characteristics. RFI herit-ability was 0.282 in the range 0.21–0.49 and similar re-sults have been previously reported [26]. The FCR heritability was 0.312 that was between 0.2 and 0.8 values previously reported [27] (Table2).
Correlation of FCR and RFI with other traits
We calculated the genetic and phenotypic correlation coefficients between RFI, FCR and other traits. Firstly, there was a strong correlation between RFI and FCR in both heritability and phenotype. A 0.693 genetic correl-ation coefficient between the two was in the 0.6–0.7 range as has been previously reported [8, 28]. Although
Fig. 1The weekly average weight of chickens during the experimental period
Table 1Traits of 10% lowest RFI and 10% highest RFI individuals
Traits Highest Lowest P-value
RFI, g 9.13 ± 2.87 −9.66 ± 3.66 –
FCR 4.20 ± 0.608 3.30 ± 0.360 < 0.01
ADG, g 21.2 ± 3.60 21.4 ± 4.18 0.666
ADFI, g 87.2 ± 9.88 69.3 ± 9.15 < 0.01
EFI,g 78.1 ± 9.28 79 ± 9.75 0.464
MMBW, g 1197 ± 131 1212 ± 122 0.377
BW8, g 742 ± 110 709 ± 97.7 0.013
the phenotypic correlation coefficients between RFI and ADG or MMBW were 0, the genetic correlation coefficient between RFI and the two traits were−0.198 and−0.125 (Table3). This demonstrated that the RFI was independ-ent of these two phenotypic traits. and this result was consistent with previously reported results [8, 26, 29].
Compared to the RFI, the genetic and phenotypic as-sociations between FCR and ADG were more close and
all showed a strong negative correlation (rg=−0.710, rp=−0.561). This meant that the FCR had a greater
im-pact on ADG and selected for low FCR individuals. This would results in an ADG increase. The genetic and phenotypic correlation coefficients between RFI and ADFI were 0.334 and 0.501, and that two correlation coefficients between FCR and ADFI wererg=−0.143 andrp=−0.11,
so the correlation coefficients of between FCR and ADFI were both much less than that between RFI and ADFI (Table 3). This suggested that choosing RFI was more beneficial for individual consumption than FCR. Overall, the FCR was primarily related to growth traits such as ADG, BW while RFI was related to energy metabolism traits such as FI.
Selection efficiency of RFI and FCR with other related traits
We obtained selection efficiencies of RFI and FCR with five related traits by calculation (Table 4). RFI had a strong positive selection effect to ADFI (0.327), but it had little effect to body weight at 56 d of age (BW8) (0.026). In addition, RFI had negative selection effect to body weight at 105 d of age (BW15), ADG and MMBW, and the effect coefficient were−0.116, −0.108 and−0.174, respectively. For FCR, it only had positive selection effect to BW8 Fig. 2Comparison between ADFI and EFI. Points above the dotted line
represent low RFI individuals with high energy utilization and below the line represent high RFI individuals with poor energy utilization
Table 2Heritability characteristics
Character Heritability (estimate ± standard deviation)
FCR 0.312 ± 0.067
RFI, g 0.282 ± 0.066
BW at 56 d of age, g 0.305 ± 0.075
BW at 115 d of age, g 0.395 ± 0.077
ADG, g 0.383 ± 0.074
MMBW, g0.75 0.321 ± 0.005
ADFI, g 0.288 ± 0.068
Table 3Genetic correlations and phenotypic correlations between FCR, RFI and other traits
Character RFI, g FCR
FCR 0.693 ± 0.094a –
0.653**b –
BW at 56 d of age, g 0.0281 ± 0.183 0.261 ± 0.166
0.111** 0.044
BW at 115 d of age, g −0.163 ± 0.167 −0.496 ± 0.132
0.050** −0.395**
ADG, g −0.198 ± 0.165 −0.710 ± 0.092
0 −0.561**
ADFI, g 0.334 ± 0.154 −0.143 ± 0.173
0.501** −0.11
MMBW, g −0.125 ± 0.178 −0.176 ± 0.173
0 −0.163**
a
Genetic correlations,rg= Mean ± standard deviation;b
Phenotypic correlations,rp; **P< 0.01
Table 4Selective reactions between RFI, FCR and related traits
Character RFI, g FCR
BW at 56 d of age, g 0.026 0.268
BW at 115 d of age, g −0.116 −0.392
ADG, g −0.108 −0.680
MMBW0.75, g −0.174 −0.691
(0.268), and the remaining four traits were negative to selective effect, especially the negative selection ef-fect to MMBW, ADG, BW15, the selection efficiency were as high as−0.691,−0.680 and−0.392, respectively, and it had a slight negative effect to ADFI (−0.155). Therefore, genetic selection of individuals with lower RFI could reduce ADFI and increase ADG. Furthermore, the selection for lower FCR would lead to better weight gain at a cost of slightly higher feed intake, but the genetic correlation considering standard error is not significantly different from 0, so not necessarily any change in feed intake, so the selection direction of RFI and FCR was consistent.
Association ofCCKARwith chicken growth and feed conversion rate
We screened 51 mutation sites in theCCKARgene. Five mutation sites were in flanking regions, five were in un-translated regions, 31 in introns and 10 in coding re-gions. Four SNPs generated amino acid substitutions (Fig.3, Additional file2: Table S2).
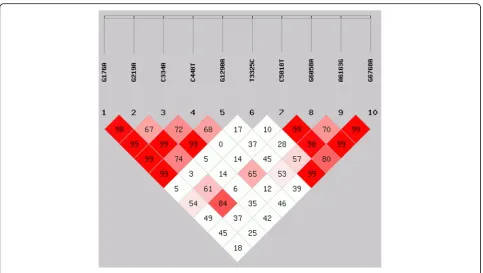
In order to see if these SNPs lead to amino acid muta-tions, we selected the SNPs of coding regions for HWE, LD and haplotype analyses. We found that the allele fre-quencies of these 10 SNPs followed the Hardy-Weinberg equilibrium rule (P > 0.05) (Additional file 3: Table S3). There was a strong LD between SNPG176A-G219A and G176A-G1290A (D′> 0.75 andr2> 0.6) as well as between SNP G219A-C448T and C334A-G1290A (D′> 0.75 and r2 > 0.3) (Fig. 4, Table 5). The LD between each SNP pair was incomplete so we used all 10 SNPs to correlate chicken growth and feed conversion rate for the next experiments.
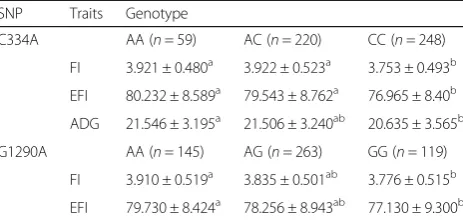
We utilized GLM function to analyze the associations of the 10 SNPs with RFI, FCR, FI, ADFI, and ADG. The asso-ciation of these SNPs with RFI and FCR were not signifi-cant. However, C334A was highly and significantly associated with FI and EFI (P< 0.01) and significantly asso-ciated with ADG (P< 0.05). The FI and EFI of individuals with the CC genotype were significantly lower than with the other two genotypes (P< 0.05). However, the ADG in this CC genotype group was significantly lower than in the AA group (P< 0.05). G1290A was significantly associated with FI and EFI (P< 0.05) in which the FI and EFI associ-ated with the GG genotype were significantly lower than those associated with the AA genotype (P< 0.05) (Table6).
Discussion
The classical breeding index FCR has been studied ex-tensively in chickens [30]. However, FCR is a nonlinear and non-normally distributed complex trait formed by the FI / BWG ratio. As FCR not only without real aver-age value or variance, but also the non-normality will be raised with the increase of variance of BWG, thus, it is difficult to reflect the true efficiency of feed utilization [31]. As the intensity of selection increases, the selection pressure will move towards FI. When the phenotypic correlation coefficient between FCR and FI or BWG is increased, the genetic advantage of FCR as the selection trait will be reduced, and the selection effect is not as good as the selection of FI or BWG. Famula and Van Vleck [32] have reported that continuous selection for low FCR individuals can improve feed utilization efficiency and increase BWG, but will leads to genetic progress more slowly and will increase the feed consumption [33]. If indi-viduals with low FCR in the same BWG were selected, it will be more beneficial to the selective process.
As a new indicator of the efficiency of feed utilization, the RFI has been widely used in chicken [34], sheep [35] and beef cattle breeding [36]. RFI is a phenotypic meas-urement independent of metabolic weight and BWG [31]. In this study, the phenotypic correlation between RFI and MBW, ADG was zero, genetically independent of metabolic weight and BWG and consistent with other studies [37]. Therefore, RFI can preferably reflect the en-ergy level needed for broiler growth maintenance [38]. Individuals with low maintenance and high growth can be bred with RFI as a selective trait.
As the FCR, ADFI and BW8 of higher RFI group were extremely significant higher (P< 0.01) than the lower RFI group. This demonstrated that the FI in the lower RFI individuals were less than the higher RFI group and that their growth performance was also better. These low RFI individuals can achieve a greater feed efficiency. The reason may be that up-regulated genes were associ-ated with energy metabolism, cell proliferation and fat metabolism [39]. Previous studies have demonstrated that individuals with a low RFI can maintain growth by increasing protein storage and glutamate synthesis, and achieve higher feed utilization and reduce nitrogen con-tent in excreta [20, 40]. Individuals with high RFI were more likely to respond to stress than individuals with low RFI [41,42]. Therefore, breeding low RFI individuals
is more beneficial to an improvement in feed efficiency for this chicken population.
FCR and RFI belong to the mid- and high- heritability of traits. The heritability of 35–42 d of age Arkansas chickens was reflected by FCR and RFI values of 0.41 and 0.42 respectively [29]. The heritability of FCR and RFI in the slow type commercial broiler chickens were 0.33 and 0.45 [43], and the heritability of FCR and RFI in the yellow-plumage dwarf chickens were 0.216 and 0.354 [20], respectively. Different varieties of chickens showed different heritability of the FCR and RFI and the RFI heritability was always greater than the FCR.
In this study, the relative selection efficiency between FCR and ADG, MMBW and ADFI were−0.680,−0.691 and−0.155, respectively. From these data, choosing the
low FCR individuals will have a significant positive effect on ADG, MMBW, and ADFI. However, the relative se-lection rates of RFI for ADG, MMBW and ADFI were−0.108, −0.174 and 0.327, respectively. This will have a positive effect on reducing ADFI if low RFI in-dividuals are selected and will slightly increase the ADG. Therefore, FCR is more suitable as a reference index to select weight related traits. If the breeding goal is to reduce FI, it is more appropriate to select RFI as the selection index.
Multiple genes control the chicken FI trait [44]. The CCKAR gene is located on chromosome 4 and plays an important regulatory role on feeding behav-iors [14, 45]. CCKAR is only expressed in low RFI individuals, and CCK can be combined with CCKAR Fig. 4Linkage disequilibrium analysis of SNPs in the study population
Table 5Haplotype analysisr2values
r2 G219A C334A C448T G1290A T3325C C5818T G6058A A6163G G6768A
G176A 0.704 0.297 0.247 0.694 0.001 0.085 0.127 0.128 0.003
G219A ─ 0.187 0.343 0.531 0.001 0.150 0.265 0.063 0.008
C334A ─ ─ 0.433 0.428 0.002 0.004 0.001 0.024 0.050
C448T ─ ─ ─ 0.168 0.000 0.004 0.055 0.016 0.072
G1290A ─ ─ ─ ─ 0.022 0.059 0.076 0.125 0.018
T3325C ─ ─ ─ ─ ─ 0.004 0.020 0.098 0.175
C5818T ─ ─ ─ ─ ─ ─ 0.150 0.175 0.039
G6058A ─ ─ ─ ─ ─ ─ ─ 0.412 0.043
to make the individual feel full. While CCKAR is not expressed in high RFI individuals, this results CCK lacks the receptor and can’t exert the function of suppressing appetite, this would lead to an FI in-crease [20, 23]. For these reasons, we studied the re-lationship between CCKAR gene polymorphisms and feed efficiency in these experiments.
The principle novelty of this research lies in the asso-ciation between variation in CCKAR gene and the phe-notypes measured. Although the 10 CCKAR SNPs were not significantly associated with either RFI or FCR, C334A and G1290A were associated with FI, EFI and ADG. The AA type was significantly higher than the CC type for FI as well as ADG at the C334A locus (P< 0.05). The AA type was significantly higher than the GG type at FI at locus G1290A (P< 0.05). Furthermore, the FCR has a strong negative selectivity on ADG, and a slight negative selectivity towards ADFI. RFI has a strong positive selectivity for ADFI but a slight negative selectivity on ADG.
Conclusions
The heritability of FCR and RFI from chickens from 56 to 105 d of age were moderate. RFI was phenotypically inde-pendent of daily gain and medium metabolic weight but there were certain genetic correlations. The FCR had a higher relative selective efficiency than RFI on weights. 51 SNPs were found in the CCKAR gene and four resulted in amino acid changes. However, only C334A and G1290A were significantly associated with the daily feed intake and daily gain.
Additional files
Additional file 1:Table S1.Primer sequences used in this study. (DOCX 18 kb)
Additional file 2:Table S2.SNPs in theCCKARgene of Tianlu Black Chickens. (DOCX 20 kb)
Additional file 3:Table S3.SNP genotypes, allelic frequencies and HWE. (DOCX 18 kb)
Abbreviations
ADFI:Average of the daily feed intake; ADG: Average daily gain; AI-REML: Average information REML; BW: Body weight; BW15: Body weight at 15 week of age; BW8: Body weight at 8 week of age; BWG: Body weight gain; CCK: Cholecystokinin; CCKAR: Cholecystokinin A receptor; CCKBR: Cholecystokinin B receptor; CCKR: Cholecystokinin receptor; CP: Crude protein; d of age: Day of age; DOT: Day of testing; EFI: Expected feed intake; FCR: Feed conversion ratio; FI: Feed intake; HWE: Hardy-Weinberg Equilibrium; LD: Linkage disequilibrium; MBW: Mid-test body weight; ME: Metabolic energy; MMBW: Mid-test metabolic body weight; RFI: Residual feed intake; SNP: Single nucleotide polymorphism
Acknowledgements
The authors would like to acknowledge the financial support from the High Technology Research and Development Program of China (2013AA102501), the National Key Technology Research and Development Program (2014BAD08B08), and the China Agriculture Research System (CARS-41-G03, CARS-41-Z17).
Availability of data and materials
All data generated or analyzed during this study available from the corresponding authors on reasonable request.
Authors’contributions
ZY and XL contributed to the design, performance of the experiment, and animal management, the collection of data, interpretation of data and writing of the manuscript. WL contributed to the design of the study, statistical analysis of the data and reviewing the study. ZX contributed to the design of the study, interpretation of data. CJ and YZ contributed to animal management and the collection of data. QN designed the experiments. XZ and DZ contributed to design the study, wrote this manuscript and were in charge of the overall project. All authors submitted comments on drafts, and read and approved the final manuscript.
Ethics approval
All experimental protocols were approved by the South China Agricultural University Institutional Animal Care and Use Committee (Guangzhou, People’s Republic of China). Animals involved in this study were humanely sacrificed as necessary to ameliorate their suffering.
Competing interests
The authors declare that they have no competing interests.
Author details
1Department of Animal Genetics, Breeding and Reproduction, College of
Animal Science, South China Agricultural University, Guangzhou 510642, Guangdong, China.2Guangdong Provincial Key Lab of Agro-Animal
Genomics and Molecular Breeding and Key Laboratory of Chicken Genetics, Breeding and Reproduction, Ministry of Agriculture, Guangzhou 510642, Guangdong, China.3Wen’s Nanfang Poultry Breeding Co. Ltd, Yunfu 527400,
Guangdong, China.
Received: 22 November 2017 Accepted: 25 April 2018
References
1. Willems OW, Miller SP, Wood BJ. Assessment of residual body weight gain and residual intake and body weight gain as feed efficiency traits in the Turkey (Meleagris gallopavo). Genet Sel Evol. 2013;45:26.
2. Atchley WR, Gaskins CT, Anderson D. Statistical properties of ratios. I. Empirical results. Syst Biol. 1976;25(2):137–48.
3. Gunsett FC. Merit of utilizing the heritability of a ratio to predict the genetic change of a ratio. J Anim Sci. 1987;65(4):936–42.
4. Xu Z, Chen J, Zhang Y, Ji C, Zhang D, Zhang X. Determination of residual feed intake and its associations with single nucleotide polymorphism in chickens. J Integr Agr. 2014;13(1):148–57.
5. Yi G. Identification of copy number variations in the chicken genome and candidate genes associated with feed efficiency using next-generation sequencing. PhD Thesis. Beijing: China Agricultural University; 2015.
Table 6Association between SNPs and other traits
SNP Traits Genotype
C334A AA (n= 59) AC (n= 220) CC (n= 248)
FI 3.921 ± 0.480a 3.922 ± 0.523a 3.753 ± 0.493b
EFI 80.232 ± 8.589a 79.543 ± 8.762a 76.965 ± 8.40b
ADG 21.546 ± 3.195a 21.506 ± 3.240ab 20.635 ± 3.565b
G1290A AA (n= 145) AG (n= 263) GG (n= 119)
FI 3.910 ± 0.519a 3.835 ± 0.501ab 3.776 ± 0.515b
EFI 79.730 ± 8.424a 78.256 ± 8.943ab 77.130 ± 9.300b
a,b
6. O'Sullivan NP, Dunnington EA, Siegel PB. Correlated responses in lines of chickens divergently selected for fifty-six-day body weight. 1. Growth, feed intake, and feed utilization. Poult Sci. 1992;71(4):590–7.
7. Koch RM, Swiger LA, Chambers D, Gregory KE. Efficiency of feed use in beef cattle. J Anim Sci. 1963;22(2):486–94.
8. Arthur PF, Archer JA, Johnston DJ, Herd RM, Richardson EC, Parnell PF. Genetic and phenotypic variance and covariance components for feed intake, feed efficiency, and other postweaning traits in Angus cattle. J Anim Sci. 2001;79(11):2805–11. 9. Cummings DE, Overduin J. Gastrointestinal regulation of food intake. J
Clin Invest. 2007;117(1):13–23.
10. Janssen P, Vanden BP, Verschueren S, Lehmann A, Depoortere I, Tack J. Review article: the role of gastric motility in the control of food intake. Aliment Pharmacol Ther. 2011;33(8):880–94.
11. Lam CK, Chari M, Rutter GA, Lam TK. Hypothalamic nutrient sensing activates a forebrain-hindbrain neuronal circuit to regulate glucose production in vivo. Diabetes. 2011;60(1):107–13.
12. Vanhoutte PM, Humphrey PP, Spedding MX. International Union of Pharmacology recommendations for nomenclature of new receptor subtypes. Pharmacol Rev. 1996;48(1):1–2.
13. Crawley JN, Fiske SM, Durieux C, Derrien M, Roques BP. Centrally administered cholecystokinin suppresses feeding through a peripheral-type receptor mechanism. J Pharmacol Exp Ther. 1991;257(3):1076–80. 14. Moran TH, Katz LF, Plata-Salaman CR, Schwartz GJ. Disordered food
intake and obesity in rats lacking cholecystokinin a receptors. Am J Phys. 1998;274(3 Pt 2):R618–25.
15. Konno K, Takahashi-Iwanaga H, Uchigashima M, Miyasaka K, Funakoshi A, Watanabe M, et al. Cellular and subcellular localization of cholecystokinin (CCK)-1 receptors in the pancreas, gallbladder, and stomach of mice. Histochem Cell Biol. 2015;143(3):301–12.
16. Asin KE, Bednarz L. Differential effects of CCK-JMV-180 on food intake in rats and mice. Pharmacol Biochem Behav. 1992;42(2):291–5.
17. Dunn IC, Meddle SL, Wilson PW, Wardle CA, Law AS, Bishop VR, et al. Decreased expression of the satiety signal receptor CCKAR is responsible for increased growth and body weight during the domestication of chickens. Am J Physiol Endocrinol Metab. 2013;304(9):E909–21.
18. Moran TH, Kinzig KP. Gastrointestinal satiety signals II. Cholecystokinin. Am J Physiol Gastrointest Liver Physiol. 2004;286(2):G183–8.
19. Fu D, Zhang D, Xu G, Li K, Wang Q, Zhang Z, et al. Effects of different rearing systems on meat production traits and meat fiber microstructure of Beijing-you chicken. Anim Sci J. 2015;86(7):729–35.
20. Xu Z, Ji C, Zhang Y, Zhang Z, Nie Q, Xu J, et al. Combination analysis of genome-wide association and transcriptome sequencing of residual feed intake in quality chickens. BMC Genomics. 2016;17:594.
21. Williams YJ, Pryce JE, Grainger C, Wales WJ, Linden N, Porker M, et al. Variation in residual feed intake in Holstein-Friesian dairy heifers in southern Australia. J Dairy Sci. 2011;94(9):4715–25.
22. Madsen P. DMU–a package for analyzing multivariate mixed models. In: Proc. 8th world Congr. Genet. Appl. Livest. Prod. Belo Horizonte, Minas Gerais, Brazil; 2006. p. 11–27.
23. Xu Z. Inheritance of feeding traits relevant to energy utilization efficiency in yellow chickens. Guangzhou: South China Agricultural University: Ph.D. Dissertation; 2014.
24. Hurst CD, Zuiverloon TC, Hafner C, Zwarthoff EC, Knowles MA. A SNaPshot assay for the rapid and simple detection of four common hotspot codon mutations in the PIK3CA gene. BMC Res Notes. 2009;2:66.
25. R Core Team. R: a language and evnvironment for statistical computing. In: R Foundation for Statistical Computing, Vienna, Austria; 2016. URLhttps:// www.R-project.org/.
26. Pakdel A, van Arendonk JA, Vereijken AL, Bovenhuis H. Genetic parameters of ascites-related traits in broilers: correlations with feed efficiency and carcase traits. Br Poult Sci. 2005;46(1):43–53.
27. Chambers JR, Bernon DE, Gavora JS. Synthesis and parameters of new populations of meat-type chickens. Theor Appl Genet. 1984;69(1):23–30. 28. Cai W, Kaiser MS, Dekkers JC. Genetic analysis of longitudinal measurements
of performance traits in selection lines for residual feed intake in Yorkshire swine. J Anim Sci. 2011;89(5):1270–80.
29. Aggrey SE, Karnuah AB, Sebastian B, Anthony NB. Genetic properties of feed efficiency parameters in meat-type chickens. Genet Sel Evol. 2010;42:25. 30. Leenstra FR, Pit R. Fat deposition in a broiler sire strain. 4. Performance of
broiler progeny of four differently selected sire lines. Poult Sci. 1988;67(1):10–5.
31. Aggrey SE, Rekaya R. Dissection of Koch's residual feed intake: implications for selection. Poult Sci. 2013;92(10):2600–5.
32. Famula TR, Van Vleck LD. Estimation of heritability and genetic trend in populations at a physiological limit. Theor Appl Genet. 1990;79(5):699–704. 33. Emmerson DA. Commercial approaches to genetic selection for growth and
feed conversion in domestic poultry. Poult Sci. 1997;76(8):1121–5. 34. Luiting P, Schrama JW, van der Hel W, Urff EM. Metabolic differences
between white leghorns selected for high and low residual food consumption. Br Poult Sci. 1991;32(4):763–82.
35. Knott SA, Cummins LJ, Dunshea FR, Leury BJ. Rams with poor feed efficiency are highly responsive to an exogenous adrenocorticotropin hormone (ACTH) challenge. Domest Anim Endocrinol. 2008;34(3):261–8. 36. Barendse W, Reverter A, Bunch RJ, Harrison BE, Barris W, Thomas MB. A
validated whole-genome association study of efficient food conversion in cattle. Genetics. 2007;176(3):1893–905.
37. Kennedy BW, van der Werf JH, Meuwissen TH. Genetic and statistical properties of residual feed intake. J Anim Sci. 1993;71(12):3239–50. 38. Romero LF, Zuidhof MJ, Renema RA, Naeima A, Robinson FE. Effects of
maternal energy efficiency on broiler chicken growth, feed conversion, residual feed intake, and residual maintenance metabolizable energy requirements. Poult Sci. 2011;90(12):2904–12.
39. Lee J, Karnuah AB, Rekaya R, Anthony NB, Aggrey SE. Transcriptomic analysis to elucidate the molecular mechanisms that underlie feed efficiency in meat-type chickens. Mol Gen Genomics. 2015;290(5):1673–82.
40. Aggrey SE, Lee J, Karnuah AB, Rekaya R. Transcriptomic analysis of genes in the nitrogen recycling pathway of meat-type chickens divergently selected for feed efficiency. Anim Genet. 2014;45(2):215–22.
41. Iqbal M, Pumford NR, Tang ZX, Lassiter K, Wing T, Cooper M, et al. Low feed efficient broilers within a single genetic line exhibit higher oxidative stress and protein expression in breast muscle with lower mitochondrial complex activity. Poult Sci. 2004;83(3):474–84.
42. Van Eerden E, Van Den Brand H, Parmentier HK, De Jong MC, Kemp B. Phenotypic selection for residual feed intake and its effect on humoral immune responses in growing layer hens. Poult Sci. 2004;83(9):1602–9. 43. N'Dri AL, Mignon-Grasteau S, Sellier N, Tixier-Boichard M, Beaumont C. Genetic relationships between feed conversion ratio, growth curve and body composition in slow-growing chickens. Br Poult Sci. 2006;47(3):273–80. 44. Yuan J, Dou T, Ma M, Yi G, Chen S, Qu L, et al. Genetic parameters of feed
efficiency traits in laying period of chickens. Poult Sci. 2015;94(7):1470–5. 45. Gibbs J, Young RC, Smith GP. Cholecystokinin decreases food intake in rats.