R E S E A R C H
Open Access
Influence of main dietary chemical
constituents on the
in vitro
gas and
methane production in diets for dairy cows
Laura Maccarana
1, Mirko Cattani
1*, Franco Tagliapietra
2, Lucia Bailoni
1and Stefano Schiavon
2Abstract
Background:Modification of chemical composition of diets fed to dairy cows might be a good strategy to reduce methane (CH4) production in the rumen. Notable reductions of CH4production compared to conventional high-roughages rations were more frequently observed for very concentrated diets or when fat supplements were used. In these cases, the reduction in the gas emission was mainly a consequence of an overall impairment of rumen function with a reduction of fiber digestibility. These strategies do not always comply with feeding standards used in intensive dairy farms and they are usually not applied owing to the risks of negative health and economic consequences. Thus, the present study evaluated the effects of seven commercial diets with contents of neutral detergent fiber (NDF), protein and lipids ranging 325 to 435 g/kg DM, 115 to 194 g/kg DM, and 26 to 61 g/kg DM, respectively, onin vitro degradability, gas (GP), and CH4production.
Results:In this experiment, changes in the dietary content of NDF, crude protein (CP) and lipids were always obtained at the expense or in favor of starch. A decreased of the dietary NDF content increased NDF (NDFd) and true DM (TDMd) degradability, and increased CH4production per g of incubated DM (P< 0.001), but not that per g of TDMd. An increase of the dietary CP level did not changein vitroNDFd and TDMd, decreased GP per g of incubated DM (P< 0. 001), but CH4production per g of TDMd was not affected. An increased dietary lipid content reduced NDFd, TDMd, and GP per g of incubated DM, but it had no consequence on CH4production per g of TDMd.
Conclusions:It was concluded that, under commercial conditions, changes in dietary composition would produce small or negligible alterations of CH4production per unit of TDMd, but greater differences in GP and CH4production would be expected when these amounts are expressed per unit of DM intake. The use of TDMd as a standardizing parameter is proposed to account for possible difference in DM intake and productivity.
Keywords:Dairy cows, Dietary manipulation, Gas production,In vitrotechniques, Methane production
Background
Mitigation of methane (CH4) production from rumen
fermentation represents an important target for animal nutritionists, as also this gas is responsible for global warming. Thus, the manipulation of dietary nutrient composition is often proposed as a strategy that farmers may exploit to reduce the proportion of energy lost by animals as eructated gases (CH4) and to improve feed
and energy efficiency [1]. There is evidence that the amount of CH4produced in the rumen is influenced by
type and content of dietary carbohydrates [2] and lipids [3]. In practice, notable reductions of CH4 production
compared to conventional high-roughages rations were more frequently observed for very concentrated diets [4] or when fat supplements [3] were used. In these cases the reduction in the gas emission was mainly a conse-quence of an overall impairment of rumen function with a reduction of fiber digestibility [5]. Thus, these strategies do not always comply with the feeding standards used in intensive dairy farms and they are usually not applied owing to the risks of negative health and economic conse-quences [6]. Compared to carbohydrates and lipids, minor effects on rumen gas production and methanogenesis are usually attributed to the crude protein (CP). In this regard,
* Correspondence:mirko.cattani@unipd.it
1Department of Comparative Biomedicine and Food Science (BCA),
University of Padova, Viale dell’Università 16, 35020 Legnaro (PD), Italy Full list of author information is available at the end of the article
[7] observed that CH4production related to CP
fermenta-tion was lower compared to that due to carbohydrate fer-mentation. To date, changes in the dietary CP content have been mainly addressed to reduce feeding costs and N excretion [8, 9]. However, dietary strategies to reduce N excretion could also have an impact because CH4
produc-tion may decline when dietary CP is replaced by rumen bypass nutrients, including starch, escaping rumen fer-mentation [10]. Despite this, little information is currently available on the effects on CH4production due to changes
in dietary CP content.
Thisin vitrostudy was aimed at evaluating the extent of alterations of true dry matter degradability (TDMd), total gas (GP) and CH4productions caused by changes in the
proportions of the main feed ingredients and of the diet-ary constituents (structural and non-structural carbohy-drates, CP and lipids) in TMR samples representative of rations commonly used in intensive farms in North Italy.
Methods
Chemical composition of the diets
Diets used in this experiment were defined after an analysis of a database containing information about ingredient and chemical composition of the rations used by 90 farms considered to be representative of the dairy farm system in North Italy [11, 12].
A corn silage-diet, containing 361, 158, and 33 g/kg of NDF, CP, and lipids, respectively, was used as a reference (Table 1). Six other diets were formulated to produce variations in the proportion of some feed ingredients, and hence in content of a given chemical constituent in favor or at the expense of starchy feeds, with respect to the reference diet. Thus, changes in the dietary content of NDF, CP and lipids, were always obtained at the expense or in favor of starch. Two diets with a low (325 g/kg DM) or a high (435 g/kg DM) content of NDF were formulated by replacing, accordingly, roughages (corn silage, alfalfa hay, and ryegrass hay) with corn and barley grains in the form of meal. The diet with the high NDF content did not contain corn silage, taking into consideration dairy farms that are not allowed to use this feed as they produce milk to be processed as Italian Protected Designation of Origin (PDO) Parmigiano-Reggiano cheese. Other two diets, with a low (115 g/kg DM) or a high CP content (194 g/kg DM), were formu-lated by replacing, accordingly, soybean meal with cereal grains (corn and barley meal). It must be underlined that the upper level of CP tested in this study corresponded to the maximum value found in the considered database of 90 farms. This value is high if compared with ranges in CP contents (118–186 g/kg DM) reported for rations used in dairy farms of North-Italy [12]. Two diets with different ether extract (EE) content were also formulated. A low EE diet (26 g/kg DM) was achieved by excluding the extruded
flaxseed (Linoies, Cortal Extrasoy, Cittadella, Italy), present in the reference diet, and increasing the content of corn, barley and soybean meal. The high EE diet (61 g/kg DM) was achieved by including whole soybean seeds, extruded soybean (Soyfull, Cortal Extrasoy, Cittadella, Italy) and ex-truded flaxseed. All diets were prepared at the laboratory of the University of Padova. For preparation, about 1 kg of each diet was ground to 1 mm using a hammer mill (Pull-erisette 19, Fritsch GmbH, Laborgeratebau, Germany). For each diet, 23 samples were randomly collected, 20 of which were used for the incubations (5 per each of the 4 incubations), whereas the remaining were used for chem-ical analysis.
Diets were analyzed in triplicate for dry matter (DM: # 934.01; [13]), nitrogen (# 976.05; [13]), EE (# 920.29; [13]), and ash (# 942.05; [13]). Neutral detergent fibre (NDF), in-clusive of residual ash, was determined with α-amylase using the Ankom220Fibre Analyzer (Ankom Technology, NY, USA). Acid detergent fibre (ADF), inclusive of residual ash, and sulphuric acid lignin (lignin(sa)) were determined
sequentially after NDF determination [14]. Starch content was determined after hydrolysis to glucose [13] by liquid chromatography [15]. Gross energy content of diets (MJ/ kg DM) was determined in duplicate by a bomb calorim-eter method [16].
Incubation
The 7 diets were incubated in 4 repeated incubation runs, conducted in 4 successive wk. Two incubations were stopped at 24 h, whereas the other two were stopped after 48 h. The incubation times of 24 and 48 h were chosen as they are, respectively, the reference times for measuring in vitroGP [17] andin vitrodegradability of NDF [18]. In each of the four incubation runs, we tested 7 diets × 5 replications, plus 5 blanks (bottles con-taining only the buffered rumen fluid; 5 blanks/run), for a total of 160 bottles incubated. A commercial GP apparatus (AnkomRF Gas Production System, Ankom Technology®, NY, USA) was used, consisting of 40 bottles equipped with pressure sensors (pressure range: from - 69 to 3,447 kPa; resolution: 0.27 kPa; accuracy: ± 0.1 % of measured value) and wireless connected to a computer. Each bottle (317 mL) was filled with 1.000 ± 0.0010 g of diet, 100 mL of a buffer solution, and 50 mL of rumen fluid (headspace volume = 167 mL), keeping the headspace of bottles flushed with CO2.
The buffer solution was prepared according to [17], heated in a water bath at 39 ± 0.4 °C and purged con-tinuously with CO2 for 30 min, to maintain anaerobic
dry sugar beet pulp, 1 kg of corn grain, and 1 kg of sun-flower meal). During the collection of rumen fluid, cows were handled according to the Italian law on animal care (Legislative Decree No. 26 of March 14, 2014). Rumen fluid was poured into thermal flasks preheated to 39 ± 0.5 °C, immediately transferred to the laboratory, strained through 3 layers of cheesecloth, to eliminate feed particles, and mixed with buffer solution in a 1 to 2 ratio [17]. Oper-ations were conducted under anaerobic conditions, by flushing with CO2, and required less than 30 min to be
completed. Bottles were placed in a ventilated oven at 39 ± 0.4 °C and automatically vented at a fixed pressure (6.8 kPa), to avoid overpressure conditions and alterations of gas and CH4measures [20].In vitroGP was monitored in
continuous, using a setting of the GP system that allows to record pressure values every minute. Other in vitro
parameters (rumen degradability, VFA and N-NH3
concen-trations, CH4production) were measured only at the end of
incubation (at 24 or 48 h), to avoid opening of the oven dur-ing the incubation, with alteration of fermentation process.
At the end of incubations (24 or 48 h), two aliquots (5 mL) of fermentation fluid were collected from each
bottle and stored at −20 °C with 1 mL of metaphos-phoric acid (25 %, w/v) to be later analyzed for ammonia N and volatile fatty acids (VFA). The content of ammo-nia N was measured using the FIAstar™ 5000 Analyzer (FOSS Analytical, Hilleroed, Denmark). The VFA profile was analyzed by GC with flame ionization detection (7820A GC system, Agilent Technologies, Milan, Italy) using a 30-m stainless steel column (J&W DB-FFAP, Agilent Technologies, Milan, Italy) and H2as carrier gas
(flow rate: 30 mL/min; isothermal oven temperature: 150 °C). Fermentation fluids were filtered into weighed crucibles (30 mL, Robu Glasfilter-Geräte GMBH®, Hattert, Germany) and analyzed for residual NDF using a Fibretech Analyzer (VELP® Scientifica, Milan, Italy).
At the end of each incubation (24 or 48 h), gas was collected with a 10-mL gas-tight syringe (Artsana S.p.A., Como, Italy) from the bottle headspace (HS). At each sampling, the syringe was flushed in order to collect a homogeneous sample, which was immediately trans-ferred into a 9-mL vacuette (Greiner Bio-One GmbH, Kremsmunster, Austria). From each vacuette, an aliquot (10 μL) of gas was sampled with a gas-tight syringe
Table 1Feed ingredients, chemical composition and gross energy content of seven diets
Reference Low NDF High NDF Low CP High CP Low Lipid High Lipid Ingredients, g/kg DM
Corn silage 351 430 – 375 281 351 351 Alfalfa hay 89 23 134 66 156 89 89 Ryegrass hay 47 – 231 43 52 47 56 Meadow hay 47 – 227 47 52 47 60 Corn grain 205 228 152 258 147 218 160 Barley grain 119 171 92 160 90 122 100 Soybean meal, (sol. extr., 44) 113 119 126 27 188 126 18 Whole soybean seeds, cracked – – – – – – 68 Extruded soybean seeds – – – – – – 68 Extruded flaxseed seeds 29 29 38 24 34 – 29 Chemical composition, g/kg DM
Crude protein (CP) 158 152 161 115 194 161 158 Starch 273 273 100 332 176 265 233 NDF 361 325 435 358 357 359 360 Hemicellulose 169 171 189 172 158 171 169 ADF 192 154 246 186 199 188 191 Cellulose 163 134 203 160 167 163 163 Lignin(sa) 29 20 43 26 32 25 28
NFCa 395 443 302 446 357 402 367 Ether extract 33 34 38 34 34 26 61
Ash 53 46 64 47 58 52 54
Gross energy, MJ/kg DMb 16.8 16.9 17.3 16.8 17.3 16.5 16.7 a
NFCNot Fiber Carbohydrates computed as 100 - NDF - CP - EE - Ash
b
(1701 N, Hamilton, Bonaduz, Switzerland) and immedi-ately analyzed for CH4concentration by GC with flame
ionization detection (7820A GC system, Agilent Tech-nologies, Milan, Italy) using a 15-m carbon layer column (GS-CarbonPLOT, Agilent Technologies, Milan, Italy) and H2as carrier gas (flow rate: 1.6 mL/min; isothermal
oven temperature: 40 °C). An 11-point calibration curve was generated from eleven gas mixtures containing 2, 4, 8, 16, 24, 32, 60, 100, 140, 180, and 240 mL of CH4/L
(99.5 % pure, SAPIO s.r.l., Monza, Italy), respectively, and known volumes of air. Mixtures were prepared using the same graduated gas-tight syringe (1701 N, Hamilton). The calibration regression had R2> 0.99.
Computations
The NDF degradability (NDFd) and the true DM de-gradability (TDMd) were calculated according to [18].
Recently, [20], using vented bottles connected to tight bags for gas collection, calculated CH4production (mL)
as: [CH4 concentration in HS] × [HS volume] + [CH4
concentration in the gas bag × GP]. To evaluate the possibility of avoiding the use of bags, to save space and increase the number of replicates, amount of CH4 lost
with gas venting was computed using the unpublished data of a previous study, where 4 forages and 3 concen-trates were incubated in 42 bottles (6 bottles/feed) for 6, 24, or 48 h using the same GP equipment and the same operative conditions of the present experiment. It was found that total CH4 production is predictable, with
ac-ceptable precision and accuracy, as:−0.0064 × [CH4
con-centration in HS × (HS volume + GP)]2+ 0.9835 × [CH4
concentration in HS × (HS volume + GP)]. This equation had a residual standard deviation of only 0.1770 mL, and R2= 0.9993. Thus, the present experiment was conducted without the use of tight bags for gas collection. The CH4
production was computed using the above described equation and it was expressed as mL/g DM incubated, mL/g of digested NDF (dNDF), mL/g TDMd, or mL/ 100 mL GP.In vitroGP and CH4were also predicted from
VFA production, according to [21].
Statistical analysis
The mean of the 5 replications for each diet in each incu-bation run was computed. These 28 means were analyzed using PROC MIXED of SAS [22] using a model consider-ing the diet (D; 6 df), the incubation time (IT, 1 df), and the interaction diet × incubation time as fixed factors, the run within incubation time (2 df) as a random blocking factor and the residual error terme(18 df). As the diet × incubation time interaction was never significant, it was excluded from the model. Contrasts were run to analyze statistical differences among diets with different contents of a given chemical constituent, using the Bonferroni ad-justment to perform multiple comparisons.
Results
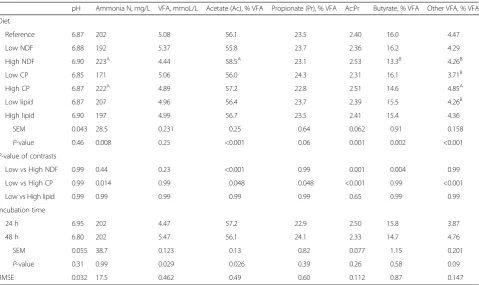
Changes of the feed ingredients proportions and of diet-ary contents of chemical constituents had influence on the various parameters ofin vitrofermentation (Table 2). As expected, pH values measured at the end of fermen-tation were not influenced by the dietary changes. The ammonia N content increased with increasing dietary CP content (P= 0.014). No influence of the diets was observed on the VFA production, but the proportion of acetate or butyrate decreased (P< 0.001) or increased (P= 0.004), respectively, with a decrease of NDF con-tent, whereas the proportion of propionate decreased (P= 0.048) with increasing dietary CP. Thus, the ratio between acetate and propionate decreased with de-creasing level of NDF (P= 0.001) and of CP (P< 0.001), and the corresponding increasing level of starch. Increasing proportions of dietary CP increased the pro-portion of other VFA (P< 0.001) found in the rumen fluid. Changes of dietary EE content had no conse-quence on the various rumen fluid parameters. The prolongation of the incubation time from 24 to 48 h in-creased the VFA production (P= 0.029), but it did not influence pH and ammonia N values.
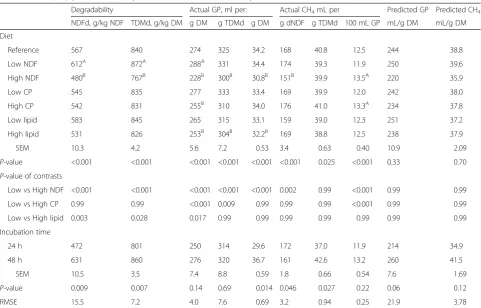
The NDFd, TDMd, and the GP expressed per unit of in-cubated DM or per unit of TDMd (Table 3) increased with a decrease of NDF content (P< 0.001 for all). When the NDF content decreased, the CH4production increased
per unit of incubated DM (P< 0.001) and per g of digested NDF (P= 0.002), but not per unit of TDMd. The increased dietary CP content, with the corresponding decrease of starch, had no influence on NDFd or TDMd, but GP was lowered. No influence was observed on the production of CH4, except when this was expressed as a proportion of
GP (mL CH4/100 mL GP; P< 0.001). An increased
inclu-sion of extruded oilseeds in the diet reduced both NDFd (P= 0.003) and TDMd (P= 0.028), and the measured GP expressed per g of incubated DM (P= 0.017), but no influ-ences were observed on the CH4yield. A prolonged
dur-ation of the incubdur-ation, from 24 to 48 h, increased NDFd (P= 0.009), TDMd (P= 0.007), and CH4 production, both
per unit of incubated DM (P= 0.014) and per unit of TDMd (P= 0.027). The correlation between measured and predicted values showed R2to be 0.78 and 0.74, respect-ively, for gas and CH4measures (data not shown), and the
relationship obtained by regressing measured values of CH4
(mL/g DM; y) against those predicted (mL/g DM; x) was the following: measured CH4= 0.95 × predicted CH4–2.6.
Predicted values of GP and CH4productions were not
in-fluenced either by dietary changes or by incubation time.
Discussion
General considerations
composed mainly by cereal grains, corn silage and vari-ous hays. It should be preliminarily considered that in this study the variation in the content of the various nu-trients, namely, NDF, CP and lipid, were always achieved by decreasing or increasing the proportion of dietary starch. In the scientific literature, in vitro evaluation of gas and CH4productions is commonly carried out using
single feeds, mainly forages, whereas less information is available for complete diets [23].In vivomeasurement of gas and CH4 production requires expensive equipment
and it is labor and time consuming. In vitro techniques would permit a much more simple determination of the dietary characteristics which can influence the potential emission of gas and CH4 from their fermentation in a
simulated rumen environment [20]. Studies of the relationships between in vitro and in vivo gas and CH4
productions are lacking [23]. However, a recent study suggested that in vitro gas and CH4measurements can
be indicative of the trend ofin vivoCH4production
ori-ginating from different combinations of feed ingredients [24]. This study was aimed at evaluating if changes in the diet composition might or might not have notable influence on gas and CH4productions.
After 24 h of fermentation, the measured GP of the various diets was, on average, 250 mL/g DM, suggesting that a cow consuming 20 kg/d DM might produce about 5,000 L/d of gas. The CH4production from fermentation
of these diets ranged 30.8 to 34.4 mL/g DM, suggesting that, for a DM intake of 20 kg/d, a cow might produce 616 to 688 L/d of CH4. Sauer et al. (1998) reported
in vivo CH4production of lactating cows in the order of
622 L/d, corresponding to 38.9 mL/g DM intake. In the study of [25], CH4 production from dairy cows was
29.2 mL/g DM intake, whereas [26] reported for sheep an averaged CH4 production of 31.0 mL/g DM intake.
In a continuous culture fermenter, [27] measured an averaged CH4production of 33.0 mL/g DM. Thein vitro
CH4production of the dairy rations tested by [23] varied
from 30.1 to 35.9 mL/g DM, a range consistent with results obtained in this study. However, comparison with data from literature is difficult because huge varia-tions in gas and CH4 productions are commonly
ob-served across experiments, even for diets with similar composition. This is the consequence of a combination of different biological, as rumen fluid characteristics, and technical factors, as fermentation procedures and
Table 2Effect of diets and incubation time on pH, ammonia N concentration, volatile fatty acid production (VFA) and molar proportions of acetate, propionate, butyrate and other VFA
pH Ammonia N, mg/L VFA, mmoL/L Acetate (Ac), % VFA Propionate (Pr), % VFA Ac:Pr Butyrate, % VFA Other VFA, % VFA Diet
Reference 6.87 202 5.08 56.1 23.5 2.40 16.0 4.47 Low NDF 6.88 192 5.37 55.8 23.7 2.36 16.2 4.29 High NDF 6.90 223A 4.44 58.5A 23.1 2.53 13.3B 4.26B Low CP 6.85 171 5.06 56.0 24.3 2.31 16.1 3.71B
High CP 6.87 222A 4.89 57.2 22.8 2.51 14.6 4.85A
Low lipid 6.87 207 4.96 56.4 23.7 2.39 15.5 4.26B High lipid 6.90 197 4.99 56.7 23.5 2.41 15.4 4.36
SEM 0.043 28.5 0.231 0.25 0.64 0.062 0.91 0.158
P-value 0.46 0.008 0.25 <0.001 0.06 0.001 0.002 <0.001
P-value of contrasts
Low vs High NDF 0.99 0.44 0.23 <0.001 0.99 0.001 0.004 0.99 Low vs High CP 0.99 0.014 0.99 0.048 0.048 <0.001 0.99 <0.001 Low vs High lipid 0.99 0.99 0.99 0.99 0.99 0.65 0.99 0.99 Incubation time
24 h 6.95 202 4.47 57.2 22.9 2.50 15.8 3.87 48 h 6.80 202 5.47 56.1 24.1 2.33 14.7 4.76 SEM 0.055 38.7 0.123 0.13 0.82 0.077 1.15 0.201
P-value 0.31 0.99 0.029 0.026 0.39 0.26 0.58 0.09 RMSE 0.032 17.5 0.462 0.49 0.60 0.112 0.87 0.147
Values with different superscripts within column are significantly (P< 0.05) higher (A) or lower (B) compared to the reference diet (containing 361, 158, and 33 g/kg DM of NDF, CP, and lipids)
equipment for collection, measurement and analysis [28]. In this experiment the observed GP and CH4were
regressed against the GP and CH4 values predicted
from the stoichiometry of the VFA production, to ob-tain an internal control of consistency of the data. The correlations found (R2= 0.78 and 0.74, respectively, for gas and CH4 measures) are acceptable considering the
rather narrow range of variation in GP and CH4
pro-duction caused by the dietary changes. It was observed that the SEM of predicted GP and CH4 production
(21.9 and 3.78 mL/g DM, respectively) was about five times greater than the corresponding values of the measured GP and CH4production. In other words, the
measure of the VFA production was less precise than the GP and CH4measures.
Effects on NDF degradability, gas and CH4production
due to changes in the NDF content
In this experiment, the diet with the low level of NDF (325 g/kg DM) was based on corn silage and a small amount of alfalfa hay (23 g/kg DM) as forage sources.
On the contrary, the diet with the high level of NDF (435 g/kg DM) was based on different hays and did not contain corn silage. This is of interest in Italy as use of silages for the production of important Protected De-nomination of Origin (PDO) cheeses (i.e., Parmigiano-Reggiano) is forbidden by specific feeding regulations. From the results it emerged that NDF degradability was negatively influenced by the dietary NDF content, par-tially because of the complete replacement of corn silage with hays. This would be in agreement with previous observations that the NDF fraction of hay samples col-lected in the same area of the present experiment were less degradable than corn silage samples [19].
In diets similar for ingredient composition to those used in this experiment, [12] observed an increased CH4
production (35.6 to 44.3 mL/g DM) with decreasing NDF content. In the present study, a decrease from 435 to 325 g NDF/kg DM increased CH4 production from
30.8 to 34.4 mL/g DM (+11.6 %). This is consistent with an increased true degradability of the feed (+14 %), but also of the NDF fibrous fraction (+27 %). This seems to
Table 3Effects of diets and incubation time on in vitro degradability of NDF (NDFd) and of true DM (TDMd), gas production (GP) and methane (CH4) production, and predicted values of GP and CH4production
Degradability Actual GP, ml per: Actual CH4mL per Predicted GP Predicted CH4
NDFd, g/kg NDF TDMd, g/kg DM g DM g TDMd g DM g dNDF g TDMd 100 mL GP mL/g DM mL/g DM Diet
Reference 567 840 274 325 34.2 168 40.8 12.5 244 38.8 Low NDF 612A 872A 288A 331 34.4 174 39.3 11.9 250 39.6 High NDF 480B 767B 228B 300B 30.8B 151B 39.9 13.5A 220 35.9 Low CP 545 835 277 333 33.4 169 39.9 12.0 242 38.0 High CP 542 831 255B 310 34.0 176 41.0 13.3A 234 37.8 Low lipid 583 845 265 315 33.1 159 39.0 12.3 251 37.2 High lipid 531 826 253B 304B 32.2B 169 38.8 12.5 238 37.9 SEM 10.3 4.2 5.6 7.2 0.53 3.4 0.63 0.40 10.9 2.09
P-value <0.001 <0.001 <0.001 <0.001 <0.001 <0.001 0.025 <0.001 0.33 0.70
P-value of contrasts
Low vs High NDF <0.001 <0.001 <0.001 <0.001 <0.001 0.002 0.99 <0.001 0.99 0.99 Low vs High CP 0.99 0.99 <0.001 0.009 0.99 0.99 0.99 <0.001 0.99 0.99 Low vs High lipid 0.003 0.028 0.017 0.99 0.99 0.99 0.99 0.99 0.99 0.99 Incubation time
24 h 472 801 250 314 29.6 172 37.0 11.9 214 34.9 48 h 631 860 276 320 36.7 161 42.6 13.2 260 41.5 SEM 10.5 3.5 7.4 8.8 0.59 1.8 0.66 0.54 7.6 1.69
P-value 0.009 0.007 0.14 0.69 0.014 0.046 0.027 0.22 0.06 0.12 RMSE 15.5 7.2 4.0 7.6 0.69 3.2 0.94 0.25 21.9 3.78
Values with different superscripts within column are significantly (P< 0.05) higher (A) or lower (B) compared to the reference diet (containing 361, 158, and 33 g/kg DM of NDF, CP, and lipids)
be contradictory with current literature, as a decrease of dietary NDF commonly reduces the NDF degradability [12]. However, also [29] evidenced that a decrease of the dietary NDF content increased by 43 % in vivo CH4
production expressed per unit of dNDF. Results also evi-denced that GP increased with a decrease of NDF con-tent even when expressed per unit of TDMd (+10 %), but no influences were observed on the CH4production
per unit of TDMd. A different trend emerged when CH4
production was referred to the total GP. In this case, the decrease of NDF lowered the CH4 proportion by about
12 % (13.5 to 11.9 mL CH4/100 mL GP, for the high and
the low content of NDF, respectively). Results suggest that a decrease of dietary NDF content, achieved from a complete replacement of hays with corn silage and cereal grains, might increase feed digestibility without changing GP and CH4 produced per unit of digested
material.
Effects on gas and CH4production due to changes in the
CP content
In this experiment an increased proportion of CP, in replacement of starch, caused a reduction of GP. The negative influence of dietary CP on GP has been ob-served by others in the past. Such an effect was at-tributed to the buffer capacity of CP, that reduces the indirect CO2 released from the buffered rumen fluid,
and to the stoichiometry of protein fermentation, that differs from that of carbohydrates [30, 31]. In this study, increase of the CP content was associated to a decrease of dietary starch. As a consequence, some VFA as iso-butyric and iso-valeric acids were in-creased, being end-products of protein degradation [32], whereas the production of propionate decreased and the ratio between acetate and propionate in-creased. Changes in the dietary CP proportion had no effect on CH4 production when expressed both per
unit of incubated DM and per unit of TDMd. Thus, as CP depresses GP, an increased proportion of CP increases the CH4concentration on total GP.
Effects on gas and CH4production due to changes in the
lipid content
In this experiment changes in the dietary fat content of the diets were achieved by changing the proportions of extruded flaxseeds, extruded soybean and whole soybean seeds. The threshold of 60 g fat/kg DM was considered to be the upper limit to avoid a possible impairment of feed digestibility [6, 33].
The effect of dietary lipids on CH4 production is
dependent on the source, FA profile, level of inclusion, and diet composition [34]. The level of supplementa-tion and the physical form of the lipid supplement
affect its availability in the rumen, and these factors ap-pear to be more important than the FA profile [35]. In this regard, [36], using dairy cows housed in respiratory chambers, found that, compared to the control, the average reduction in CH4 (L/kg DMI) per 10 g/kg of
crude fat added was persistent throughout lactation. The same authors observed that the most effective lipid source in reducing methanogenesis was a commercial vegetal rumen protected fat fortified with hydroxy-methionine-analog-isobutyrate (−5.5 % of CH4),
followed by vegetal rumen protected fat (−2.3 %), and by whole cracked rapeseed (−0.8 %). In the experiment of [35], only crushed canola seeds lowered CH4
produc-tion per unit of digestible DM intake (−15 %), whereas crushed flaxseeds and crushed sunflower seeds did not reduce CH4production compared to the control diet (a
diet supplemented with a commercial source of calcium salts of long chain fatty acids). In the current experi-ment, fat addition reduced feed degradability, particu-larly that of the NDF fraction. No influences were found on total VFA production and on the proportion of acetate, propionate and butyrate, whereas GP and CH4productions decreased by 8 and 6 %, respectively,
compared to the reference diet. However, differences were greatly reduced when GP and CH4were expressed
per unit of TDMd suggesting that, under the commer-cial conditions evaluated in this study, small reductions of CH4might be achieved.
Conclusions
Changes of the ingredient and chemical composition of diets were analyzed to evaluate benefits in the amount of CH4 produced, for the north eastern Italian dairy
pro-duction chain. It was found that a replacement of hays with corn silage and cereals might increase GP and CH4
per unit of DM intake. An increase of the dietary CP content would reduce GP with no influences in the amount of CH4produced, whereas a moderate addition
of cracked soybean seeds, and extruded flaxseed had few, or any, influence on thein vitroGP and CH4
produc-tions. In general, none of the various strategies tested in the present work was able to reduce the amount of CH4
produced, especially if this production is expressed per unit of digestible DM intake. More research is needed to evaluate the effectiveness of strategies to reduce the CH4
emissions, and relationships between in vitroand in vivo
gas and CH4productions need to be developed.
Abbreviations
Acknowledgments
This work was financed by the project“ARCHAEA - Feeding strategies to reduce methane emissions from dairy cows” –Veneto Region Rural Development Programme (RDP) 2007–2013.
Authors’contributions
All authors conceived of this experiment, due to experience gained over the last years in the use ofin vitrogas production technique for the evaluation of ruminant feeds. LM and MC gave substantial contributions to analytical procedures, statistical analysis, and writing of the manuscript. FT, LB, and SS contributed in revising critically the manuscript. All authors read and approved the final manuscript.
Competing interests
The authors declare that they have no competing interests.
Author details 1
Department of Comparative Biomedicine and Food Science (BCA), University of Padova, Viale dell’Università 16, 35020 Legnaro (PD), Italy.
2Department of Agronomy, Food, Natural resources, Animals and
Environment (DAFNAE), University of Padova, Viale dell’Università 16, 35020 Legnaro (PD), Italy.
Received: 14 January 2016 Accepted: 17 August 2016
References
1. Cottle DJ, Nolan JV, Wiedemann SG. Ruminant enteric methane mitigation: a review. Anim Prod Sci. 2011;51(6):491–514.
2. Ellis JL, Kebreab E, Odongo NE, McBride BW, Okine EK, France J. Prediction of methane production from dairy and beef cattle. J Dairy Sci. 2007;90(7): 3456–466.
3. Grainger C, Beauchemin KA. Can enteric methane emissions from ruminants be lowered without lowering their production? Anim Feed Sci Technol. 2011;166–167:308–20.
4. Johnson KA, Johnson DE. Methane emissions from cattle. J Anim Sci. 1995; 73(8):2483–92.
5. Patra AK. Enteric methane mitigation technologies for ruminant livestock: a synthesis of current research and future directions. Environ Monit Assess. 2012;184(4):1929–952.
6. Kumar S, Choudhury PK, Carro MD, Griffith GW, Dagar SS, Puniya M, et al. New aspects and strategies for methane mitigation fromruminants. Appl Microbiol Biotechnol. 2014;98(1):31–44.
7. Bannink A, Dijkstra J, Mills JAN, Kebreab E, France J. Nutritional strategies to reduce enteric methane formation in dairy cows. In: Emissions from European Agriculture. 2005. p. 367–76.
8. Yan T, Frost JP, Keaty TWJ, Agnew RE, Mayne CS. Prediction of nitrogen excretion in feces and urine of beef cattle offered diets containing grass silage. J Anim Sci. 2007;85(8):1982–989.
9. Schiavon S, Cesaro G, Tagliapietra F, Gallo L, Bittante G. Influence of N shortage and conjugated linoleic acid supplementation on some productive, digestive, and metabolic parameters of lactating cows. Anim Feed Sci Technol. 2015;208:86–97.
10. Dijkstra J, Oenema O, Bannink A. Dietary strategies to reducing N excretion from cattle: implications for methane emissions. Curr Opin Environ Sustain. 2011;3(5):414–22.
11. Dal Maso M, Tagliapietra F, Cattani M, Fracasso A, Miotello S, Schiavon S. Characteristics of dairy farms in the North-Eastern part of Italy: rations, milk yield and nutrients excretion. Ital J Anim Sci. 2009;8(2):295–97.
12. Pirondini M, Malagutti L, Colombini S, Amodeo P, Crovetto GM. Methane yield from dry and lactating cows diets in the Po Plain (Italy) using an in vitro gas production technique. Ital J Anim Sci. 2012;11(3):330–35. 13. International AOAC. Official Methods of Analysis. 19th ed. Gaithersburg:
AOAC International; 2012.
14. Robertson JB, Van Soest PJ. The detergent system of analysis and its application to human foods. In: James WPT, Theander O, editors. The Analysis of Dietary Fiber in Food. New York: Marcel Dekker Inc; 1981. p. 123–58.
15. Bouchard J, Chornet E, Overend RP. High-performance liquid
chromatographic monitoring carbohydrate fractions in partially hydrolyzed corn starch. J Agric Food Chem. 1988;36(6):1188–192.
16. ISO 9831. Animal feeding stuffs, animal products, and faeces or urine– Determination of gross calorific value–Bomb calorimeter method. Geneva: ISO 9831; 1988.
17. Menke KH, Steingass H. Estimation of the energetic feed value obtained from chemical analysis and gas production using rumen fluid. Anim Res Dev. 1988;28:7–55.
18. Goering HK, Van Soest PJ. Forage fiber analysis (apparatus, reagents, procedures, and some applications). Agricultural hand-book no. 379. Washington, DC: USDA; 1970.
19. Tagliapietra F, Cattani M, Hindrichsen IK, Hansen HH, Colombini S, Bailoni L, et al. True dry matter digestibility of feeds evaluated in situ with different bags and in vitro using rumen fluid collected from intact donor cows. Anim Prod Sci. 2012;52(5):338–346.
20. Cattani M, Tagliapietra F, Maccarana L, Hansen HH, Bailoni L, Schiavon S. Technical note: In vitro total gas and methane production measurements from closed or vented rumen batch culture systems. J Dairy Sci. 2014;97(3): 1736–741.
21. Blümmel M, Aiple KP, Steingass H, Becker K. A note on the stoichiometrical relationship of short chain fatty acid production and gas formation in vitro in feedstuffs of widely differing quality. J Anim Physiol Anim Nutr. 1999; 81(3):157–67.
22. Institute SAS. SAS User’s Guide: Basics. Cary: SAS Inst. Inc.; 2007. 23. Getachew G, Robinson PH, Depeters EJ, Taylor SJ, Gisi DD, Higginbotham
GE, Riordan TJ. Methane production from commercial dairy rations estimated using an in vitro gas technique. Anim Feed Sci Technol. 2005; 123–124(1):391–402.
24. Hatew B, Cone JW, Pellikaan WF, Podesta SC, Bannink A, Hendriks WA, et al. Relationship between in vitro and in vivo methane production measured simultaneously with different starch sources and starch levels in dairy cattle. Anim Feed Sci Technol. 2015;202:20–31.
25. Holter JB, Young AJ. Methane production in dry and lactating cows. J Dairy Sci. 1992;75(8):2165–175.
26. Moss AR. Environmental control of methane production by ruminants. In: Young BA, editor. Greenhouse gases and animal agriculture, Takahashi, J. Amsterdam, The Netherlands: Elsevier; 2002. p. 67–76.
27. Eun JS, Fellner V, Gumpertz ML. Methane production by mixed ruminal cultures incubated in dual-flow fermenters. J Dairy Sci. 2004;87(1):112–21. 28. Maccarana L, Cattani M, Mantovani R, Tagliapietra F, Schiavon S, Bailoni L. Assessment of factors influencing in vitro gas and methane production by meta-analysis. Milan: Proceedings of the 21st ASPA Congress; 2015. p. 22. 29. Pirondini M, Colombini S, Mele M, Malagutti L, Rapetti L, Galassi G, et al.
Effects of dietary starch concentration and fish oil supplementation on milk yield and composition, diet digestibility, and methane emissions in lactating dairy cows. J Dairy Sci. 2015;98(1):357–372.
30. Cone JW, Van Gelder AH. Influence of protein fermentation on gas production profiles. Anim Feed Sci Technol. 1999;76:251–164.
31. Tagliapietra F, Cattani M, Hansen HH, Hindrichsen IK, Bailoni L, Schiavon S. Metabolizable energy content of feeds based on 24 or 48 h in situ NDF digestibility and on in vitro 24 h gas production methods. Anim Feed Sci Technol. 2011;170:182–91.
32. Hungate RE. The rumen and its microbes. New York: New York Academic Press; 1966.
33. Jenkins T. Success of fat in dairy rations depends on the amount. Feedstuffs. 1997;69:11–12.
34. Knapp JR, Laur GL, Vadas PA, Weiss WP, Tricarico JM. Invited review: enteric methane in dairy cattle production: quantifying the opportunities and impact of reducing emissions. J Dairy Sci. 2014;97(6):3231–261.
35. Beauchemin KA, McGinn SM, Benchaar C, Holtshausen L. Crushed sunflower, flax, or canola seeds in lactating dairy cow diets: Effects on methane production, rumen fermentation, and milk production. J Dairy Sci. 2009; 92(5):2118–127.