ARTICLE
Vaccination Coverage by Special Health Care Needs
Status in Young Children
Kathleen S. O’Connor, MPH, Matthew D. Bramlett, PhD
Department of Health and Human Services, Centers for Disease Control and Prevention, National Center for Health Statistics, Division of Health Interview Statistics, Hyattsville, Maryland
The authors have indicated they have no financial relationships relevant to this article to disclose.
What’s Known on This Subject
Current vaccination estimates represent the entire population of children 19 to 35 months of age in the United States and may not reflect vaccination status of an impor-tant subgroup: children with special health care needs.
What This Study Adds
This study presents the first nationally representative assessment of the immunization status of young children with special health care needs.
ABSTRACT
OBJECTIVE.The purpose of this study was to compare vaccination coverage among
children 19 to 35 months of age with and without special health care needs overall and among demographic subgroups.
METHODS.Data are from the National Survey of Children With Special Health Care
Needs, a module of the State and Local Area Integrated Telephone Survey, which was sponsored by the Health Resources and Services Administration Maternal and Child Health Bureau and conducted in 2000 –2002 by the Centers for Disease Control and Prevention National Center for Health Statistics. We used data from the National Immunization Survey and the National Survey of Children With Special Health Care Needs to examine immunization coverage rates for individual vaccines and an array of combined series vaccinations. The relationship between special needs and immu-nization status was analyzed by age, gender, and race or ethnicity of the child; the child’s health insurance type; the mother’s educational attainment and presence in the household; and household income relative to the federal poverty level.
RESULTS.Overall, there were no significant differences between children with and
without special needs for any of the individual antigens or combined immunization series. Some significant differences by special needs status were found within certain demographic subgroups.
CONCLUSIONS.Our results suggest that, generally children with special health care needs
have immunization rates that are very similar to typically developing children. There is some evidence that children with special health care needs are at risk for under-immunization if they are non-Hispanic white or live in an affluent household and are more likely to be immunized if they are Hispanic, poor, publicly insured, or if their mothers did not complete high school. These findings may be due to outreach or support programs that target disadvantaged children. However, it is important to note that the majority of comparisons within demographic subgroups show no significant differences between children with special health care needs and children without special health care needs.
H
EALTHY PEOPLE 2010goals call for effective vaccination coverage levels of 90% among children 19 to 35 months of age for vaccinations recommended by the Advisory Committee on Immunization Practices.*1,2 According to the Centers forDisease Control and Prevention (CDC), vaccination coverage in 2002 for children 19 to 35 months of age ranged from 40.9% for the pneumococcal conjugate vaccine to 94.9% for ⱖ3 doses of the diphtheria and tetanus toxoids and pertussis vaccine (DTP)/diphtheria and tetanus toxoids vaccine (DT)/diphtheria and tetanus toxoids and acellular pertussis vaccine (DTaP).3For the combined series, coverage estimates
*Vaccinations examined in this report to determine immunization status include the following: diphtheria and tetanus toxoids and pertussis vaccine/diphtheria and tetanus toxoids/diphtheria and tetanus toxoids and acellular pertussis vaccine (DTP/DT/DTaP)ⱖ3 doses; DTP/DT/DTaPⱖ4 doses; poliovirusⱖ3 doses; measles/mumps/rubellaⱖ1 dose; measles-containing vaccineⱖ1 dose; Haemophilus influenzaetype bⱖ3 doses; hepatitis Bⱖ3 doses; varicellaⱖ1 dose; combined series examined include the following: 4:3:1 (DTP/DT/DTaPⱖ4 doses, poliovirusⱖ3 doses, measles-containing vaccineⱖ1 dose); 4:3:1:3 (4:3:1 series plusHaemophilus influenzaetype bⱖ3 doses); 4:3:1:3:3 (4:3:1:3 series plus hepatitis Bⱖ3 doses); and combined series composed of the 4:3:1:3:3 plusⱖ1 dose of varicella vaccine.
www.pediatrics.org/cgi/doi/10.1542/ peds.2007-0305
doi:10.1542/peds.2007-0305
The content of this article reflects the opinions of the authors and not that of the Department of Health and Human Services.
Key Words
vaccination, children with special health care needs
Abbreviations
CDC—Centers for Disease Control and Prevention
DTP— diphtheria and tetanus toxoids and pertussis vaccine
DT— diphtheria and tetanus toxoids vaccine DTaP— diphtheria and tetanus toxoids and acellular pertussis vaccine
4:3:1— combined series composed ofⱖ4 doses of DTP/DT/DTaP,ⱖ3 doses of poliovirus vaccine, andⱖ1 dose of MCV 4:3:1:3— combined series composed of the 4:3:1 plusⱖ3 doses of Hib vaccine 4:3:1:3:3: combined series composed of the 4:3:1:3 plusⱖ3 doses of hepatitis B vaccine CSHCN—children with special health care needs
MCHB—Maternal and Child Health Bureau NIS—National Immunization Survey NS-CSHCN—National Survey of Children With Special Health Care Needs SLAITS—State and Local Area Integrated Telephone Survey
FPL—federal poverty level
MMR—measles, mumps, and rubella vaccine Hib—Haemophilus influenzaetype b MCV—measles-containing vaccine
ranged from 65.5% for the 4:3:1:3:3;1 series to 78.5% for the 4:3:1 series.3These estimates represent the entire
population of children 19 to 35 months of age in the United States and may not reflect vaccination status of an important subgroup: children with special health care needs (CSHCN). Immunization is a significant compo-nent of the provision of comprehensive preventive and primary care services for all children, including those with special health care needs.4
CSHCN, as defined by the Maternal and Child Health Bureau (MCHB) of the Health Resources and Services Administration, are children who have or are at risk of a physical, developmental, behavioral, or emotional con-dition and require health or related services of a type or amount beyond that required by children generally.5
CSHCN are identified by the CSHCN Screener as those children who experience ⱖ1 of the following 5 health consequences resulting from a medical condition that has lasted or is expected to last for a period of ⱖ12 months: use of prescription medications; use of health care services above the average for a child the same age; limitation in activities that most children the same age can do; use of physical, occupational, or speech therapy; or having a behavioral, emotional, or developmental condition requiring treatment or counseling.6,7
Nation-ally representative vaccination coverage estimates for CSHCN have heretofore been unavailable because of the lack of a data set that included consistent, valid, and reliable CSHCN screener data and immunization data. We used vaccination coverage data from the National Immunization Survey (NIS) along with data from the National Survey of CSHCN (NS-CSHCN) to present the first nationally representative assessment of the immu-nization status of young children with and without spe-cial health care needs.
PREVIOUS RESEARCH
A thorough literature review revealed a small number of studies that characterize the immunization status of chronically ill children. Most are limited to specific sub-populations, vaccines, or diagnoses. Examples include vaccination coverage in children with spina bifida8;
pe-diatric cardiology clinic patients9,10; premature, low, and
very low birth weight infants11,12; chronically ill children
attending specialty or subspecialty clinics13,14; enrollees
in a consortium of 6 community-based clinics15; a mix of
medical and surgical subspecialty patients in addition to typically developing preschool-aged children admitted to the hospital for treatment16; children 4 months to 16
years of age being assessed for a liver transplant17; and
DTP coverage in neonatal intensive care nursery gradu-ates.18Additional articles characterize the immunization
status of hospitalized preschool-aged children.19–21
The evidence of a relationship between chronic illness and immunization status is inconclusive. Norlin and Hoff14 revealed that pediatric patients with chronic
ill-nesses seen in a subspecialty clinic setting had similar immunization rates compared with the general pediatric population of Utah. When examining CSHCN enrolled in a pediatric group practice consortium, Samuels et al15
found that the rate of vaccination for the 4:3:1 series was
84%, which was slightly lower than the comparable state rate but similar to the national rate. Davis et al12
found that the vaccination coverage level for premature infants came close to the coverage level for the general population but was somewhat lower for very low birth weight infants when compared with the general popu-lation. Additional research examining vaccination cov-erage among children with chronic illness who used medical services in subspecialty clinics or hospitalized preschool-aged children found that a nontrivial propor-tion was underimmunized on presentapropor-tion to the clinic or admission to the hospital.8,9,19–21
Some unique characteristics of the CSHCN population may provide context for findings of underimmunization in this population. Children with severe chronic condi-tions may be more likely to see their subspecialists than primary care providers, and well-child care may be over-looked as the specialist attends to the child’s more urgent medical problem.16Children who see specialists in
addi-tion to a primary care provider can potentially receive vaccinations from multiple providers,8which may
con-tribute to record scattering.22Physicians may have
con-cerns regarding vaccination adverse effects if the child has a chronic condition that affects a particular system, such as the neurologic system.8The biological nature of
the condition and resulting sequelae, such as a sup-pressed immunologic system response, may preclude vaccination. For example, routine vaccination with vari-cella vaccine is not recommended for children with cel-lular immunodeficiencies such as congenital T-cell ab-normalities, leukemia, and lymphoma23; the use of a
measles-virus-containing vaccine is not recommended in severely immunocompromised children infected with HIV24; and use of a live vaccine is not recommended in
children with certain underlying metabolic disorders linked with a high level of immunodeficiency.25
METHODS
Data
We used data from the National Survey of Children with Special Health Care Needs, a module of the State and Local Area Integrated Telephone Survey (SLAITS). The NS-CSHCN was primarily sponsored by MCHB and was conducted by the CDC National Center for Health Sta-tistics from October 2000 through April 2002.7SLAITS
modules, such as the NS-CSHCN, use the sample frame of the NIS, a large, nationally representative, popula-tion-based telephone survey that monitors vaccination coverage of children in the United States. The NIS is coconducted by National Center for Health Statistics and the CDC National Center for Infectious and Respiratory Diseases. The NIS uses random-digit dialing to identify households with children 19 to 35 months of age.26,27
pro-vider-verified vaccination data are used to calculate of-ficial NIS vaccination estimates.
SLAITS modules are conducted after completion of the NIS interview. NIS-eligible households are those with any children ages 19 to 35 months, whereas NS-CSHCN-eligible households are those with any children under age 18 years. Therefore, for children in the NS-CSHCN who were also age eligible for the NIS, we were able to link the provider-verified vaccination data from the NIS with the corresponding NS-CSHSN data record for the child.
For the NS-CSHCN, 196 888 households with chil-dren were contacted, and all of the chilchil-dren under age 18 years in those households (a total of 373 066 chil-dren) were screened for special health care needs.7One
child with special health care needs was randomly se-lected from each household to be the target of the NS-CSHCN detailed interview.7 One child without special
health care needs was randomly selected from each household to be the target of a supplemental interview designed to provide a comparison group of children without special health care needs for analyses of health insurance and selected other topics.
The NS-CSHCN screener file contains data on the full set of children screened for special health care needs (all children in all households). NS-CSHCN data available for all of the children in the household include child’s age, gender, race, ethnicity, and special needs status, as well as household income relative to federal poverty level (FPL). Analyses of all of the children by special health care needs status and analyses by age, gender, race or ethnicity, or income relative to FPL were based on this file. The NS-CSHCN insurance file contains data on the 1 child with special health care needs and the 1 child without special health care needs randomly selected from each household. Analyses that involve the child’s health insurance, the mother’s education, or whether the mother resides in the household could only be ana-lyzed for children with and without special health care needs using the insurance file, which had a smaller sample than the screener file because it did not include
all of the children in every household. The screener file and insurance file were separately weighted so that each was representative of all of the children at the national level.
The NS-CSHCN completed detailed interviews for⬃750 CSHCN in each state and in Washington, DC. In certain states where the NIS sample frame was not large enough to achieve this interview target, extra sample (called “augmentation” sample) was drawn to make up the difference. These are households that participated in the NS-CSHCN but did not participate in the NIS. Be-cause we could not link vaccination data from the NIS to these cases, they were not included in our analyses. Of the 23 840 children ages 19 to 35 months in the NS-CSHCN screener file, NIS information was available for 21 444. Of these, 17 994 (83.9%) had provider-verified immunization data. Of the 14 182 children ages 19 to 35 months in the NS-CSHCN insurance file, NIS informa-tion was available for 13 065. Of these, 11 002 (84.2%) had provider-verified immunization data.
Statistical Analyses
The relationship between vaccination coverage and spe-cial needs status was analyzed for all of the children and by the following demographic characteristics: the age, race or Hispanic ethnicity, health insurance status, and gender of the child; mother’s education; maternal pres-ence in the household; and household poverty level relative to FPL.
Estimates of vaccination coverage rates and associated confidence intervals were calculated by using SUDAAN 9 (Research Triangle Institute, Research Triangle Park, NC), which accounts for the complex survey design us-ing the Taylor Series approximation method.28The
esti-mates were weighted, and the sampling weights were adjusted to account for noncoverage of nontelephone households.7 The statistical significance of differences
between rates for CSHCN and children without special needs was assessed at the .05 level by using 2-tailed t tests of the difference of proportions.
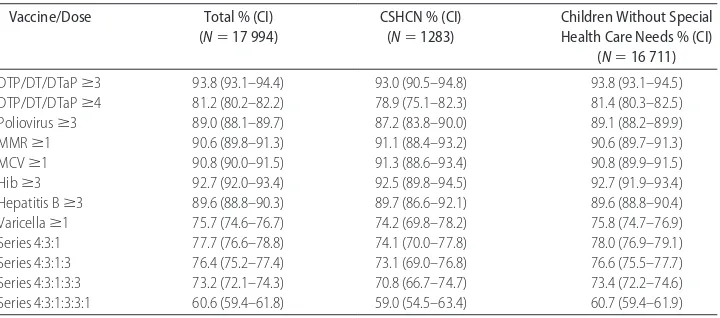
TABLE 1 Vaccination Coverage Rates Among Children 19 to 35 Months of Age by Selected Vaccines,
Doses, and Special Health Care Needs Status
Vaccine/Dose Total % (CI)
(N⫽17 994)
CSHCN % (CI) (N⫽1283)
Children Without Special Health Care Needs % (CI)
(N⫽16 711)
DTP/DT/DTaPⱖ3 93.8 (93.1–94.4) 93.0 (90.5–94.8) 93.8 (93.1–94.5)
DTP/DT/DTaPⱖ4 81.2 (80.2–82.2) 78.9 (75.1–82.3) 81.4 (80.3–82.5)
Poliovirusⱖ3 89.0 (88.1–89.7) 87.2 (83.8–90.0) 89.1 (88.2–89.9)
MMRⱖ1 90.6 (89.8–91.3) 91.1 (88.4–93.2) 90.6 (89.7–91.3)
MCVⱖ1 90.8 (90.0–91.5) 91.3 (88.6–93.4) 90.8 (89.9–91.5)
Hibⱖ3 92.7 (92.0–93.4) 92.5 (89.8–94.5) 92.7 (91.9–93.4)
Hepatitis Bⱖ3 89.6 (88.8–90.3) 89.7 (86.6–92.1) 89.6 (88.8–90.4)
Varicellaⱖ1 75.7 (74.6–76.7) 74.2 (69.8–78.2) 75.8 (74.7–76.9)
Series 4:3:1 77.7 (76.6–78.8) 74.1 (70.0–77.8) 78.0 (76.9–79.1)
Series 4:3:1:3 76.4 (75.2–77.4) 73.1 (69.0–76.8) 76.6 (75.5–77.7)
Series 4:3:1:3:3 73.2 (72.1–74.3) 70.8 (66.7–74.7) 73.4 (72.2–74.6)
Series 4:3:1:3:3:1 60.6 (59.4–61.8) 59.0 (54.5–63.4) 60.7 (59.4–61.9)
RESULTS
Table 1 shows the vaccination coverage rates for each of the individual vaccines and combined series for children with and without special health care needs, based on the analysis sample of 17 994 children with provider-veri-fied immunization data. For all of the vaccines and com-bined series, coverage levels of CSHCN are similar to coverage levels of children without special health care needs. There are no statistically significant differences between children with and without special needs for any of the individual vaccines or combined series in this aggregate comparison.
Table 2 shows the distribution of the demographic control variables for children with and without special health care needs. CSHCN were more likely than chil-dren without special health care needs to be male or non-Hispanic black or to have public insurance or a combination of private and public insurance and were less likely than children without special needs to be female, Hispanic, or privately insured or to live in house-holds with income 200% to 400% of the FPL (Table 2).
Virtually all (⬎96%) of the households included the mother in residence. This is a function of the way the variable was derived, in that it included biological, adop-tive, foster mothers, stepmothers, or female guardians, and these different types of mothers cannot be distin-guished. Because the number of CSHCN without any mother type in residence in the household was so small, this variable was not useful for subsequent analysis.
The percentage distributions of CSHCN and children without special health care needs by demographics for all of the children age eligible for the NIS were remark-ably similar to distributions based on the sample for whom provider-verified NIS data were available (Table 2). This shows that provider nonresponse to the NIS is not significantly related to these demographic character-istics of the child and household and indicates that our analytic samples are appropriately representative.
Table 3 summarizes significant differences in vaccina-tion coverage by special health care needs status within demographic subpopulations. Subpopulations that showed no significant differences by special needs status
TABLE 2 Distribution of Children With and Without Special Health Care Needs by Demographic Characteristics
Characteristic Unweighted Sample Size (Weighted %)
All Children Age-Eligible for NIS Children With Provider-Verified NIS Data
Total CSHCN Children Without
Special Needs
CSHCN Children Without
Special Needs
Total, screener file 21 444 (100.0) 1490 (100.0) 19 954 (100.0) 1283 (100.0) 16 711 (100.0)
Gender of child
Male (referent) 10 960 (51.2) 878 (59.8)a 10 082 (50.6)a 749 (59.2)a 8470 (50.7)a
Female 10 471 (48.8) 609 (40.2)a 9862 (49.4)a 534 (40.8)a 8233 (49.3)a
Age of child
19–23 mo 6241 (29.1) 400 (27.7) 5841 (29.2) 349 (29.0) 4950 (29.3)
24–35 mo (referent) 15 191 (70.9) 1087 (72.3) 14 104 (70.8) 931 (71.0) 11 754 (70.7)
Race/ethnicity
Hispanic 3658 (22.1) 168 (12.7)a 3490 (22.8)a 133 (11.8)a 2795 (21.8)a
Non-Hispanic white (referent)
13 839 (56.3) 977 (59.3) 12 862 (56.1) 874 (61.4) 11 069 (58.5)
Non-Hispanic black 2097 (13.4) 207 (20.4)a 1890 (12.8)a 167 (19.7)a 1448 (11.6)a
Non-Hispanic other 1769 (8.2) 134 (7.5) 1635 (8.3) 106 (7.2) 1345 (8.1)
Income relative to FPL
0% to⬍50% FPL 1374 (7.2) 120 (7.7) 1254 (7.2) 104 (7.6) 991 (6.7)
50% to⬍100% FPL 2246 (12.1) 170 (14.4) 2076 (11.9) 150 (14.8) 1704 (11.4)
100% to⬍200% FPL 4891 (23.2) 377 (25.5) 4514 (23.0) 329 (25.8) 3823 (23.2)
200% to⬍400% FPL 6402 (31.7) 389 (25.7)a 6013 (32.1)a 333 (26.3)a 5139 (32.4)a
ⱖ400% FPL (referent) 4212 (25.9) 280 (26.8) 3932 (25.8) 246 (25.5) 3359 (26.3)
Total, insurance file 13 065 (100.0) 1202 (100.0) 11 863 (100.0) 1039 (100.0) 9963 (100.0)
Health insurance
Private only (referent) 8408 (62.5) 627 (49.1)a 7781 (63.4)a 545 (50.2)a 6552 (64.6)a
Public only 2940 (24.0) 374 (33.4)a 2566 (23.3)a 331 (33.7)a 2188 (23.0)a
Private and public 694 (5.3) 143 (11.4)a 551 (4.8)a 116 (10.1)a 450 (4.5)a
Uninsured 972 (8.3) 55 (6.1) 917 (8.5) 44 (6.0) 732 (7.8)
Mother’s education
Less than high school 1212 (18.4) 106 (17.8) 1106 (18.5) 91 (16.9) 881 (17.2)
High school/GED 3757 (33.9) 351 (37.2) 3406 (33.6) 301 (35.8) 2839 (33.1)
Some college 2315 (20.7) 236 (19.3) 2079 (20.8) 206 (20.7) 1777 (21.6)
ⱖ4 y of college (referent) 5063 (27.0) 452 (25.8) 4611 (27.1) 394 (26.6) 3949 (28.2)
Mother’s residence
Not in household 258 (3.3) 24 (3.8) 234 (3.3) 17 (2.7) 180 (3.0)
In household (referent) 12 534 (96.7) 1151 (96.2) 11 383 (96.7) 1000 (97.4) 9585 (97.0)
for any vaccination or series are omitted (12 of 23 sub-populations) as are vaccinations or series that showed no significant differences by special needs status for any demographic subgroup (2 of 8 vaccinations and 1 of 4 series). Although most comparisons showed no differ-ences across special needs status, Table 3 shows that CSHCN are less likely to be immunized for DTP/DT/DTaP or the 4:3:1 series if they are non-Hispanic white chil-dren and less likely to be immunized for combined series 4:3:1, 4:3:1:3, and 4:3:1:3:3 if they live in high-income households. However, CSHCN are more likely to be up to date on some vaccines or series if they are Hispanic (measles, mumps, and rubella vaccine [MMR]), poor (MMR and hepatitis B, 4:3:1:3:3), publicly insured ( Hae-mophilus influenzae type b [Hib] or hepatitis B), or live with a mother whose educational attainment is less than a high school degree (poliovirus, Hib, or hepatitis B, 4:3:1:3:3). The full tables that show the vaccination cov-erage rates for each vaccine and combined series for children with and without special health care needs in all of the demographic subpopulations, as well as the associated confidence intervals and tests of statistical significance, are available in the online supplemental materials, which are published as Tables 4 to 15 on www.pediatrics.org/content/full/122/4/e768.
DISCUSSION
Most comparisons showed no differences in immuniza-tion status by special health care needs. Of the differ-ences that were statistically significant, most suggest that
CSHCN had higher coverage rates than children without special needs; the only cases where children with special needs had lower coverage rates were for DT/DTP/DTaP ⱖ4 doses and 4:3:1 among non-Hispanic white children and for combined the series 4:3:1, 4:3:1:3, and 4:3:1:3:3 among children who lived in households in the highest income category. It is possible the lower coverage rates may have reflected (in part) parent or provider concerns about vaccinating CSHCN; however, variables to mea-sure these constructs were not included in either survey. In contrast, past research has demonstrated that CSHCN are more likely to have a personal doctor or nurse, get care in a medical home, see their doctors more often, and more often see specialists or other doctors than children without special health care needs (results avail-able on request from the authors or see the data query platform at http://childhealthdata.org). It is possible that CSHCN in certain subgroups are more likely to be im-munized because of these factors. However, the overall differences between CSHCN and children without spe-cial needs were not significant; it, therefore, seems un-likely that the higher vaccination coverage levels of CSHCN in certain subgroups are the result of factors that may affect all CSHCN.
The findings in Table 3 suggest that CSHCN are at risk of underimmunization only if they live in advantaged households (white or high income) but are more likely to be immunized if they live in disadvantaged or minor-ity households (Hispanic, poor, publicly insured, or with poorly educated mothers). Our results have a similar
TABLE 3 Summary of Significant Differences in Vaccination Coverage by Special Health Care Needs
Status Within Demographic Subpopulations
Demographic Subpopulationa
Vaccination and Dose Vaccination Series
DT/DTP/DTaPⱖ4 Poliovirus ⱖ3
MMR or MCV ⱖ1
Hibⱖ3 Hepatitis B ⱖ3
4:3:1 4:3:1:3 4:3:1:3:3
Gender
Male 0 0 ⫹ 0 0 0 0 0
Female 0 0 0 0 0 ⫺ 0 0
Age
19–23 mo 0 0 0 0 0 ⫺ 0 0
Race/ethnicity
Hispanic 0 0 ⫹ 0 0 0 0 0
Non-Hispanic white ⫺ 0 0 0 0 ⫺ 0 0
Income relative to FPL
0% to⬍50% FPL 0 0 0 0 ⫹ 0 0 ⫹
50% to⬍100% FPL 0 0 ⫹ 0 0 0 0 0
ⱖ400% FPL 0 0 0 0 0 ⫺ ⫺ ⫺
Insurance type
Private 0 0 ⫹ 0 0 0 0 0
Public 0 0 0 ⫹ ⫹ 0 0 0
Mother’s education
Less than high school 0 ⫹ 0 ⫹ ⫹ 0 0 ⫹
DT/DTP/DTaPⱖ3 doses, varicella, and series 4:3:1:3:3:1 were omitted because they showed no significant differences by special needs status within any demographic subpopulation examined.⫹indicates that CSHCN had significantly higher vaccination coverage at the .05 level than children without special health care needs;⫺, CSHCN had significantly lower vaccination coverage at the .05 level than children without special health care needs; 0, no significant difference. Data sources were the NS-CSHCN and the NIS, 2000 –2002.
trend to those of Kim et al,29who examined up-to-date
coverage for the 4:3:1:3 series in all children, although the antigen-specific findings did not match across the 2 studies. They found a higher vaccination rate among young children living in Hispanic and non-Hispanic black families with low income-to-poverty ratios, in families with Hispanic mothers, and in families with mothers with less than a high school education. For the current study, the only significant results in Table 3 that did not follow the pattern were the higher MMR or measles-containing vaccine (MCV) vaccination coverage rates for CSHCN among male children and privately insured children and the lower 4:3:1 series coverage rates for CSHCN among female children and children 19 to 23 months of age. This general pattern could be in-terpreted as a success story for disadvantaged popula-tions in that outreach efforts or supports may be working for those who need them most. For instance, selected factors identified in past research as being associated with lower vaccination rates among all children include low maternal education,30–34being black,30,34and living in
poverty.30,34–36However, it is important to note that, in
the current study, the majority of cells in Table 3 show no significant differences between CSHCN and children without special health care needs.
LIMITATIONS
The data for both the NIS and the NS-CSHCN were reported by the person most knowledgeable about the health of the child (usually a parent or guardian); how-ever, parent-reported immunization data have been found to be inaccurate in some cases.37–39Thus,
supple-mental provider data from the immunization and med-ical chart were used to verify parent-reported immuni-zation data. However, it is possible that provider records or data transcribed onto the NIS form when submitting provider data could be inaccurate,40 especially among
CSHCN who are more likely to see multiple doctors and may have a higher probability of record-keeping errors or record scattering. Errors could be administrative in nature (transcription or data entry error or poor hand-writing) or technical (difficulty maintaining current knowledge on the dynamic and complex vaccination schedule for young children).40
The range of chronic conditions captured by the MCHB definition of CSHCN is broad by definition. How-ever, the NS-CSHCN did not collect condition-specific data, so vaccination coverage cannot be studied by con-dition. It is possible that different results may have been obtained if we stratified CSHCN by severity of special health care need(s). We will examine this in future research.
These surveys are cross-sectional, and the data cannot be used to prove causal relationships. As sample surveys, the NIS and the NS-CSHCN are subject to various forms of nonrandom error, including coverage bias and non-response bias.
CONCLUSIONS
There were no statistically significant differences be-tween children with and without special needs for any of
the individual antigens or combined series in the aggre-gate comparison. Most antigens and combined series did not show a difference by special health care needs within demographic subpopulations. The majority of the few antigens or series that did show a difference by special needs status within a particular demographic subgroup seemed to follow a pattern of underimmunization for CSHCN in affluent or white households and higher cov-erage levels for CSHCN in Hispanic, poor, or publicly insured households or for CSHCN whose mothers did not complete high school. This may be related to suc-cessful communication outreach or support efforts that target disadvantaged children, but additional research is needed.
Additional vaccination coverage research is of critical importance for CSHCN of all ages. These results can be used to inform policy-makers and enhance appropriate decision-making related to immunization programs for young CSHCN.
ACKNOWLEDGMENTS
The National Immunization Survey is funded by the National Center for Infectious and Respiratory Diseases (formerly known as the National Immunization Pro-gram), Centers for Disease Control and Prevention. The National Survey of Children With Special Health Care Needs is funded by the Maternal and Child Health Bu-reau of the Health Resources and Services Administra-tion.
We thank the thousands of families across the coun-try who graciously gave their time and effort to complete the surveys, as well as the project staff who worked on these surveys or interviewed respondents. We also thank Marcie Cynamon, Stephen Blumberg, Jane Gen-tleman, Jennifer Madans, and James Singleton for their insightful comments, as well as the anonymous review-ers.
REFERENCES
1. US Department of Health and Human Services.Healthy People 2010. 2nd ed, 2 vols. Washington, DC: US Government Printing Office; 2000
2. Advisory Committee on Immunization Practices. The Advisory Committee on Immunization Practices Page. Available at: www.cdc.gov/nip/ACIP/default.htm. Accessed September 21, 2006
3. Centers for Disease Control and Prevention. National, state, and urban area vaccination levels among children aged 19 –35 months: United States, 2002. MMWR Morb Mortal Wkly Rep.
2003;52(31):728 –732
4. American Academy of Pediatrics, Medical Homes Initiatives for Children with Special Needs Project Advisory Committee. The medical home.Pediatrics.2002;110(1 pt 1):184 –186
5. McPherson M, Arango P, Fox H, et al. A new definition of children with special health care needs.Pediatrics.1998;102(1 pt 1):137–140
6. Bethell CD, Read D, Stein RE, Blumberg SJ, Wells N, Newa-check PW. Identifying children with special health care needs: development and evaluation of a short screening tool.Ambul Pediatr.2002;2(1):38 – 48
8. Raddish M, Goldmann DA, Kaplan LC, Perrin JM. The immu-nization status of children with Spina Bifida.Am J Dis Child.
1993;147(8):849 – 853
9. Basco WT Jr, Recknor JC, Darden PM. Who needs an immu-nization in a pediatric subspecialty clinic?Arch Pediatr Adolesc Med.1996;150(5):508 –511
10. Uzark K, Collins J, Meisenhelder K, Dick M, Rosenthal A. Primary preventive health care in children with heart disease.
Pediatr Cardiol.1983;4(4):259 –264
11. Langkamp DL, Hoshaw-Woodard S, Boye ME, Lemeshow S. Delays in receipt of immunizations in low-birth-weight children: a nationally representative sample.Arch Pediatr Ado-lesc Med.2001;155(2):167–172
12. Davis RL, Rubanowice D, Shinefield HR, et al. Immunization levels among premature and low-birth-weight infants and risk factors for delayed up-to-date immunization status. JAMA.
1999;282(6):547–553
13. Fraser, JJ. Immunization status of chronically ill children.Tex Med.1990;86(10):76 –79
14. Norlin C, Hoff CJ. Immunization in children with chronic illness. Presented at the Pediatric Academic Societies Meeting; May 3– 6, 2003; Seattle, WA
15. Samuels RC, Liu J, Permut IQ, Sofis LA, Palfrey JS. Immuni-zation rates in children with special health care needs [ab-stract].Pediatr Res.2003;53(4, Part 2 Suppl S):1442.
16. Tifft CJ, Lederman HM. Immunization status of hospitalized preschool-age children.Am J Dis Child.1988;142(7):719 –720 17. Ginsburg C, Andrews W. Orthotopic hepatic transplantation
for unimmunized children: a paradox of contemporary medical care.Pediatr Infect Dis J.1987;6(8):764 –765
18. Vohr BR, Oh W. Age of diphtheria, tetanus, and pertussis immunization of special care nursery graduates. Pediatrics.
1986;77(4):569 –571
19. Kum-Nji P, James D, Herrod HG. Immunization status of hos-pitalized preschool children: risk factor associated with inade-quate immunization.Pediatrics.1995;96(3 pt 1):434 – 438 20. Bell LM, Pritchard M, Anderko R, Levenson R. A program to
immunize hospitalized preschool-aged children: evaluation and impact.Pediatrics.1997;100(2 pt 1):192–196
21. Conway SP. Opportunistic immunization in hospital.Arch Dis Child.1999;81(5):422– 425
22. Stokley S, Rodewald LE, Maes EF. The impact of record scat-tering on the measurement of immunization coverage. Pediat-rics.2001;107(1):91–96
23. American Academy of Pediatrics, Committee on Infectious Dis-eases. Varicella vaccine update. Pediatrics.2000;105(1 pt 1): 136 –141
24. American Academy of Pediatrics. Section 3: summary of infec-tious diseases: human immunodeficiency virus infection. In: Pickering LK, Baker CJ, Long SS, McMillian JA, eds.Red Book: 2006 Report of the Committee on Infectious Diseases. 27th ed. Elk Grove Village, IL: American Academy of Pediatrics; 2006: 378 – 401
25. Kingsley JD, Varman M, Chatterjee A, Kingsley RA, Roth KS. Immunizations for patients with metabolic disorders.Pediatrics.
2006;118(2). Available at: www.pediatrics.org/cgi/content/ full/118/2/e460
26. Zell ER, Ezzatti-Rice TM, Battaglia MP, Wright RA. National Immunization Survey: the methodology of a vaccination sur-veillance system.Public Health Rep.2000;115(1):65–77 27. Smith PJ, Battaglia MP, Huggins VJ, et al. Overview of the
sampling design and statistical methods used in the National Immunization Survey.Am J Prev Med.2001;20(4 suppl):17–24 28. Research Triangle Institute.SUDAAN Language Manual, Release 9.0. Research Triangle Park, NC: Research Triangle Institute; 2004
29. Kim SS, Frimpong JA, Rivers PA, Kronenfeld JJ. Effects of maternal and provider characteristics on up-to-date immuni-zation status of children aged 19 to 35 months.Am J Public Health.2007;97(2):259 –266
30. Luman ET, McCauley MM, Shefer A, Chu SY. Maternal char-acteristics associated with vaccination of young children. Pedi-atrics.2003;111(5 part 2):1215–1218
31. Miller LA, Hoffman RE, Baro´n AE, Marine WM, Melinkovich P. Risk factors for delayed immunization against measles, mumps, and rubella in Colorado two-year-olds. Pediatrics.
1994;94(2 pt 1):213–219
32. Bobo JK, Gale JL, Thapa PB, Wassilak SG. Risk factors for delayed immunization in a random sample of 1163 children from Oregon and Washington.Pediatrics.1993;91(2):308 –314 33. Santoli JM, Huet NJ, Smith PJ, et al. Insurance status and vaccination coverage among U.S. preschool children.Pediatrics.
2004;113(6 suppl):1959 –1964
34. Smith PJ, Chu SY, Barker LE. Children who have received no vaccines: who are they and where do they live? Pediatrics.
2004;114(1):187–195
35. Bates AS, Wolinsky FD. Personal, financial, and structural barriers to immunization in socioeconomically disadvantaged urban children.Pediatrics.1998;101(4 pt 1):591–596
36. Klevens RM, Luman ET. U.S. children living in and near poverty: risk of vaccine-preventable diseases.Am J Prev Med.
2001;20(4 suppl):41– 46
37. McKinney PA, Alexander FE, Nicholson C, Cartwright RA, Carrette J. Mothers’ reports of childhood vaccinations and infections and their concordance with general practitioner records.J Public Health Med.1991;13(1):13–22
38. Zell E, Peak R, Rodewald L, Ezzati-Rice T. Reliability of vaccina-tion cards and parent-derived informavaccina-tion for determining im-munization status: lessons from the 1994 National Health Inter-view Survey (NHIS) Provider Record Check (PRC) Study. Poster presented at the American Pediatric Society and the Society for Pediatric Research Meeting; May 2– 6, 1997; Washington, DC 39. Willis G, Brittingham A, Lee, L, Tourangeau R, Ching P.
Re-sponse errors in surveys of children’s immunizations. National Center for Health Statistics.Vital Health Stat.1999;6(8):1–56. 40. Khare M, Battaglia MP, Huggins VJ, Stokley S, Hoaglin DC,
DOI: 10.1542/peds.2007-0305
2008;121;e768
Pediatrics
Kathleen S. O'Connor and Matthew D. Bramlett
Vaccination Coverage by Special Health Care Needs Status in Young Children
Services
Updated Information &
http://pediatrics.aappublications.org/content/121/4/e768
including high resolution figures, can be found at:
References
http://pediatrics.aappublications.org/content/121/4/e768#BIBL
This article cites 32 articles, 12 of which you can access for free at:
Subspecialty Collections
_sub
http://www.aappublications.org/cgi/collection/vaccine:immunization
Vaccine/Immunization
b
http://www.aappublications.org/cgi/collection/infectious_diseases_su
Infectious Disease
_management_sub
http://www.aappublications.org/cgi/collection/administration:practice
Administration/Practice Management
following collection(s):
This article, along with others on similar topics, appears in the
Permissions & Licensing
http://www.aappublications.org/site/misc/Permissions.xhtml
in its entirety can be found online at:
Information about reproducing this article in parts (figures, tables) or
Reprints
http://www.aappublications.org/site/misc/reprints.xhtml
DOI: 10.1542/peds.2007-0305
2008;121;e768
Pediatrics
Kathleen S. O'Connor and Matthew D. Bramlett
Vaccination Coverage by Special Health Care Needs Status in Young Children
http://pediatrics.aappublications.org/content/121/4/e768
located on the World Wide Web at:
The online version of this article, along with updated information and services, is
by the American Academy of Pediatrics. All rights reserved. Print ISSN: 1073-0397.