Faculty Publications
6-11-2018
Lateral Marsh Edge Erosion as a Source of
Sediments for Vertical Marsh Accretion
Charles S. Hopkinson
University of Georgia
James T. Morris
University of South Carolina
Sergio Fagherazzi
Boston University
Wilfred M. Wollheim
University of New Hampshire, Durham
, wil.wollheim@unh.edu
Peter A. Raymond
Yale University
Follow this and additional works at:
https://scholars.unh.edu/faculty_pubs
This Article is brought to you for free and open access by University of New Hampshire Scholars' Repository. It has been accepted for inclusion in Faculty Publications by an authorized administrator of University of New Hampshire Scholars' Repository. For more information, please contact
nicole.hentz@unh.edu.
Recommended Citation
Lateral Marsh Edge Erosion as a Source of Sediments
for Vertical Marsh Accretion
Charles S. Hopkinson1 , James T. Morris2 , Sergio Fagherazzi3 , Wilfred M. Wollheim4 , and Peter A. Raymond5
1
Department of Marine Sciences, University of Georgia, Athens, GA, USA,2Belle Baruch Institute for Marine and Coastal Studies, University of South Carolina, Columbia, SC, USA,3Department of Earth and Environment, Boston University, Boston, MA, USA,4Department of Natural Resources and the Environment, University of New Hampshire, Durham, NH, USA,5School of Forestry and Environmental Studies, Yale University, New Haven, CT, USA
Abstract
With sea level rise accelerating and sediment inputs to the coast declining worldwide, there is concern that tidal wetlands will drown. To better understand this concern, sources of sedimentcontributing to marsh elevation gain were computed for Plum Island Sound estuary, MA, USA. We quantified input of sediment from rivers and erosion of marsh edges. Maintaining elevation relative to the recent sea level rise rate of 2.8 mm yr1requires input of 32,299 MT yr1of sediment. The input from watersheds is only 3,210 MT yr1. Marsh edge erosion, based on a comparison of 2005 and 2011 LiDAR data, provides 10,032 MT yr1. This level of erosion is met by<0.1% of total marsh area eroded annually. Mass balance suggests that 19,070 MT yr1should be of tidalflat or oceanic origin. The estuarine distribution of14C and13C isotopes of suspended particulate organic carbon confirms the resuspension of ancient marsh peat from marsh edge erosion, and the vertical distribution of14C-humin material in marsh sediment is indicative of the deposition of ancient organic carbon on the marsh platform. High resuspension rates in the estuarine water column are sufficient to meet marsh accretionary needs. Marsh edge erosion provides an important fraction of the material needed for marsh accretion. Because of limited sediment supply and sea level rise, the marsh platform maintains elevation at the expense of total marsh area.
Plain Language Summary
Tidal marshes in the Plum Island Sound estuary have been gaining elevation over the past 100 years at about the same rate as sea level rise (SLR), but there is concern that they will drown and disappear if rates of SLR increase substantially due to CO2emissions and climate change.What are the sediment sources enabling elevation gain? Rivers were not the primary source, providing less than 10% of elevation gain needs. Marsh edge erosion is much more important—providing over 30% of needs. We estimate that the remainder comes from the ocean or erosion of tidalflats. If the ocean is a major source, these marshes might be able to maintain elevation throughout the 21st century even if SLR greatly accelerates. However, if erosion of tidalflats is the primary source of sediments, the future outlook is less favorable because the more tidalflat erosion increases, the more edge erosion will also increase. The net result will be a loss of marsh area in this system. The dynamics we found for Plum Island Sound are likely to be occurring globally, as declining sediment inputs from rivers, and increasing rates of SLR due to climate change are worldwide phenomenon. Loss of marshes will have a major impact on the resilience of coastal communities landward of the marshes and the productivity of most coastalfisheries.
1. Introduction
The tidal wetlands we know today are for the most part the product of geomorphic processes that played out over the past 2,000 to 4,000 years. Formation of tidal wetlands as we know them today was largely tied to the stabilization of shorelines and barrier islands with the onset of the late Holocene deceleration of sea level rise (SLR, eustatic SLR, not including vertical land movements, such as subsidence, which can be regionally impor-tant in determining the relative SLR; see Rovere et al., 2016) to rates as low as 0.5 mm yr1(Donnelly, 2006; Engelhart & Horton, 2012; Hein et al., 2012; Redfield, 1967a). At extremely low rates of SLR, bay infilling with sediment enabled tidal wetlands to prograde into open water areas, to build vertically through accretion, and to transgress uplands (Fagherazzi et al., 2012; Redfield, 1967b, 1972). In the United States, increased soil ero-sion from land clearing for agriculture following European colonization led to increased sedimentflux from watersheds, contributing to further tidal wetland expansion (Kirwan et al., 2011; Mattheus et al., 2009; Pasternack et al., 2001; Pavich et al., 1985; Trimble, 1977). Tidal wetland expansion following deforestation
RESEARCH ARTICLE
10.1029/2017JG004358
Key Points:
• Sediment input from rivers (3,210 MT yr1) and marsh edge erosion (10,032 MT yr1) provides only 39% of the sediment required for marshes to maintain elevation relative to SLR
• The marsh platform has been able to maintain its relative elevation at the expense of total marsh area
• Sediment inputs from the ocean or from erosion of tidalflats are likely an important factor in the mineral sediment budget of the system and together must contribute
19,070 MT yr1in order for the marsh to accrete at its current rate of 2.8 mm yr1
Correspondence to:
C. S. Hopkinson, chopkins@uga.edu
Citation:
Hopkinson, C. S., Morris, J. T., Fagherazzi, S., Wollheim, W. M., & Raymond, P. A. (2018). Lateral marsh edge erosion as a source of sediments for vertical marsh accretion.Journal of Geophysical Research: Biogeosciences, 123, 2444–2465. https://doi.org/ 10.1029/2017JG004358
Received 7 DEC 2017 Accepted 29 MAY 2018
Accepted article online 11 JUN 2018 Published online 21 AUG 2018
has been documented worldwide for marshes and mangroves (Swales & Bentley, 2008). There are limited accounts of present-day tidal wetland expansion, however, and they seem to be limited to locations with continued high riverine sediment loads, such as the Mekong and Yangtze deltas, and where there has been a major human action taken, such as in the Mississippi River delta following Atchafalaya River capture of a major portion of the Mississippi River (Blum & Roberts, 2012).
There is increasing concern for the survival of tidal wetlands because of the acceleration of SLR and the decrease in sediment delivery to the coast (Weston, 2013). Rates of SLR have increased over the past 150 years (Donnelly et al., 2004; Rahmstorf et al., 2012) to rates that are now about 3.2 mm yr1globally. Sea level is projected to further increase by 2100 at rates not seen since the maximum meltwater pulse about 9,000 years ago as a result of climate change brought about by anthropogenic CO2emissions—up to 2 m by 2100 (Donnelly et al., 2004;
Sweet et al., 2017; Walsh et al., 2014). Improved land management (e.g., contour plowing), agricultural abandon-ment and reforestation, and river damming have reduced sediabandon-ment delivery worldwide substantially (Milliman & Syvitski, 1992; Syvitski et al., 2005). In North America it has been estimated that sediment delivery to the coast decreased about 50% in the 20th century (Meade & Trimble, 1974; Warrick et al., 2013; Weston, 2013). Reductions in sediment availability and delivery and rising sea level has been linked to tidal wetland loss globally (Reed, 1995), with examples in the Mississippi River delta (Blum & Roberts, 2009; Day et al., 2011), Choptank River and Blackwater Creek marshes in the Chesapeake Bay (Ganju et al., 2015), and Venice Lagoon (Day et al., 1998).
Tidal wetlands provide critical ecosystem services to mankind, including protection from coastal storms and carbon dioxide sequestration (Barbier et al., 2011; Costanza et al., 1997). We already see management activities taking shape to reduce erosion of marsh shorelines through the installation of armored shorelines and living shorelines (Gittman et al., 2015). Yet we do not know the impact and long-term effects of shoreline erosion reductions on estuarine sediment budgets and the sediment supply required for tidal wetlands to maintain elevation relative to SLR.
There are two aspects of tidal wetland survival that are impacted by reductions in sediment availability and SLR (incorporating rise in sea surface height and changes in land elevation, such as subsidence)—vertical ele-vation gain and maintenance of areal extent. Relative SLR can be even greater when augmented by land sub-sidence, thereby making tidal wetland survival even more precarious. It is generally accepted that there is a positive relationship between maintaining elevation relative to increasing rates of SLR and the availability of suspended sediment (Day et al., 2011; Fagherazzi et al., 2012; Kirwan et al., 2010; Mudd, 2011). There are strong stabilizing feedbacks between the depth of tidal inundation, marsh biomass, and sediment trapping efficiency (Morris, 2016; Morris et al., 2002) such that as long as inundation depth does not exceed a critical threshold, marshes will respond to increasing sea level by increasing their productivity and aboveground bio-mass, which leads to enhanced sediment trapping efficiency, increased sedimentation on the marsh surface, and increased gain in marsh elevation. Mariotti and Fagherazzi (2013) and Fagherazzi et al. (2013) have pro-posed that the stability of the marsh boundary (and hence marsh area) is also strongly linked to sediment availability and the rate of SLR. Marsh boundaries are inherently unstable, and even in the absence of SLR, marsh boundaries will retreat when sediment erosion is higher than the input of sediment to the system. Only a complete sediment budget can evaluate both vertical gain and maintenance of areal extent that determine the fate of intertidal wetlands in an estuarine system (Fagherazzi et al., 2013; Marcus & Kearney, 1991), yet few sediment budgets focused on wetland stability exist (French et al., 2008; Ganju et al., 2017).
Here we develop a sediment budget of marsh elevation gain for the Plum Island Sound salt marshes in order to assess the long-term survival of the extensive tidal marshes currently present. In this system we have evi-dence that marshes are maintaining elevation relative to SLR, but we alsofind substantial rates of erosion along the marsh boundaries of Plum Island Sound and therefore declining areal extent of marshes. Our research questions are as follows: How widespread is edge erosion, and what is its significance relative to riv-erine sediment sources in contributing to marsh elevation gain? If these two sources do not provide sufficient sediment to sustain marsh elevation gain, what are the other likely sources?
2. Materials and Methods
2.1. Description of the Area
600 km2in size and experiencing significant suburbanization. Agriculture has been declining since its peak in the mid-1800s (Claessens et al., 2006). Precipitation is uniform throughout the year, but runoff is highly seasonal ranging from about 110 to 8 mm mo1in March and September. The watershed is of very low relief and punctuated with wetlands (21%) and the river has hundreds of dams, natural (beaver ponds), and man-made (Claessens et al., 2006). These wetlands and dams influence streamflow dynamics and particulate matter entering the estuary.
The Plum Island Sound estuary is a typical but large marsh-dominated estuary in New England. The estuary is about 60 km2in size with tidal wetlands making up about 40 km2of the total area. The main axis of the estuary is about 24 km long, with the Parker River entering at the head and the Ipswich River debouching near the mouth. It is a macro-tidal system in the cold water Acadian biogeographic province. The estuary stabilized into its current barrier island/inlet configuration about 2,500 to 3,500 years ago, once the rate of SLR had decreased to about 1 mm yr1(Hein et al., 2012). From about 1,000 years ago until the 19th century, the SLR rate was about 0.5 mm yr1(Donnelly, 2006; Hein et al., 2012). The average rate of SLR increased to about 2.8 mm yr1in the 20th century. Mean tidal range is 2.5 m. Tidalfluxes dominate over riverflow (Hein et al., 2012; Vallino & Hopkinson, 1998), and the estuary is ebb-tide dominated with an ebb tidal delta.
Plum Island Sound estuary wetlands are distributed between mean sea level and 2 m (Millette et al., 2010; Morris, Sundberg, et al., 2013). There is a gradient in tidal wetlands along the estuary ranging from oligohaline marshes dominated byTyphaspp. andSpartina patensin the upper 5 km of the Parker river, to brackish and saline marshes further downstream that are dominated byS. patensandSpartina alterniflora. Thefinal 10 km of the estuary consists of a 1-km wide broad sound that narrows only near the mouth. The ratio of marsh area to estuarine water area varies along the length of the estuary from>10:1 to about 1:1 adjacent to Plum Island Sound. As is typical for the New England region, the tidal marshes can be characterized as having high and low marsh platforms dis-sected by numerous tidal channels and mosquito-control ditches. The high marsh platform (75% of the marsh area; elevation about 1.4 m above NAVD88 (~1.38 m above mean sea level) is dominated by S. patensin areas showing a gradient in elevation and short formS. alternifloraon nearlyflat pannes that exhi-bit poor drainage (Millette et al., 2010). Ponds are numerous within many pannes (Wilson et al., 2014). The low marsh platform dominated by tall formS. alternifloracomprises only about 10% of the marsh. The transition elevation to the high marsh platform is at about 1.0 m. MHW and MHHW elevations are at about 1.1 and 1.28 m (Millette et al., 2010).
2.2. General Approach
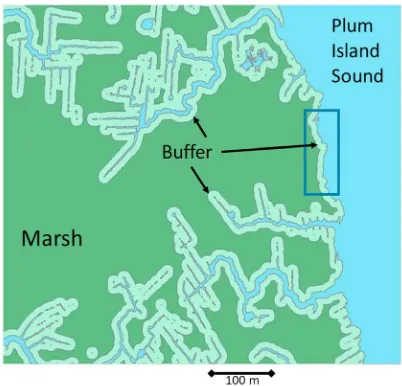
We use a mass balance approach to determine the relative importance of various sediment sources that enable the marsh platform to maintain elevation relative to SLR (Figure 2). The estuary is divided into three zones of roughly equivalent length along the Parker River and one for Plum Island Sound (Figure 1). Each zone has three components: (1) the water column, which connects all elements within the system including external inputs; (2) subtidal and intertidal sediments, which we simply label tidalflats; and (3) the marsh. There are four poten-tial sources of sediment, two internal and two external. The internal sources include edge erosion of the marsh shoreline and erosion of creek and bay bottoms and intertidalflats. The external sources include rivers and the ocean. The only component for which we quantify sediment standing stock is the sediment suspended in the water column, and we assume that this stock is roughly at equilibrium over annual periods and longer.
The overall equation describing the sediment mass balance is
Marsh Sediment Accretion¼RiverþEdge ErosionþðNet Ocean ExchangeþNet Tidal Flat ErosionÞ; (1)
where marsh accretion is seen as a sink of sediment, and rivers, edge erosion, and the ocean or tidalflats are seen as potential sources. Marsh sediment accretion, river, and edge erosion are quantified in a manner
Figure 1.Plum Island Sound estuary highlighting the four zones along the
24-km axis where a sediment balance was constructed. The most significant
river inputs to the system are identified. The colors correspond to elevation and
land cover: white, uplands or barrier island>2-m NAVD88; green, intertidal
marshes dominated bySpartina patensbetween 0.8 and 2-m NAVD88; yellow,
intertidal wetlands dominated bySpartina alterniflorabetween 0 and 0.8-m
NAVD88; blue, open water and intertidalflats<0 NAVD88. The ocean adjacent to
the estuary is the Gulf of Maine. The coordinates at the mouth of the estuary
described below. The net ocean exchange and tidalflat erosion is the unknown for which we solve. We assign the shortfall to either the ocean or tidalflats, as we are unable with this single equation to solve for more than one unknown at a time. All sediment stocks orfluxes are reported in units of metric tonnes of sediment per year (MT yr1). Our budget is calculated for a mean annual interval. While we budget gains and losses of marsh sediment due to surface accretion and edge erosion, we do not track total marsh stocks. Nor do we track sediment stores associated with tidal creek bottoms and intertidalflats, even though these are the proximal source and sink of sediment resuspended by tidal currents. We apply this approach separately for both mineral and organic sediments, fully cognizant of, but ignoring, the potential importance of undecomposed roots and rhizome accumulation in contributing to marsh elevation gain, but not to surface accretion.
2.3. LiDAR Data
The Plum Island Ecosystems–Long-term ecological research (PIE-LTER) study area wasflown by the National Center for Airborne Laser Mapping with LiDAR on two occasions at times of minimal vegetation height (after winter icing, plant scouring and vegetation compression, and prior to spring growth), in spring of 2005 and 2011 and within 90 min of predicted low tide. Details on LiDAR orthorectification are described by Millette et al. (2010). The data from bothflights were projected on the horizontal datum of UTM NAD83 (2007), UTM zone 19, and a vertical datum of NAVD88 computed from the GEOID09. Thefinal products were con-verted to 1.0 × 1.0 m raster digital elevation models (DEMs) in grid format.
2.4. Marsh Sediment Accretion
Volumes, areas, standing stocks, andfluxes of materials used to calculate a sediment budget for the Plum Island Sound estuary wetlands were obtained from previous reports as well as new measures in this study. The marshes along the estuary are distributed between mean sea level and 2 m (Millette et al., 2010; Morris, Sundberg, et al., 2013). ArcMap 10.2.2 was used to calculate the surface area of marsh in each section using the surface volume tool querying the 2005 DEM as to area between 0 and 2 m in elevation. We used previous studies of Plum Island Sound estuarine hydrodynamics and metabolism for estimates of water volumes along the length of the estuary (see Vallino & Hopkinson, 1998; Vallino et al., 2005).
The mass of sediment required to maintain marsh elevation relative to SLR was assessed in two ways. First, we simply multiplied the annual increase in sea level × sediment bulk density × surface area of marsh in each box. Wilson et al. (2014) analyzed marker horizon and surface elevation table (SET) data maintained by the
Figure 2.Box model used to examine sediment budget of the Plum Island Sound, marsh-dominated estuary. The estuary is
divided into four sections, each with open water (estuarine tidal creeks and bays), intertidalflats, creek bottoms, and
adjacent intertidal marsh. Sediment enters the system via rivers (River-1 refers to the Parker River and other ungauged stream inputs to the upper 5 km of the estuary. R-2 refers to the Mill and Little Rivers that are also ungauged and that enter in the lower estuary. R-3 refers to the Ipswich River and other ungauged stream inputs including the Rowley River). Edge erosion (E) refers to the sediment entering each section of the river via erosion of marsh creek banks. (a) Surface
accretion is the mass of sediment coming fromflood tide waters that sustains marsh elevation gain. Resuspension (R) and
settling (S) refer to solids that exchange between the water column and creek bottoms in association with variations in tidal current velocities. Ocean refers to the sediment that enters or exits from the ocean. All terms including the standing stock of total suspended solids in the water column of each estuarine section were measured explicitly in this study except
National Science Foundation-supported, PIE-LTER for the past 15 years and concluded that the marshes throughout the system have been increasing in elevation at about the same rate as historic records of SLR (National Oceanic and Atmospheric Administration, 2.8 mm per year since 1920). The increase in sea level at this site is primarily driven by the increase in sea surface height. Subsidence as determined by repeated measures of the heights of dozens of SETs over the past decade is not discernible. Mineral and organic matter contributions to elevation gain were determined from specific measures of sediment bulk density, organic carbon density, mineral content, and organic matter content (PIE-LTER database; see also Hopkinson et al., 2012; Morris et al., 2016; Schmidt et al., 1998).
We also calculated inorganic and organic sediment inputs from the simultaneous solution of two equations. The organic input can be met from a combination of in situ accumulation of undecomposed marsh plant roots and rhizomes and particulate organic carbon (POC) from estuarine tidal waters. Thefirst constraint is that the proportions of organic (x) and inorganic (y) inputs (MT/yr) must be consistent with the observed organic matter fraction of marsh sediments of 0.3, so that
1. x/(x+y) = 0.3
The second constraint is that the total volume (V) required annually must be met by the sum of individual inorganic and organic inputs (Morris et al., 2016), given by
2. V=x/k1+y/k2
where the constantsk1andk2are the self-packing densities of organic and inorganic sediment or 0.085 and
1.99 MT/m3(Morris et al., 2016; Schmidt et al., 1998; PIE-LTER database), respectively. ArcMap 10.2.2 was used to calculate the surface area of marsh in each section using the surface volume tool querying the 2005 DEM as to area between 0 and 2 m in elevation. We used previous studies of Plum Island Sound estuarine hydrody-namics and metabolism for estimates of water volumes along the length of the estuary (see Vallino & Hopkinson, 1998; Vallino et al., 2005).
2.5. Distribution and Mass of Total Suspended Solids Along the Estuary
The spatial distribution of total suspended solids and other substances has been monitored by the PIE-LTER during spring, when riverflow is highest, and fall, when riverflow is lowest, for the past 15 years. We used the median of all spring and fall data over this interval as the average mass of material suspended in the water column for the four estuarine sections. This is the material that is potentially deposited on the marsh during high tide inundation. We acknowledge the potential importance of resuspension during storms, which is not accounted for by our sampling approach, and discuss this further in the discussion. Water samples from 11 stations spanning the full salinity gradient and length of the estuary are sampled, returned to the laboratory, andfiltered through precombusted (450 °C) and preweighed GF/Ffilters (Whatman brand with nominal 0.7-μ m pore size) until clogged. Filters were dried to constant weight at 60 °C, then weighed to determine mass of total suspended solids or to determine C content by Perkin Elmer CHN elemental analyzer after acidification. A subset offilters was ashed at 450 °C then reweighed to determine percent loss on ignition and, by differ-ence, percent organic matter and mineral content. Chlorophylla(chl-a) was determined from a secondfilter using acetone extraction, accounting for phaeophyton (Strickland & Parsons, 1972). From these measures, we estimated the mass of total suspended solids in each section of the river and the relative importance of algae, other particulate organic matter (POM), and mineral matter. We converted POC to POM assuming 50% C. We converted chl-ato carbon and then to POM assuming a 60:1 chl-ato C ratio.
2.6. Estimation of Total Suspended Solids Resuspended During a Single Tidal Cycle
[median + MAD] and [median-MAD], e.g., median of 10 mg/L and MAD of 4, gives resuspension of 8 mg/L from [10 + 4][10–4]). To estimate resuspension on an annual basis we accounted for the number of tidal cycles in a year (~730).
2.7. River Loading of Particulate Matter
We used total suspended sediment (TSS) concentration data collected by the PIE-LTER and U.S. Geological Survey (USGS) discharge data for the Parker and Ipswich Rivers (USGS ID = 01101000 and 01102000, respectively) to calculate mean annual loading of suspended solids into the Plum Island Sound estuary. We scaled USGS discharge data to cover ungauged portions of the watersheds using scaling factors determined in Vallino and Hopkinson (1998). Flow-weighted mean TSS was esti-mated for each watershed using just under 9 years of monthly data col-lected between the end of 2006 and 2014 (n= 98 samples). Data were collected over 3 orders of magnitude variation in river discharge, and a range of baseflow and stormflows, including both rising and falling limbs of storm hydrographs. Monthly sampling was assumed to pro-vide adequate estimates of longer term TSS concentrations in these riv-ers because discharge is notflashy due to the relatively high wetland abundance that store and release stormflows. Dissolved organic carbon (DOC) floc was similarly estimated from total DOC inputs from the watersheds, assuming 10% of DOC in freshwaterflocculates as sedi-ments. Inputs were distributed to the respective boxes (Figure 2) as appropriate.
2.8. Marsh Edge Erosion Estimation
Erosion at the marsh-water edge was assessed by analyzing the three-dimensional change described by the difference between the 2005 and 2011 DEMs of the marsh edge (Figures 3 and 4). Based on the hypsometric profile of the cumulative distribution of marsh area versus marsh elevation for the entire marsh (Figure 5 in Millette et al., 2010), we chose the 1-m contour as the best demarcation point for the“edge”of the marsh— still on the marsh, yet not down the marsh ramp, where elevation rapidly drops. When erosion of the marsh edge occurs, the marsh ramp continues to exist, but it moves inland across the marsh platform. It is the marsh platform that loses area and sediment volume. We quantify edge erosion by examining change in a 10-wide zone (buffer) behind the 1-m contour (up across the marsh platform) as defined in 2005. Erosion occurs when the edge advances across the platform buffer, ultimately causing a decrease in total marsh area and an increase in open water area.
We used ArcMap 10.2.2. to develop a buffer shapefile and to calculate the volume of sediment lost during the 2005–2011 interval. The shapefile was based on the 2005 DEM and included only the 10-m wide buffer greater than or equal to the 1.0-m elevation contour. This contour follows the shorelines of all water bodies, including the Sound,first through fourth-order tidal creeks, and most mosquito ditches and marsh ponds. We also created shapefiles for each of the four zones along the estuary (Figure 1): 0–5, 5–10, 10–15, and 15– 24 km. These shapefiles were used to quantify edge erosion, and the areas of marsh (0–2 m elevation) and water (<0 m elevation) for each zone. Having four zones enabled us to compare and contrast reaches with and without riverine inputs and to contrast the sound from the tidal river. As mentioned earlier there is also a great range in marsh area to water areas from the top zone to the bottom (Sound) zone.
The sequence of steps we employed in creating a buffer shapefile is (1) convert all elevations to integers starting with our 2005 DEM; (2) reclassify all elevations into the binary 0 or 1 depending on whether elevation was<1 m or≥1 m to define the marsh platform; (3) convert from raster to polygon in order to define 3 zones as shapefiles—marsh only, water only, and water plus 10-m buffer adjacent to water and of elevation greater than 1 m; (4) remove water from the buffer, leaving only the buffer as a shapefile; and (5) extract the buffer from the 2005 and 2011 DEMs.
We calculated edge erosion using the ArcMap tool,functional surface/surface area and volume, querying the 2011 DEM (just the buffer) as to the area and volume below 1 m in elevation. Remember that the entire buffer
Figure 3.An example from along the northwestern edge of Plum Island Sound
showing the delineation of the 10-m buffer. Note that the buffer is readily
apparent along mosquito ditches,first, second, third, and fourth-order tidal
creeks, Plum Island Sound, and marsh ponds. The blue rectangular box deline-ates the zone where we show selective results of marsh edge erosion during the
was≥1 m in elevation in 2005 and the area<1 m was by definition 0. Any surface lower than 1 m in 2011 represented erosion that occurred between 2011 and 2005.
2.9. Carbon Dating of Estuarine Suspended Particulate Organic Matter
We14C-dated the suspended POC of estuarine water to determine the presence of eroded marsh peat in the water column. If eroded marsh peat is an important source of sediment for the marsh platform, it has to be resuspended into the water column prior to its being deposited on the marsh. Samples were collected along the length of the estuary 4 times over 3 years, during times of high and low river discharge. Estuary water was
filtered through ashed (450 °C) 2.5-cm GF/F (nominal pore size, 0.7μm)filters using a 100-mL glass syringe. Filters were frozen until preparation. In the laboratory,filters were acid-fumed to sparge off any inorganic C and then dried and sent to the National Association of Oceanic Mass Spectrometry (NOSAMS0 facility in Woods Hole for accelerator mass spectrometric analysis ofΔ14C andδ13C). All reportedΔ14C values were cor-rected for fractionation using theΔ13C values of the samples, according to the conventions of Stuiver and Pollach (1977). The potential contribution of eroded ancient marsh peat to the distribution of suspended POC along the estuary was calculated with a simple end-member mixing model ofΔ14C using the average
Figure 4.Example of edge erosion for three transects (dark green dotted lines on map) adjacent to the NW shoreline of
Plum Island Sound (see Figures 2 and 3). The map to the left shows the 10-m buffer delineated from the 2005 digital elevation model. The green band along the right side of the buffer represents area that had eroded by 2011. Cross sections
Δ14C value measured at 67.5 cm depth in a core taken from the high marsh platform as described below
(Raymond and Hopkinson (2003).
2.10.14C Dating of Marsh Organic Matter
We also14C-dated the depth distribution of organic carbon in Plum Island marsh sediment to check whether any of the ancient marsh organic carbon that erodes from marsh edges is returned to the marsh platform dur-ing tidal inundation. The presence of ancient organic carbon in near surface sediments could be indicative of this process. We analyzed just the humin fraction of sediment organic matter. This is the organic carbon frac-tion bound by clay minerals that often contaminates bulk sediment in archeological studies causing its age to deviate substantially from the charcoal, wood, or plant macrofossils of interest (McGeehin et al., 2001). We assume that the presence of ancient humin carbon near the marsh surface is an indication that it is derived from tidal waters with suspended ancient humin-POC. As the vast majority of organic matter near the marsh surface is expected to be live and recently dead roots and rhizomes of marsh plants, by sampling the age of humin material, we minimize the contribution of organic matter recently produced in situ. As the humin is likely clay bound, the presence of ancient humin is likely indicative of mineral matter also eroded from the marsh edge.
We analyzed a single core collected in 2006 from the high marsh adjacent to the Rowley River near where the PIE-LTER project monitors marsh productivity. The core was subsampled at depths of surface, 2.5, 22.5, 42.5, and 67.5 cm. Subsamples were passed through a 63-μm screen after removal of any visibleSpartina macro-organic matter and then treated with acid-alkali-acid washes following the procedure in McGeehin et al. (2001) to remove all but the humin fraction (the classical humic and fulvic acid fractions are alkali soluble and hence removed). The humin fraction for each layer was isolated, dried, and analyzed for14C at the NSF-Arizona Mass Spectrometry Facility at the University of Arizona. Mass balance was not determined so we do not know the percentage humin relative to bulk organic content.
2.11. Mass Balance Estimation of Sediment Shortfall in Meeting Marsh Accretionary Needs
Sediment required to support measured rates of marsh elevation gain (marsh sediment accretion) was balanced against measured inputs from the watershed (River) and measured rates of marsh edge erosion (equation (1)) to determine the accretion shortfall. As equation (1) indicates, two potential sediment sources could make up for the shortfall: (1) net ocean exchange and (2) net tidalflat and bay bottom erosion. We examined each separately, assuming all or nothing, even though it is likely a combination of the two occurs. Thus, our estimates of these inputs are likely high. On the other hand, if not all river or edge erosion inputs are retained within the system and deposited on the marsh platform, our mass balance estimation of the shortfall will be underestimated.
Mass balance was also used in the net tidalflat erosion scenario to assess sediment settling following resus-pension. The amount settling back to tidalflat and bay bottoms is the difference between the amount resus-pended and the amount required to meet the marsh sediment accretion shortfall: resuspension minus net tidalflat erosion = sediment settling. The difference would result in water body deepening, if the shortfall was not made up by oceanic inputs.
3. Results
3.1. Marsh Sediment Accretion
Based on analysis of over twenty 16 × 50 cm cores collected along the estuary with varying distances from tidal creeks, we found no significant spatial patterns for marsh sediment bulk density or the relative mineral versus organic matter composition of sediment throughout the estuary (Schmidt et al., 1998, PIE-LTER data-base). There was considerable variability, however. Bulk density averaged 0.272 mg cm3(standard error [SE] = 0.022), and mineral and organic fractions of sediment dry weight were 0.7 and 0.3 g g1, respectively. These values are similar to those reported in Morris et al. (2016) and follow closely the power function that described the relation between bulk density and organic content for over 5,000 sediment samples from 33 tidal marshes and mangroves distributed around the United States.
estuary is skewed highly toward the marshes adjacent to Plum Island Sound because 75% of all marshes are found in this region. By contrast, only 1,110 and 1,292 MT yr1are required to meet needs in the upper two zones of the estuary. Mineral inputs required to meet marsh elevation changes range from 778 to 16,928 MT yr1 along the length of the estuary. Organic matter inputs to meet marsh changes ranged from 332 and 7,253 MT yr1.
3.2. River Loading of Particulate Matter
The annual loading of TSS from the watersheds varied over an order of magnitude between 2007 and 2014, from<300 to>5,000 MT yr1. The 8-year average was 2,656 MT yr1(SE = 561). This wide range over time is primarily due to the extreme range in discharge during the same time period (226–608× 106m3yr1). The average discharge during the 8-year record was approximately 10% higher than the USGS 80-year average. POM loading (a subset of particulate matter) averaged 823 MT yr1(SE = 172) and varied as much over the 8-year record as total suspended solids. We also include an estimate of organic carbon thatflocculates when in contact with the high salinity estuarine waters, assuming that 10% of total DOC loading flocculates (Sholkovitz, 1976). Dissolved Fe, Mn, and Al alsoflocculate with the humics, but at insignificant mass relative to organic matter itself. We estimate that organic matter thatflocculates from river water contributed an additional 554 MT yr1(SE = 48) to the particulate matter input to the estuary. DOC input was much less vari-able than particulate loading. Total particulate loading averaged 3,210 MT y1, of which 43% was organic and 57% was mineral matter.
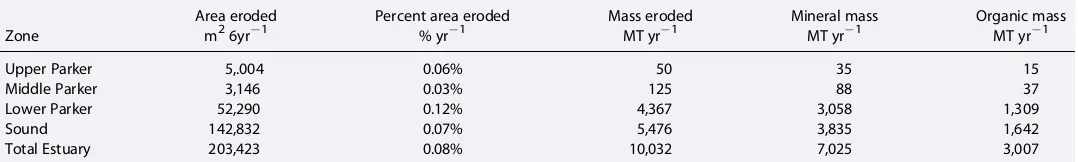
3.3. Marsh Edge Erosion
Erosion of the marsh edge was readily detected over the 2005–2011 LIDAR defined interval (Figure 4 and Table 2). Measures along the northwestern shoreline of Plum Island Sound (shown in Figure 4) agree favor-ably with direct measures along a 1-km stretch of shoreline between 2008 and 2013 (Leonardi & Fagherazzi, 2014, 2015). The area of marsh land lost in each region of the estuary ranged from 3,146 to 142,832 m2over the 6-year interval (Table 2). While significant in terms of mass, this level of erosion repre-sents a small fraction of total marsh area in each region—losses ranged from 0.03% of the mid-Parker section to 0.12% of the lower-Parker region. Only 0.07% was lost annually from the marsh boundaries in the Plum Island Sound region of the estuary.
Table 1
Mass of Mineral and Organic Matter Needed for Marshes to Maintain Elevation Relative to a Sea Level Rise Rate of 2.8 mm yr1 for the Four Zones Along the Plum Island Sound Estuary
Estuarine zone Area (km2) Total mass (MT yr1) Mineral (MT yr1) Organic (MT yr1) % Mineral
Upper Parker 1.46 1,112 778 333 70%
Middle Parker 1.70 1,292 905 388 70%
Lower Parker 7.51 5,716 4,002 1,714 70%
Sound 31.76 24,179 16,928 7,251 70%
Total 42.43 32,299 22,613 9,686
Note. Based on a sediment bulk density of 0.28 g cm3and organic content of 30%.
Table 2
Estimated Edge Erosion Throughout the Plum Island Sound Estuary in Terms of Area Eroded and the Mass of Sediments Associated With That Erosion During the Period 2005–2011
Zone
Area eroded Percent area eroded Mass eroded Mineral mass Organic mass
m26yr1 % yr1 MT yr1 MT yr1 MT yr1
Upper Parker 5,.004 0.06% 50 35 15
Middle Parker 3,146 0.03% 125 88 37
Lower Parker 52,290 0.12% 4,367 3,058 1,309
Sound 142,832 0.07% 5,476 3,835 1,642
The mass of sediment lost (calculated from measured bulk density) was estimated to be 10,023 MT yr1, with almost an order of magnitude more from the Lower Parker and Sound zones than the middle and upper Parker zones. Considering that the average mineral content of Plum Island marsh sediments is 70% mineral matter by weight (Morris et al., 2016; Schmidt et al., 1998, PIE-LTER database), mineral matter inputs to estuarine waters from edge erosion ranged from 37 to 3,836 MT yr1for the various zones and totaled 7,019 MT yr1.
3.4. Sediment Storage in the Water Column
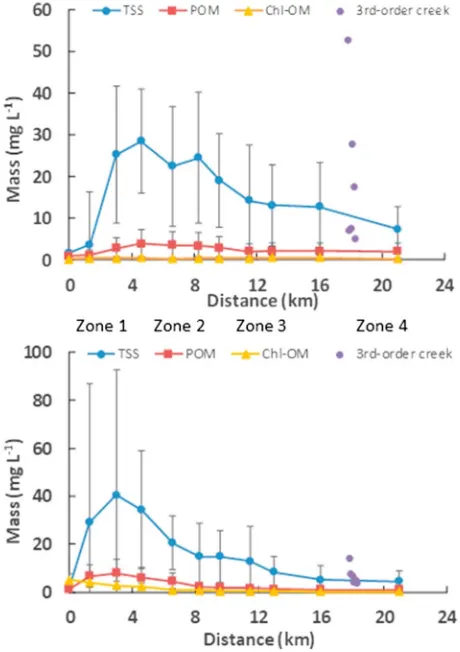
The water column stock of suspended solids (particulate matter, TSS) shows the typical estuarine longitudinal distribution with a distinctive estuarine turbidity maximum in the oligohaline region of the estuary (Figure 5). The distribution is shifted down-estuary in spring reflecting higher freshwater runoff with lower salinities and lower TSS tions in the upper estuary. Median total suspended solid concentra-tions range from less than 10 mg L1at the head and mouth of the estuary to 30–40 mg L1within the estuarine turbidity maximum dur-ing sprdur-ing and fall. The median TSS concentration over space and time was 15.6 mg L1(SE = 3.6). Variability at any one station is very high, reflecting that these data represent 13 years of transect data taken dur-ing sprdur-ing and fall: Average CV for all stations was 97 and 93% for spring and fall, respectively.
The spatial distribution of POM and chl-ais similar to that of total par-ticulate matter, but median concentrations are considerably lower. POM comprised between 11 and 59% of TSS at any 1 station, but aver-aged 17%. The overall median POM concentration was 2.7 mg L1 (SE = 0.5). It was only at the very head of the estuary, just below the Parker River dam, that POM made up over 50% of total suspended solids, consistent with expectations based on watershed measure-ments. Chl-a(converted to OM), a proxy for live phytoplankton, made up between 8 and 75% of POM, but averaged 37%. The overall median chl-a concentration was 1.0-mg organic matter L1 (SE = 0.2). Phytoplankton comprised a larger fraction of the total POM in fall (53%) than in spring (16%), reflecting the long residence time of water relative to phytoplankton growth rates in late summer/early fall. On average, mineral matter made up the largest fraction of suspended solids along the Plum Island Sound estuary— aver-aging 83%. The organic fraction made up only 17% of the total.
The mass distribution of suspended solids along the estuary reflects both concentration and volume of water in each region of the estuary. The mass averaged about 16 MT in zone 1 of the upper Parker River portion of the estuary and 182 MT in zone 4, the Sound portion of the estuary (Table 3). The average total mass of solids for the entire estuary was 284 MT. Thus, about one third of the total mass of suspended solids is in the Parker River portion of the estuary and two third is in waters of Plum Island Sound.
3.5. Isotopic Evidence of Creek Bank Erosion and Tidal Deposition of Ancient Eroded Material Onto the Marsh Surface
3.5.1. Estuarine Distribution ofΔ14C-Depleted Particulate Organic Carbon
The concentrations of POC in the estuary were consistently elevated relative to the river or marine end-members, which is indicative of an internal source of POC. Of particular interest for this study was the appearance of organic carbon that likely came from erosion of old marsh peat. Of our four isotope sampling transects, two showed the internal input of old,Δ14C-depleted material—April 2000 and September 2000, and one showed an input ofδ13C-enriched OC. In September 2000 (Figure 6 and Table 4),Δ14C-POC values ranged from 27 to 182‰ (Raymond & Hopkinson, 2003), with a corresponding 14C age of 220 to 1,614 years B.P. (Table 4).
Figure 5.Thirteen-year median (CV, error bars) distribution of total suspended
solids, particulate organic matter, and chlorophyllaconverted to organic
mat-ter along the main axis of the Plum Island Sound estuary in (top) spring (during
high riverflow) and (bottom) fall (during low riverflow). Also shown is the
The most likely source of thisΔ14C-depleted,δ13C-enriched organic car-bon was marsh peat eroded from marsh edges. It did not come from contemporaneous watershed or ocean inputs as the POC of both these sources was moreΔ14C-enriched than in the estuary in September, 47‰ for the watershed (Raymond & Hopkinson, 2003), and 48‰ for the ocean (Table 4). Watershed POC was δ13C-depleted at 32.9‰(Raymond & Hopkinson, 2003). Theδ13C-enriched signal in the estuary is consistent with an input of Spartina organic matter.
Δ14C-depleted,Spartina-derived organic carbon is indicative of eroded,
old peat from marsh shorelines. The potential contribution of eroded marsh peat to the distribution of suspended POC along the estuary in September averaged 25% but ranged from 9 to 63% along its length, based on the end-member mixing model and an averageΔ14C value for marsh peat at depth of220‰. 3.5.2. Distribution ofΔ14C-Depleted Organic Carbon in Marsh Sediments
The<63μm presumably clay-bound fraction of organic matter in a Plum Island Sound marsh core wasΔ14C depleted with values averaging220‰and ranging from194 to307‰, except for the marsh surface, which had a value close to modern levels (Levin & Kromer, 1997; Table 5 and Figure 7). The corresponding
14C age of the subsurface sediments was 1,806 to 2,976 years B.P.
Organic carbon, 1,800–3,000 years old in near surface marsh sediments is not what would be expected in marshes that have been building vertically for almost 4,000 years (Hein et al., 2012) but is consistent with the input of eroded peats resuspended in the water column and depos-ited during marshflooding. As we saw in September 2000, old marsh peat on occasion makes up 25% of the suspended estuarine POC.
3.6. Resuspension Fluxes
Our estimate of the amount of sediment resuspended and settled into and out of the water column in association with variations in tidal cur-rent velocity and waves was extremely large:>187,000 MT yr1 for mineral matter and>30,000 MT yr1for organic matter (Table 6). For mineral matter, it ranges from over 10,000 MT yr1in the upper estuary to over 130,000 MT yr1in the Sound. For organic matter it ranges from over 1,200 MT yr1to over 22,000 MT yr1for the upper estuary and Sound, respectively. We note that this value represents only fair weather values (because we sampled by small motorboat) and there-fore may underestimate true annual resuspension. This spatial pattern mostly reflects differences in water volume for various sections along the estuary (factor of 40) as differences in suspended solids concentra-tion and varied by less than a factor of 10 (Table 3 and Figure 5). There were no spatial gradients in TSS variability along the estuary (MAD averaged 42% relative to the median overall). The high resuspension
flux relative to the average mass of suspended solids in the estuary (Table 3) suggests a very rapid turnover rate (>700 yr1).
3.7. Mass Balance
The mass balance identifies a large shortfall between marsh accretion needs and measured sediment inputs from rivers and the erosion of marsh shoreline edges (Table 6). Rivers supply only 3,210 MT yr1 and edge erosion supplies 10,032 MT yr1or 10% and 31% of marsh accretion needs, respectively. The mass balance shortfall amounts to 19,070 MT yr1and is slightly higher for mineral matter (61%) than organic matter (55%). Indeed, riverine and edge erosion sources are insufficient to meet accretionary demands in any section of the estuary. The shortfall is greatest in zone 2 of the estuary, a zone of no direct Table 3
Mass of Mineral and Organic Fractions of Suspended Solids (Excluding Phytoplankton) Along the Length of the Plum Island Sound Estuary Based on 13 Years of Spring and Fall Sampling
Estuarine zone
Total solids (MT)
Mineral fraction (MT)
Organic fraction (MT)
Upper Parker 16.3 14.5 1.8
Middle Parker 27.7 24.6 3.1
Lower Parker 57.9 50.9 7.1
Sound 181.6 154.5 27.1
Total 283.6 244.5 39.1
Figure 6.(top) Particulate organic carbon concentration andΔ14C-POC versus
conductivity (dots) and the conservative mixing curve (curved line in bottom
figure) along the entire length of the Plum Island Sound estuary in September
2000. Plotting against a conservative tracer is essential for using a two end-member mixing model to calculate the mass of ancient marsh carbon required
riverine input of sediments, and least in zone 3, a region with large edge erosion. Two possible sources of sediment to balance marsh accretionary needs are discussed in the conclusions: (1) the ocean and (2) estuarine tidalflats and bay bottoms.
4. Discussion
We used the mass balance approach to examine both mineral and organic particulate matter sources and sinks within the Plum Island Sound estuary. Both forms are important components that contribute to the bulk volume of marsh sediments (Gosselink et al., 1984; Morris, Shaffer, et al., 2013; Morris et al., 2016) and elevation gain of marshes over time. While mineral matter contributes to elevation gain only through surface deposition, organic matter can be accumulated by sur-face deposition or by in situ net production of refractory root and rhi-zome tissues (Cahoon et al., 2003; McKee et al., 2007). It is challenging to tease apart the relative importance of these two path-ways. We draw on additional studies conducted in the Plum Island Sound ecosystem to put the results of this study in perspective. Measures of metabolism using the eddy cov-ariance approach in the marshes adjacent to Plum Island Sound show net ecosystem exchange (NEE) to aver-age 168 gC m2yr1(Forbrich et al., 2018), indicating the potential for accumulation of refractory root and rhizome material produced in situ. If all the NEE is associated with belowground production, then in situ pro-duction can provide 147% of the organic matter required to support historic rates of marsh elevation gain of 2.8 mm yr1(Forbrich et al., 2018). Thus, there is no need for additional organic matter inputs to maintain marsh elevation gain at the rate of 2.8 mm yr1. Interestingly, marker horizons show that accretion of mineral and organic matter on the marsh surface (Cavatorta et al., 2003) matches total marsh elevation gain as observed with SETs (Wilson et al., 2014; PIE-LTER database). Thus, in addition to net belowground production of organic matter, there is an additional input of organic matter to the marsh deposited during tidal inunda-tion. We do not have quantitative measures of the mass of organic matter accumulating over marker hori-zons, just depth. We can estimate organic matter deposition, however, on the basis of the amount of mineral matter associated with marsh accretion (Table 6) and the relative organic matter content of total sus-pended solids in tidal water (mineral matter * [1 (mineral/TSS)] converted to organic matter or 1,570 MT yr1. If none of the deposited organic matter is decomposed (unlikely), this is only 16% of the amount organic matter required to support marsh elevation gain (Table 6). Surface organic matter deposition could become more important in the future if the balance between primary production and respiration shifts toward less NEE with a changing climate (Megonigal et al., 2016). Therefore, the Plum Island Sound marshes are both a sink for mineral and organic matter brought in from a variety of potential sources (e.g., river and edge erosion) and a source of organic matter for the estuary and perhaps the coastal ocean. Estuarine meta-bolic studies show the estuary to be heterotrophic and dependent on allochthonous organic matter inputs from the marshes (Vallino et al., 2005).
As there are large differences in the relative importance of sediment sources along the length of the estuary, we discuss them separately.
4.1. Rivers
Particulate matter inputs from rivers draining into the estuary were of low overall importance in meeting accretionary needs of estuarine marshes (Figure 8 and Table 6). On average, river inputs are equivalent to 8% of marsh mineral needs and 14% of organic matter needs. The large organic contribution reflects the high organic content of riverine suspended particulate matter (31%) and the fact that we included dis-solved organic matter thatflocculates once it meets the higher ionic strength of seawater as a river input of particulate matter. River inputs were very important in meeting accretionary needs in zone 1, the upper estuary, with inputs equivalent to 30% of mineral (Figure 8) Table 4
Δ14
C,14C Age, and Concentration of Particulate Organic Carbon (POC) in the Water Column Along the Entire Length of the Plum Island Sound Estuary in September 2000
Conductivity
(mS cm1)
Δ14C
(‰)
14C age
(B.P.)
[POC]
μmol L1
% of POC marsh derived
0.29 47 0 47 0
0.92 35 328 207 12%
2.67 131 1,119 196 45%
5.5 27 203 131 9%
15.3 53 583 105 18%
25.7 68 1,212 92 23%
45.3 182 1,594 53 63%
50.4 49 328 31
Average 25%
Note. Potential contribution of eroded ancient marsh peat to total POC
calcu-lated assuming no contribution from the watershed and an averageΔ14C of
marsh peat of220‰(Table 4).
Table 5
Isotopic Evidence for the Deposition of Ancient Organic Matter Onto the Marsh via Tidal Flooding
Sample depth (cm)
14C age (B.P.)
andΔ14C
Calibrated 2σformation
time range
Surface (0) Modern 70 1950s
2.5 1,832–197 82 to 313 A.D.
22.5 1,806–194 90 to 334 A.D.
42.5 2,976–307 1371 to 1055 B.C.
and 53% of organic matter needs. In contrast, river inputs are able to meet only between 0 and 14% of particulate needs lower in the estuary. The importance in the upper estuary reflects the small wetland area there relative to the mass of inputs—only 3% of estuarine marshes are in the upper stretches of the estuary.
While riverine inputs of sediment are a large component of estuarine sediment budgets in some systems (e.g., 40% in the Brisbane Estuary, 50% in the Hudson River estuary, and 28% in the Chesapeake Bay estu-ary), the relatively low importance in the Plum Island Sound estuary should not be unexpected (Eyre et al., 1998; Geyer et al., 2001; Hobbs et al., 1992). The overall sediment yield from the Ipswich and Parker River watersheds is extremely low (3.1 MT km2) in comparison to the range reported in the literature: 5–1,460 MT km2 (Lane et al., 1997) and the global mean of 120 MT km2(Syvitski et al., 2005). The low relief of the Ipswich and Parker River watersheds, coupled with relatively high freshwater wetland and forest land cover and high den-sity of dams, retards sediment erosion and promotes sediment trap-ping within the watershed itself.
The importance of riverine particulate matter inputs may decline in the future given current trends in declining river sediment inputs region-ally and globregion-ally (Meade & Trimble, 1974; Milliman & Syvitski, 1992; Syvitski et al., 2005; Weston, 2013). Agriculture has declined consider-ably in the Parker and Ipswich River basins over the last century, replaced by forest (Claessens et al., 2006). In recent decades, urban areas have expanded. Forest lands have much lower erosion rates than agriculture or urban areas. However, urbanization is concentrated in the upper portions of the largest watershed draining to the estuary (Mineau et al., 2015). It is unlikely that much of the urban sediment sources are currently reaching the estuary because of the distant loca-tion of sources combined with the shallow slopes, extensive riparian wetlands, several reservoirs, and expanding beaver ponds in the region (Wollheim et al., 2014, 2015). Ongoing and potential human dam
Figure 7.Δ14C and14C age of clay-boundfine particulate organic carbon
distri-bution in a core ofSpartina patensmarsh sediment from the Plum Island Sound
estuary.
Table 6
Balance of Sediment Fluxes in the Plum Island Sound Estuary
Zone 1 Zone 2 Zone 3 Sound Total estuary
Sediment source or sink Mineral
Organic
matter Mineral
Organic
matter Mineral
Organic
matter Mineral
Organic
matter Mineral
Organic matter
Marsh accretion 778 333 905 388 4,002 1,714 16,928 7,251 22,613 9,686
River 237 178 0 0 227 171 1,369 1,028 1,833 1,377
Edge erosion 35 15 88 37 3,058 1,309 3,835 1,642 7,025 3,007
Shortfall 506 140 817 351 717 234 11,724 4,581 13,764 5,306
Percent missing 65% 42% 90% 90% 18% 14% 69% 63% 61% 55%
Ocean scenario
Ocean or lower estuary 506 139 817 350 718 234 11,724 4,580 13,765 5,303
Cumulative from lower estuary or ocean
506 139 1,323 490 2,041 723 13,765 5,303
Tidalflat scenario
Resuspension 10,321 1,276 16,758 2,116 29,801 4,137 130,382 22,864 187,263 30,393
Settling 9,815 1,136 15,941 1,765 29,084 3,903 118,658 18,283 173,499 25,087
Percent retained on marsh
5% 11% 5% 17% 2% 6% 9% 20% 7% 17%
removals will lead to increasing sediment exports (Foley et al., 2017; Magirl et al., 2015; Warrick et al., 2015). Current dam removals are in midreaches of the watershed so that even if sediments are liberated following dam removal, most will probably be trapped behind dams lower along the river. However, the head of tide dam in Ipswich is also currently being discussed for potential removal, which would have a much greater impact on sediment loading if it was removed.
Climate change may also contribute to altered sediment delivery in the future. Spring runoff is less pro-nounced than previously due to less snowpack (Claessens et al., 2006), and this may decrease the sediment load to the estuary. Cook et al. (2015) suggest that a wetter future climate in the New England region will con-tribute to a greater incidence of landslides, which will have a greater influence on erosion than land use change. The low relief of the Parker and Ipswich River watershed, however, will likely not translate into land-slides as observed in more mountainous regions of New England. However, future climates are also likely to result in greater extreme events, which could lead to storm events with sufficient power to transport more sediments to the estuary (Dhillon & Inamdar, 2013).
Our estimate of sediment inputs to the estuary is based on almost a decade of sampling (end of 2006 through 2014) at river stages running from record highs to record lows since 1929 and on rising and falling limbs of storm hydrographs. It is possible that we have underestimated sediment inputs, but even if we are off by a factor of 2, the relative importance of river inputs of particulate matter would only increase from 8% to 16%. It appears that given the increase in rates of SLR in the past century, watershed inputs of sediments have not played an important role in marsh expansion and elevation gain since the mid-1800s when land clearing and agriculture were at their greatest extent (Kirwan et al., 2011; Priestas et al., 2012). Agricultural abandon-ment, reforestation, and damming likely contributed to declines in sediment yield from the watershed since then, as has been observed elsewhere (Meade & Trimble, 1974; Milliman & Syvitski, 1992; Syvitski et al., 2005; Warrick et al., 2013; Weston, 2013).
4.2. Edge Erosion
Our measures of marsh shoreline erosion support our personal observations of marsh loss over the past 25 years, empirical data on shoreline erosion in Plum Island Sound (Leonardi & Fagherazzi, 2014, 2015), and simulation models that predict bay expansion due to low estuarine suspended solids concentrations and SLR (Mariotti & Fagherazzi, 2010, 2013). Our results show that shoreline erosion is prevalent throughout the Plum Island Sound estuary, however, and not just where it has been measured byfield survey in the Sound (Leonardi & Fagherazzi, 2014, 2015). On an absolute basis, annual erosion rates from zone to zone ran-ged from 834 to 23,800 m2, being least in the upper 5 km of the estuary and greatest in the marshes adjacent to Plum Island Sound. The percentage of marsh area lost was low for all regions and ranged from 0.03% to 0.12% per year. While the area eroded was related to the area of marsh in each region (R2 0.68), edge
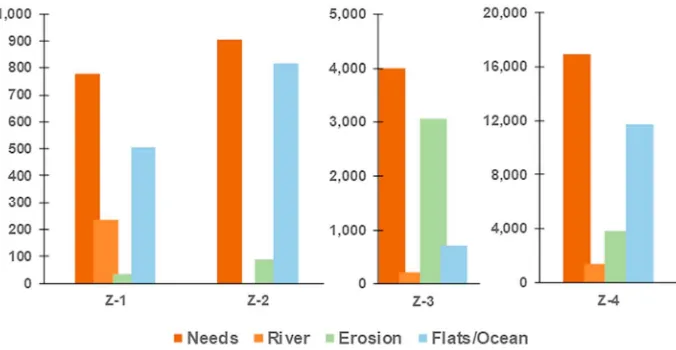
Figure 8.Summary of river, shoreline erosion, and ocean or tidalflats and creek bottom mineral sediment inputs to
marshes in four zones along the Plum Island Sound estuary that enable marshes to maintain elevation relative to current
erosion was disproportionately higher in zone 3 of the estuary with erosion rates twice the average for the entire estuary. At these rates of edge erosion and current rates of SLR and wave climates, 50% of existing marshes in the Plum Island estuary will have eroded within 1,000 years. Ganju et al. (2017) observed for micro-tidal systems on the east and west coasts of the United States that the ratio of unvegetated to vegetated marsh area (UVVR) for an estuarine system was a good indicator of marsh health, that is, a marsh complex that imported sufficient sediment to counter SLR and internal erosion. They found that as the UVVR increased (less marsh relative to water), the greater the net sediment budget deficit (sediment was being lost) and the shorter the lifespan of the marsh complex. Based on the average UVVR for Plum Island Sound marshes, which is 0.41:1, the lifespan should be on the order of 200 years based on the relation Ganju et al. found. This is much shorter than the rate we calculated based on measured edge erosion rates and presumably is related to the large sediment capital associated with the mesotidal Plum Island marshes that are perched above MHHW for the most part (Millette et al., 2010). Compared to a microtidal marsh, much more sediment volume must be eroded before the sediment stored in the marsh plain above mean sea level is expended through a net sediment deficit. This supports the idea of Kirwan et al. (2010) that vulnerability of marshes to submer-gence decreases with increasing tidal range.
Hughes et al. (2009) and Wilson et al. (2014) previously documented headwater erosion and widening for
first-order tidal creeks in Plum Island Sound estuary. Our results agree with observations of marsh shoreline erosion from other tidal wetland systems as well, for example, marsh losses in Louisiana,>25% marsh area lost since late 1800s (Blum & Roberts, 2012); southern New England, losing marsh at rate of 0.42% yr1for past 30–40 years (Watson et al., 2017); Choptank River in Maryland, losing marsh at rate of 0.11% yr1 1939–1980 (Yarbro et al., 1983); and Rehoboth Bay in Delaware, edge erosion at 14–43 cm yr1over a 3-year period in 1980s (Schwimmer, 2001).
The liberated sediment has the potential to meet a substantial portion of marsh accretionary needs. As eroded marsh has the same mineral and organic content as the marsh platform, a cubic meter of eroded marsh can provide the necessary sediment for a large area of marsh: 1-m3volume lost per year (from ≤1-m erosion) is equivalent to 357-m2marsh surface at 2.8 mm yr1accretion. Edge erosion has the potential to meet on average 31% of the marsh organic and mineral needs of estuarine marshes currently in existence. The importance is especially high in zone 3, the Lower Parker River portion of the estuary, where we estimate that over three fourth of accretionary needs can be met by this pathway (Figure 8).
Our estimate of the relative importance of eroded marsh sediment in meeting accretionary needs of the marsh is potential only. Some material in undoubtedly exchanged with oceanic water during tidal mixing and lost from the system. LeMay (2005) suggested that mosquito ditches were an important sediment sink in heavily ditched portions of the Plum Island Sound marsh. Thus, an unknown fraction of eroded marsh sedi-ment actually is deposited on the marsh platform. Of course the same is true for sedisedi-ments derived from any internal or external source.
Modeling studies suggest that shoreline erosion will increase in the Plum Island Sound estuary in the future (Fagherazzi et al., 2013; Leonardi et al., 2016; Mariotti & Fagherazzi, 2013). With low suspended sediment con-centrations, increasing rates of SLR, and increasing rates of storminess for this region (Hayden & Hayden, 2003), tidalflats in front of eroding shorelines deepen as waves erode the marsh shoreline. As tidalflats dee-pen, wave height increases, which leads to a positive feedback that results in continued marsh deterioration (Mariotti & Fagherazzi, 2013).
4.2.1. Limitations to Importance of Edge Erosion in Meeting Marsh Accretion Needs
we only observed this strong signal in September implies that resus-pension of eroded peat is not continuous or that at other times of the year greater contributions from the watershed or estuarine phyto-plankton overwhelm the marsh peat signal. On that day, there was 17 MT of ancient POM suspended in the water column or enough to sup-port marsh accretion for 0.6 days (17 MT/26.54 MT d1average daily organic matter accretionary need; Table 6). The extremely short resi-dence time of particulate mineral and organic matter held in suspen-sion in the water column shows how dynamic these pools are and that the resupply rate is extremely high.
In addition to the presence of ancient peat resuspended in the water column, the near surface depth distribution ofΔ14C-depleted organic carbon in marsh sediments (Table 4 and Figure 4) was consistent with the deposition of old marsh peat via tidal flooding. We cannot rule out the potential importance of watershed-derived organic carbon as the source of ancient organic carbon, however, because at other times of the year theΔ14C of riverine POC was also nearly as depleted, aver-aging89‰and ranging from 47 to190‰(Raymond & Hopkinson, 2003). This is not far from our marsh peat value of220‰. The large
δ13C difference between watershed and Spartina-derived POC would
help clarify sources. Unfortunately, we lack a measure of theδ13C con-tent of theΔ14C-depleted humin fraction of marsh sediment OC.
4.3. Sources Calculated by Mass Balance: Tidal Flats or the Ocean
A mass balance shortfall in river and marsh edge erosion inputs in matching marsh sediment accretion unequivocally shows the need for an additional sediment source. Rivers and edge erosion together supply 39% and 45% of mineral and organic matter needs (Table 6 and Figure 9). The two most likely additional sources are inputs from the (1) ocean or inputs from (2) erosion of bay bottoms and tidalflats.
While we calculated budgets for both mineral and organic matter, our analysis approach is most appropriate for mineral matter because we found earlier that there is sufficient marsh NEE attributable to the accumula-tion of undecomposed root and rhizome material to supply in excess of 100% of organic matter accreaccumula-tion needs (Forbrich et al., 2018). Further work will be required to more fully understand the production, respira-tion, transport, export, and burial of organic carbon produced in Plum Island Sound estuary marshes and to balance the overall estuarine organic and inorganic carbon budgets. The remaining discussion pertains spe-cifically to mineral matter budgets.
The magnitude and relative importance of oceanic or tidalflat mineral sediment inputs vary over the length of the estuary. On the order of 500–800 MT yr1are required to balance the sediment shortfall in each of the three zones along the tidal river, while an order of magnitude more is required to meet mineral needs of the marshes adjacent to Plum Island Sound (11,724 MT yr1; Table 6 and Figure 8). In contrast, the relative impor-tance of additional mineral inputs is least in zone 3 (18%) and highest in zone 2 (90%).
We lack measures of net oceanic inputs or net erosion of bay bottoms and tidalflats for the Plum Island Sound system. A conceptual model lumped for the entire system simplifies discussion of the potential impor-tance of the tidalflat and oceanic inputs (Figure 9). The settlingflux is the balance between what is resus-pended with each tide (187,263 MT yr1) and the mass balance shortfall (13,764 MT yr1). If the ocean provides all the additional sediment required to balance the sediment budget, then settlingflux would be the same as the resuspensionflux. The settlingflux decreases in magnitude in direct proportion to a decrease in oceanic inputs, such that in the absence of oceanic inputs, all sediment would have to be derived from bay bottoms and tidalflats and the settlingflux would be 173,499 MT yr1(187,263–13,764).
4.3.1. Potential Ocean Sediment Inputs
A potentially large importance of oceanic sources in meeting marsh accretionary needs (Table 6 and Figure 9) was unexpected, especially considering the typically low concentration of total suspended solids (SSC) at the ocean end-member (Figure 5). However, based on the total mass of suspended solids entering the estuary
Figure 9.Sediment mass balance for the Plum Island Sound estuary
highlight-ing the measured and potential sources of mineral matter sustainhighlight-ing accretion and elevation gain of the marsh platform. The ocean input of sediment was
calculated by mass balance between accretion, river, and edge erosionfluxes,
assuming no net loss of resuspended solids. The difference between resuspen-sion and settling is exactly the same as the ocean input and was also calculated by mass balance, but in this case assuming no ocean inputs. Units: MT (median annual mass of total suspended solids mass throughout the entire
with each tide (tidal volume × maximum suspended solid concentration at the estuary-ocean inlet), the sedi-ment volume needed for marsh survival would be only 7% of the total. Ganju et al. (2017) suggest that the
flood-ebb SSC differential is a measure of net sedimentflux in the system, although a difference of 7% in SSC would be challenging to detect, considering the high variability in SSC in the estuary and expected spa-tial patterns across the inlet cross section.
While unexpected, ourfinding of critical ocean sediment inputs in support of marsh accretion is in agreement with other studies looking at overall estuarine sediment budgets (most of which lacked a focus on wetland survival; Eyre et al., 1998). Over 61% of external sediment inputs to the Brisbane estuary are oceanic (Eyre et al., 1998). A sediment budget for Chesapeake Bay showed that at least 40% of sediment originates from the ocean (Hobbs et al., 1992) as riverine inputs and shoreline erosion measured over the past 100 years could not match measured rates of bay deposition. In the Humber estuary, whilefluvial inputs were substantially larger than erosion inputs, mass balance indicated the need for substantial inputs from the ocean (Townsend & Whitehead, 2003). Geyer et al. (2001) observed a strong seasonality in ocean inputs of sediment to the Hudson River estuary, being most important during low riverflow, neap tide conditions. Meade (1969) concluded that under normalflow conditions most estuaries tend to import sediment from the sea. The cal-culated overall importance of ocean sediments is higher in the Plum Island Sound estuary than any of these previous studies.
The most likely source of oceanic sediments is the Merrimack River. Merrimack water enters the Gulf of Maine at the northern end of Plum Island and is carried south toward Plum Island Sound with the coastal current. Indeed, a complex recirculation loop between Plum Island Sound, the Merrimack River, and the coastal ocean was recently identified through hydrodynamic modeling (Zhao et al., 2010). Historically, most sediment form-ing Plum Island and involved in initial bay infilling was derived from reworking of glaciogenic shelf deposits, but since that time, the island has been in a stable postparaglacial state (Hein et al., 2012), dependent on riv-erine sources. But can we assume that as long as the barrier island remains stable, the oceanic sources of estuarine infilling will be stable as well?
4.3.2. Potential Tidal Flat Sediment Input
Sediment resuspended into the water column during everyflood and ebb tide is by far the largest sediment
flux we examined in the Plum Island Sound estuary, and mass balance shows that it can easily meet marsh accretionary needs (Figure 9). On average the resuspensionflux is 1 to 2 orders of magnitude larger than mineral inputs from rivers and edge erosion. The resuspensionflux is 14× larger than that needed for mass balance. The settlingflux, which represents the difference between resuspension and the amount required for marsh accretion mass balance lacking net oceanic inputs, is only 7% smaller than resuspension. Thus, only a small fraction of what is resuspended needs to be deposited onto the marsh surface in order for the marsh to maintain elevation relative to SLR.
If there is a net loss of sediments from bay bottoms and tidalflats, bottom elevations will decrease and water depths increase. Based on the mass of resuspended sediments deposited on the marsh platform, we estimate a net loss in elevation of 3–7 mm yr1(depending on Sound and tidal creek bulk density which ranges from 1 to 2 g/cc). In conjunction with SLR, this would amount to an average deepening of up to 1 cm yr1, a rate substantially in excess of SLR.
A deepening of tidalflats is in accordance with models of bay enlargement and marsh edge erosion under conditions of rising sea level and decreased sediment availability (Fagherazzi et al., 2013; Mariotti & Fagherazzi, 2013). As SLRs and tidalflats erode in conjunction with sediment lost to marsh accretion, tidalflat depths increase, which enhances waves and bottom erosion. Thus, the loss of resuspended sediments to marsh platform accretion results in a positive feedback to continued increases in tidal flat depth and bottom erosion.
4.4. Big Picture